
|
|||||
|
 | |
| |
| |
| |
| |
| |
|
Gene: DPP10 |
Gene summary for DPP10 |
| Gene information | Species | Human | Gene symbol | DPP10 | Gene ID | 57628 |
| Gene name | dipeptidyl peptidase like 10 | |
| Gene Alias | DPL2 | |
| Cytomap | 2q14.1 | |
| Gene Type | protein-coding | GO ID | GO:0006508 | UniProtAcc | B4DKB5 |
Top |
Malignant transformation analysis |
| Identification of the aberrant gene expression in precancerous and cancerous lesions by comparing the gene expression of stem-like cells in diseased tissues with normal stem cells |
| Entrez ID | Symbol | Replicates | Species | Organ | Tissue | Adj P-value | Log2FC | Malignancy |
| 57628 | DPP10 | HTA11_3410_2000001011 | Human | Colorectum | AD | 7.86e-58 | -1.24e+00 | 0.0155 |
| 57628 | DPP10 | HTA11_2487_2000001011 | Human | Colorectum | SER | 1.82e-21 | -9.88e-01 | -0.1808 |
| 57628 | DPP10 | HTA11_2951_2000001011 | Human | Colorectum | AD | 6.49e-05 | -8.38e-01 | 0.0216 |
| 57628 | DPP10 | HTA11_1938_2000001011 | Human | Colorectum | AD | 1.83e-18 | -1.05e+00 | -0.0811 |
| 57628 | DPP10 | HTA11_78_2000001011 | Human | Colorectum | AD | 2.47e-19 | -8.92e-01 | -0.1088 |
| 57628 | DPP10 | HTA11_411_2000001011 | Human | Colorectum | SER | 2.91e-02 | -1.95e-01 | -0.2602 |
| 57628 | DPP10 | HTA11_2112_2000001011 | Human | Colorectum | SER | 1.07e-03 | -9.04e-01 | -0.2196 |
| 57628 | DPP10 | HTA11_3361_2000001011 | Human | Colorectum | AD | 2.48e-23 | -9.98e-01 | -0.1207 |
| 57628 | DPP10 | HTA11_83_2000001011 | Human | Colorectum | SER | 2.35e-09 | -7.12e-01 | -0.1526 |
| 57628 | DPP10 | HTA11_696_2000001011 | Human | Colorectum | AD | 3.22e-22 | -7.95e-01 | -0.1464 |
| 57628 | DPP10 | HTA11_866_2000001011 | Human | Colorectum | AD | 1.23e-30 | -9.27e-01 | -0.1001 |
| 57628 | DPP10 | HTA11_1391_2000001011 | Human | Colorectum | AD | 5.77e-32 | -1.02e+00 | -0.059 |
| 57628 | DPP10 | HTA11_5212_2000001011 | Human | Colorectum | AD | 1.32e-09 | -9.46e-01 | -0.2061 |
| 57628 | DPP10 | HTA11_5216_2000001011 | Human | Colorectum | SER | 1.11e-08 | -7.43e-01 | -0.1462 |
| 57628 | DPP10 | HTA11_546_2000001011 | Human | Colorectum | AD | 1.44e-09 | -8.73e-01 | -0.0842 |
| 57628 | DPP10 | HTA11_866_3004761011 | Human | Colorectum | AD | 6.09e-52 | -1.24e+00 | 0.096 |
| 57628 | DPP10 | HTA11_9408_2000001011 | Human | Colorectum | AD | 3.78e-07 | -1.21e+00 | 0.0451 |
| 57628 | DPP10 | HTA11_8622_2000001021 | Human | Colorectum | SER | 6.14e-13 | -1.14e+00 | 0.0528 |
| 57628 | DPP10 | HTA11_10711_2000001011 | Human | Colorectum | AD | 9.57e-16 | -7.91e-01 | 0.0338 |
| 57628 | DPP10 | HTA11_7696_3000711011 | Human | Colorectum | AD | 3.85e-24 | -7.32e-01 | 0.0674 |
| Page: 1 2 3 4 |
| Tissue | Expression Dynamics | Abbreviation |
| Colorectum (GSE201348) |  | FAP: Familial adenomatous polyposis |
| CRC: Colorectal cancer | ||
| Colorectum (HTA11) | 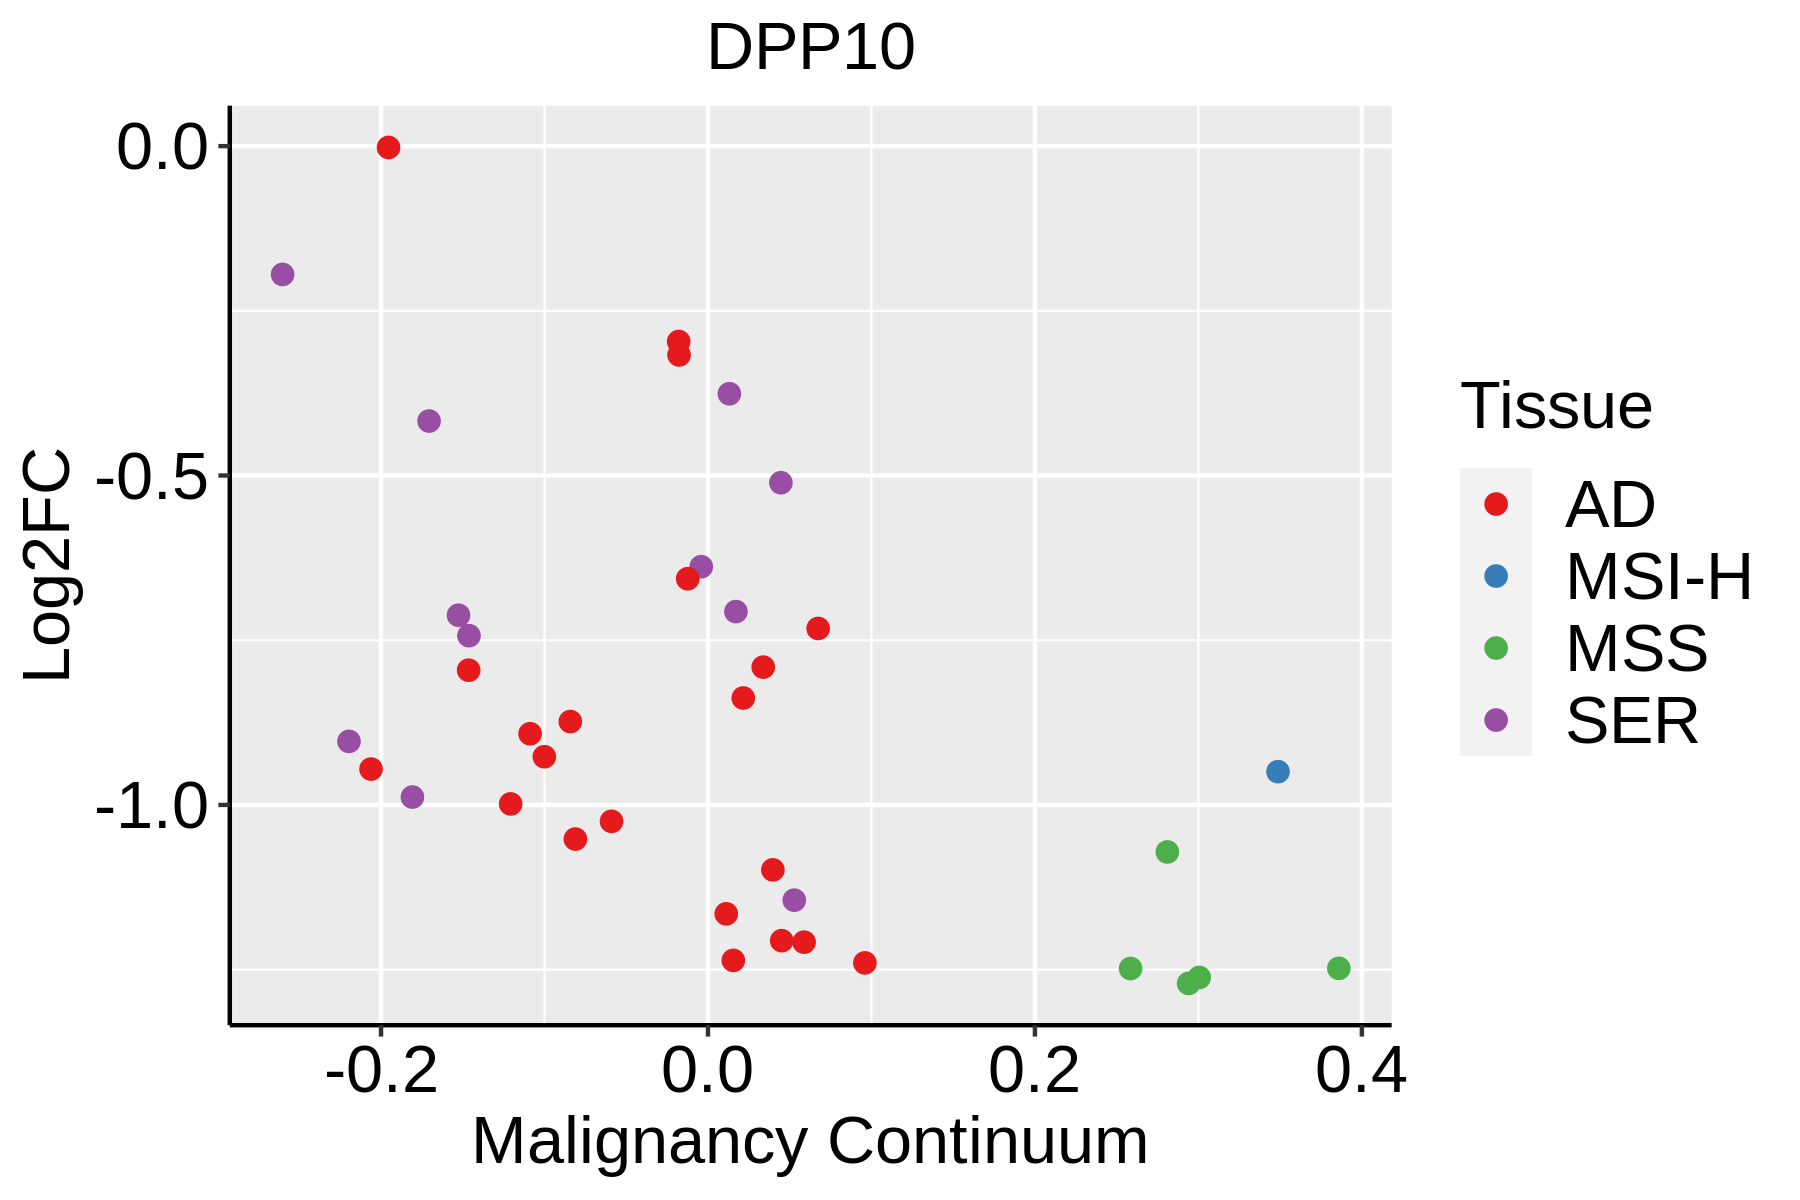 | AD: Adenomas |
| SER: Sessile serrated lesions | ||
| MSI-H: Microsatellite-high colorectal cancer | ||
| MSS: Microsatellite stable colorectal cancer | ||
| Endometrium |  | AEH: Atypical endometrial hyperplasia |
| EEC: Endometrioid Cancer |
| ∗log2FC in expression of this searched gene in stem-like cells from each diseased tissue sample relative to stem-like cells in normal samples in each tissue plotted against the malignancy continuum. Samples are colored based on if they are from different disease stage. |
Top |
Malignant transformation related pathway analysis |
| Find out the enriched GO biological processes and KEGG pathways involved in transition from healthy to precancer to cancer |
| Tissue | Disease Stage | Enriched GO biological Processes |
| Colorectum | AD |  |
| Colorectum | SER |  |
| Colorectum | MSS |  |
| Colorectum | MSI-H |  |
| Colorectum | FAP |  |
| ∗Top 15 enriched GO BP terms are showed in the bar plot of each disease state in each tissue. Each row represents a significant GO biological process which is colored according to the -log10(p.adjust). |
| Page: 1 2 3 4 5 6 7 8 9 |
| GO ID | Tissue | Disease Stage | Description | Gene Ratio | Bg Ratio | pvalue | p.adjust | Count |
| GO:0072659 | Colorectum | AD | protein localization to plasma membrane | 122/3918 | 284/18723 | 2.86e-17 | 1.49e-14 | 122 |
| GO:1990778 | Colorectum | AD | protein localization to cell periphery | 129/3918 | 333/18723 | 5.51e-14 | 1.15e-11 | 129 |
| GO:1903829 | Colorectum | AD | positive regulation of cellular protein localization | 110/3918 | 276/18723 | 4.58e-13 | 8.44e-11 | 110 |
| GO:1905475 | Colorectum | AD | regulation of protein localization to membrane | 73/3918 | 175/18723 | 3.37e-10 | 2.93e-08 | 73 |
| GO:1903076 | Colorectum | AD | regulation of protein localization to plasma membrane | 48/3918 | 104/18723 | 7.17e-09 | 4.36e-07 | 48 |
| GO:1904375 | Colorectum | AD | regulation of protein localization to cell periphery | 54/3918 | 125/18723 | 1.52e-08 | 9.00e-07 | 54 |
| GO:1905477 | Colorectum | AD | positive regulation of protein localization to membrane | 46/3918 | 106/18723 | 1.47e-07 | 6.64e-06 | 46 |
| GO:1903078 | Colorectum | AD | positive regulation of protein localization to plasma membrane | 28/3918 | 62/18723 | 1.57e-05 | 3.34e-04 | 28 |
| GO:1904377 | Colorectum | AD | positive regulation of protein localization to cell periphery | 30/3918 | 69/18723 | 1.98e-05 | 4.05e-04 | 30 |
| GO:00726591 | Colorectum | SER | protein localization to plasma membrane | 92/2897 | 284/18723 | 6.36e-13 | 1.86e-10 | 92 |
| GO:19038291 | Colorectum | SER | positive regulation of cellular protein localization | 86/2897 | 276/18723 | 3.61e-11 | 6.11e-09 | 86 |
| GO:19907781 | Colorectum | SER | protein localization to cell periphery | 98/2897 | 333/18723 | 6.09e-11 | 9.57e-09 | 98 |
| GO:19030761 | Colorectum | SER | regulation of protein localization to plasma membrane | 36/2897 | 104/18723 | 1.12e-06 | 5.18e-05 | 36 |
| GO:19054751 | Colorectum | SER | regulation of protein localization to membrane | 52/2897 | 175/18723 | 1.31e-06 | 6.04e-05 | 52 |
| GO:19043751 | Colorectum | SER | regulation of protein localization to cell periphery | 40/2897 | 125/18723 | 2.85e-06 | 1.16e-04 | 40 |
| GO:19054771 | Colorectum | SER | positive regulation of protein localization to membrane | 33/2897 | 106/18723 | 3.83e-05 | 9.82e-04 | 33 |
| GO:19030781 | Colorectum | SER | positive regulation of protein localization to plasma membrane | 22/2897 | 62/18723 | 8.58e-05 | 1.88e-03 | 22 |
| GO:19043771 | Colorectum | SER | positive regulation of protein localization to cell periphery | 23/2897 | 69/18723 | 1.78e-04 | 3.30e-03 | 23 |
| GO:00726592 | Colorectum | MSS | protein localization to plasma membrane | 113/3467 | 284/18723 | 3.23e-17 | 1.55e-14 | 113 |
| GO:19907782 | Colorectum | MSS | protein localization to cell periphery | 120/3467 | 333/18723 | 2.02e-14 | 5.47e-12 | 120 |
| Page: 1 2 3 4 |
| Pathway ID | Tissue | Disease Stage | Description | Gene Ratio | Bg Ratio | pvalue | p.adjust | qvalue | Count |
| Page: 1 |
Top |
Cell-cell communication analysis |
| Identification of potential cell-cell interactions between two cell types and their ligand-receptor pairs for different disease states |
| Ligand | Receptor | LRpair | Pathway | Tissue | Disease Stage |
| Page: 1 |
Top |
Single-cell gene regulatory network inference analysis |
| Find out the significant the regulons (TFs) and the target genes of each regulon across cell types for different disease states |
| TF | Cell Type | Tissue | Disease Stage | Target Gene | RSS | Regulon Activity |
| ∗The dot plots of a searched regulon are shown for all cell subpopulations in each disease state of each tissue based on the regulon specific score inferred using pySCENIC and by calculating the average expression. |
| Page: 1 |
Top |
Somatic mutation of malignant transformation related genes |
| Annotation of somatic variants for genes involved in malignant transformation |
| Hugo Symbol | Variant Class | Variant Classification | dbSNP RS | HGVSc | HGVSp | HGVSp Short | SWISSPROT | BIOTYPE | SIFT | PolyPhen | Tumor Sample Barcode | Tissue | Histology | Sex | Age | Stage | Therapy Types | Drugs | Outcome |
| DPP10 | SNV | Missense_Mutation | novel | c.1239N>C | p.Lys413Asn | p.K413N | Q8N608 | protein_coding | tolerated(1) | benign(0.012) | TCGA-AN-A046-01 | Breast | breast invasive carcinoma | Female | >=65 | I/II | Unknown | Unknown | SD |
| DPP10 | SNV | Missense_Mutation | c.2374N>G | p.Leu792Val | p.L792V | Q8N608 | protein_coding | tolerated(0.66) | benign(0.007) | TCGA-AN-A0AK-01 | Breast | breast invasive carcinoma | Female | >=65 | I/II | Unknown | Unknown | SD | |
| DPP10 | SNV | Missense_Mutation | c.1859N>T | p.His620Leu | p.H620L | Q8N608 | protein_coding | tolerated(0.38) | possibly_damaging(0.835) | TCGA-BH-A0BC-01 | Breast | breast invasive carcinoma | Female | <65 | III/IV | Chemotherapy | doxorubicin | SD | |
| DPP10 | SNV | Missense_Mutation | c.1120C>G | p.Gln374Glu | p.Q374E | Q8N608 | protein_coding | deleterious(0.02) | benign(0.13) | TCGA-E9-A1R4-01 | Breast | breast invasive carcinoma | Female | >=65 | I/II | Chemotherapy | 5-fluorouracil | SD | |
| DPP10 | SNV | Missense_Mutation | c.182N>G | p.Thr61Ser | p.T61S | Q8N608 | protein_coding | tolerated(0.34) | benign(0.076) | TCGA-E9-A1RF-01 | Breast | breast invasive carcinoma | Female | >=65 | III/IV | Hormone Therapy | tamoxiphen | SD | |
| DPP10 | SNV | Missense_Mutation | novel | c.1814G>A | p.Gly605Asp | p.G605D | Q8N608 | protein_coding | deleterious(0) | probably_damaging(0.999) | TCGA-LL-A6FP-01 | Breast | breast invasive carcinoma | Female | >=65 | I/II | Hormone Therapy | arimidex | SD |
| DPP10 | SNV | Missense_Mutation | novel | c.1345N>A | p.Ser449Thr | p.S449T | Q8N608 | protein_coding | tolerated(0.06) | benign(0) | TCGA-OL-A5D6-01 | Breast | breast invasive carcinoma | Female | >=65 | I/II | Unknown | Unknown | SD |
| DPP10 | SNV | Missense_Mutation | rs368074668 | c.1848G>T | p.Leu616Phe | p.L616F | Q8N608 | protein_coding | deleterious(0.01) | possibly_damaging(0.758) | TCGA-WT-AB41-01 | Breast | breast invasive carcinoma | Female | <65 | I/II | Chemotherapy | taxotere | CR |
| DPP10 | deletion | Frame_Shift_Del | novel | c.1743delN | p.Asp582IlefsTer19 | p.D582Ifs*19 | Q8N608 | protein_coding | TCGA-EW-A2FV-01 | Breast | breast invasive carcinoma | Female | <65 | III/IV | Chemotherapy | docetaxel | SD | ||
| DPP10 | SNV | Missense_Mutation | c.2011N>T | p.Leu671Phe | p.L671F | Q8N608 | protein_coding | tolerated(0.11) | benign(0.026) | TCGA-EK-A2PM-01 | Cervix | cervical & endocervical cancer | Female | >=65 | I/II | Unknown | Unknown | SD |
| Page: 1 2 3 4 5 6 7 8 9 10 11 12 13 14 15 16 17 18 19 20 21 |
Top |
Related drugs of malignant transformation related genes |
| Identification of chemicals and drugs interact with genes involved in malignant transfromation |
| (DGIdb 4.0) |
| Entrez ID | Symbol | Category | Interaction Types | Drug Claim Name | Drug Name | PMIDs |
| Page: 1 |

Copyright 2023-Present -The University of Texas Health Science Center at Houston |