
|
|||||
|
 | |
| |
| |
| |
| |
| |
|
Gene: DPM3 |
Gene summary for DPM3 |
| Gene information | Species | Human | Gene symbol | DPM3 | Gene ID | 54344 |
| Gene name | dolichyl-phosphate mannosyltransferase subunit 3, regulatory | |
| Gene Alias | CDG1O | |
| Cytomap | 1q22 | |
| Gene Type | protein-coding | GO ID | GO:0005975 | UniProtAcc | A0A140VJI4 |
Top |
Malignant transformation analysis |
| Identification of the aberrant gene expression in precancerous and cancerous lesions by comparing the gene expression of stem-like cells in diseased tissues with normal stem cells |
| Entrez ID | Symbol | Replicates | Species | Organ | Tissue | Adj P-value | Log2FC | Malignancy |
| 54344 | DPM3 | HTA11_3410_2000001011 | Human | Colorectum | AD | 3.78e-05 | 1.78e-01 | 0.0155 |
| 54344 | DPM3 | HTA11_2487_2000001011 | Human | Colorectum | SER | 1.01e-12 | 4.12e-01 | -0.1808 |
| 54344 | DPM3 | HTA11_1938_2000001011 | Human | Colorectum | AD | 3.44e-09 | 3.31e-01 | -0.0811 |
| 54344 | DPM3 | HTA11_347_2000001011 | Human | Colorectum | AD | 5.56e-18 | 3.79e-01 | -0.1954 |
| 54344 | DPM3 | HTA11_411_2000001011 | Human | Colorectum | SER | 5.02e-12 | 8.07e-01 | -0.2602 |
| 54344 | DPM3 | HTA11_2112_2000001011 | Human | Colorectum | SER | 2.41e-08 | 7.98e-01 | -0.2196 |
| 54344 | DPM3 | HTA11_3361_2000001011 | Human | Colorectum | AD | 6.90e-09 | 3.39e-01 | -0.1207 |
| 54344 | DPM3 | HTA11_696_2000001011 | Human | Colorectum | AD | 8.28e-25 | 6.32e-01 | -0.1464 |
| 54344 | DPM3 | HTA11_866_2000001011 | Human | Colorectum | AD | 2.10e-08 | 2.84e-01 | -0.1001 |
| 54344 | DPM3 | HTA11_1391_2000001011 | Human | Colorectum | AD | 5.66e-15 | 4.58e-01 | -0.059 |
| 54344 | DPM3 | HTA11_2992_2000001011 | Human | Colorectum | SER | 1.54e-03 | 3.13e-01 | -0.1706 |
| 54344 | DPM3 | HTA11_5212_2000001011 | Human | Colorectum | AD | 9.62e-05 | 3.82e-01 | -0.2061 |
| 54344 | DPM3 | HTA11_5216_2000001011 | Human | Colorectum | SER | 2.52e-06 | 4.70e-01 | -0.1462 |
| 54344 | DPM3 | HTA11_546_2000001011 | Human | Colorectum | AD | 1.53e-11 | 5.10e-01 | -0.0842 |
| 54344 | DPM3 | HTA11_7862_2000001011 | Human | Colorectum | AD | 1.54e-07 | 3.84e-01 | -0.0179 |
| 54344 | DPM3 | HTA11_866_3004761011 | Human | Colorectum | AD | 4.45e-08 | 2.57e-01 | 0.096 |
| 54344 | DPM3 | HTA11_4255_2000001011 | Human | Colorectum | SER | 2.01e-07 | 5.65e-01 | 0.0446 |
| 54344 | DPM3 | HTA11_8622_2000001021 | Human | Colorectum | SER | 1.43e-03 | 2.67e-01 | 0.0528 |
| 54344 | DPM3 | HTA11_7663_2000001011 | Human | Colorectum | SER | 9.49e-07 | 5.01e-01 | 0.0131 |
| 54344 | DPM3 | HTA11_10623_2000001011 | Human | Colorectum | AD | 2.01e-05 | 2.97e-01 | -0.0177 |
| Page: 1 2 3 4 5 6 7 8 9 |
| Tissue | Expression Dynamics | Abbreviation |
| Colorectum (GSE201348) |  | FAP: Familial adenomatous polyposis |
| CRC: Colorectal cancer | ||
| Colorectum (HTA11) |  | AD: Adenomas |
| SER: Sessile serrated lesions | ||
| MSI-H: Microsatellite-high colorectal cancer | ||
| MSS: Microsatellite stable colorectal cancer | ||
| Endometrium | 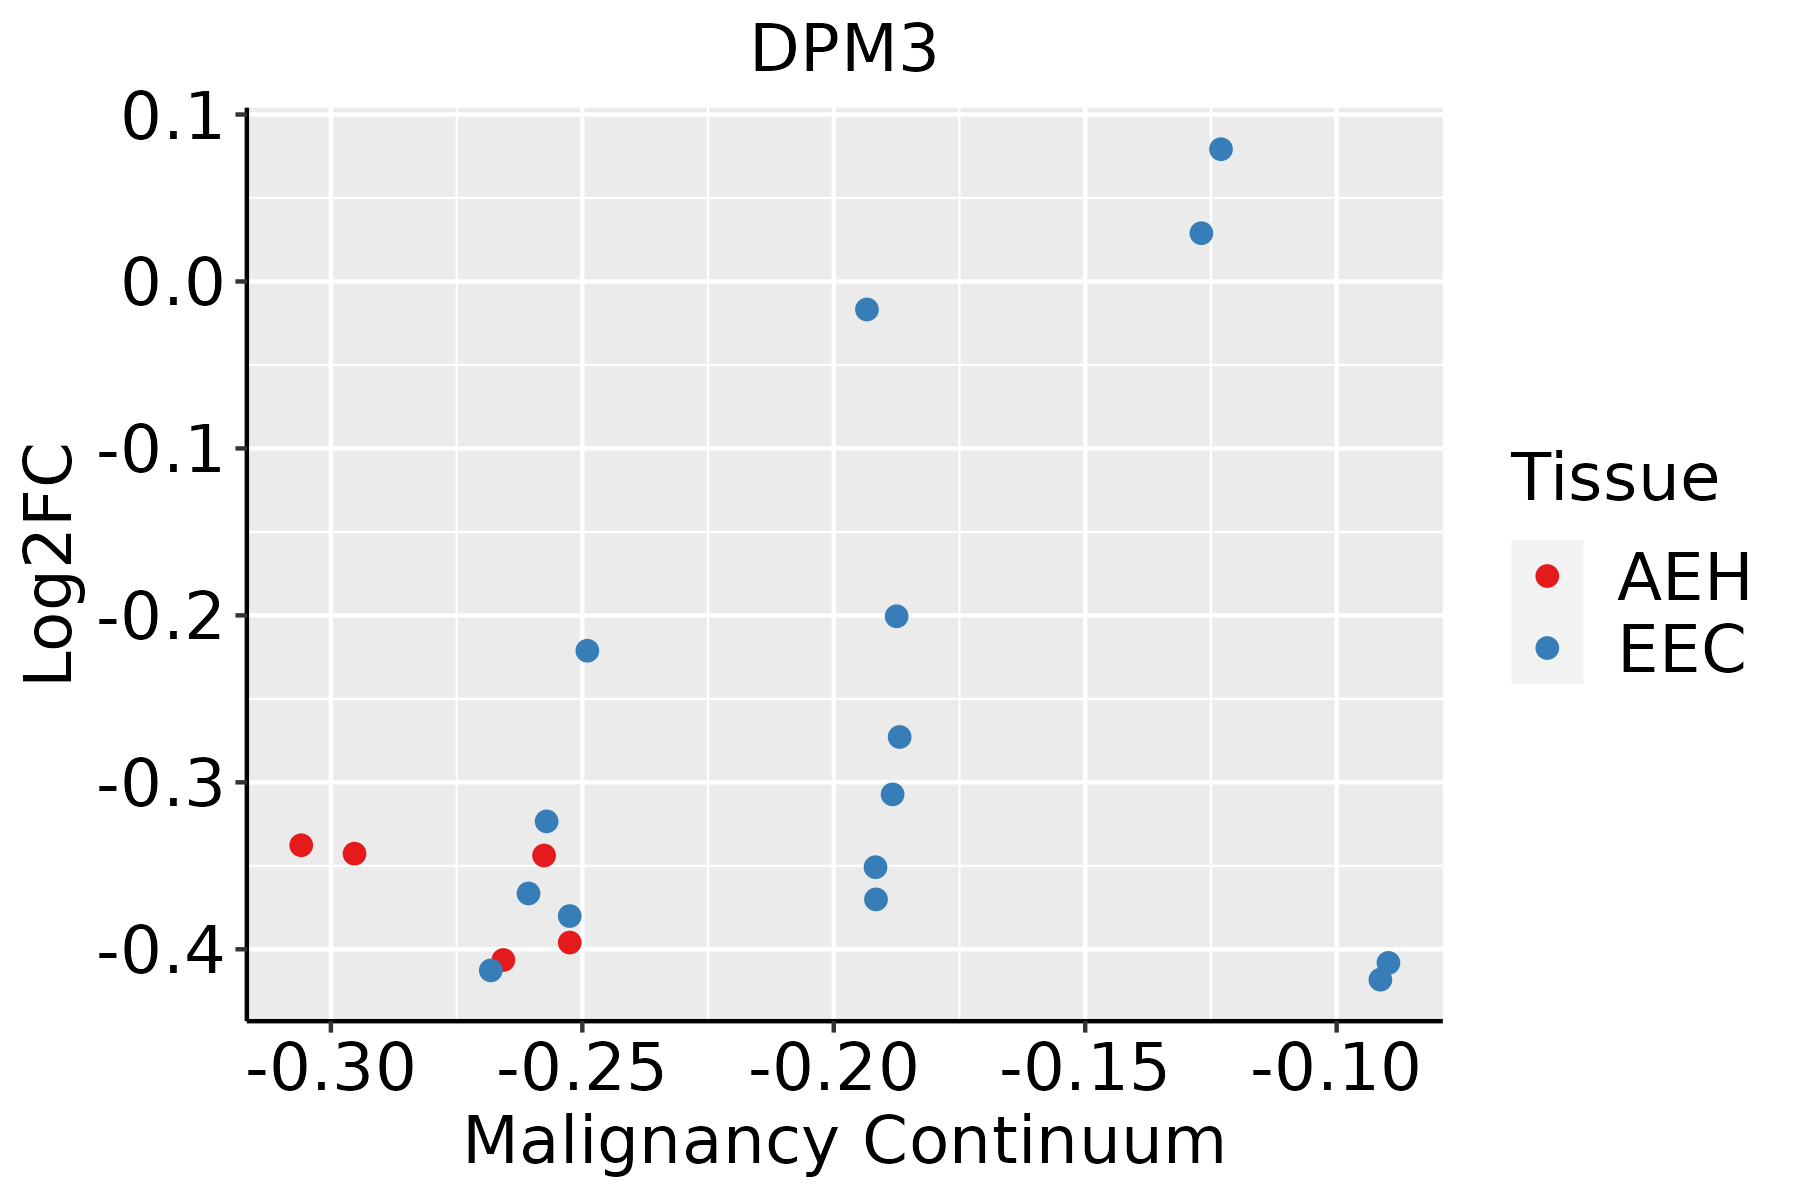 | AEH: Atypical endometrial hyperplasia |
| EEC: Endometrioid Cancer | ||
| Esophagus | 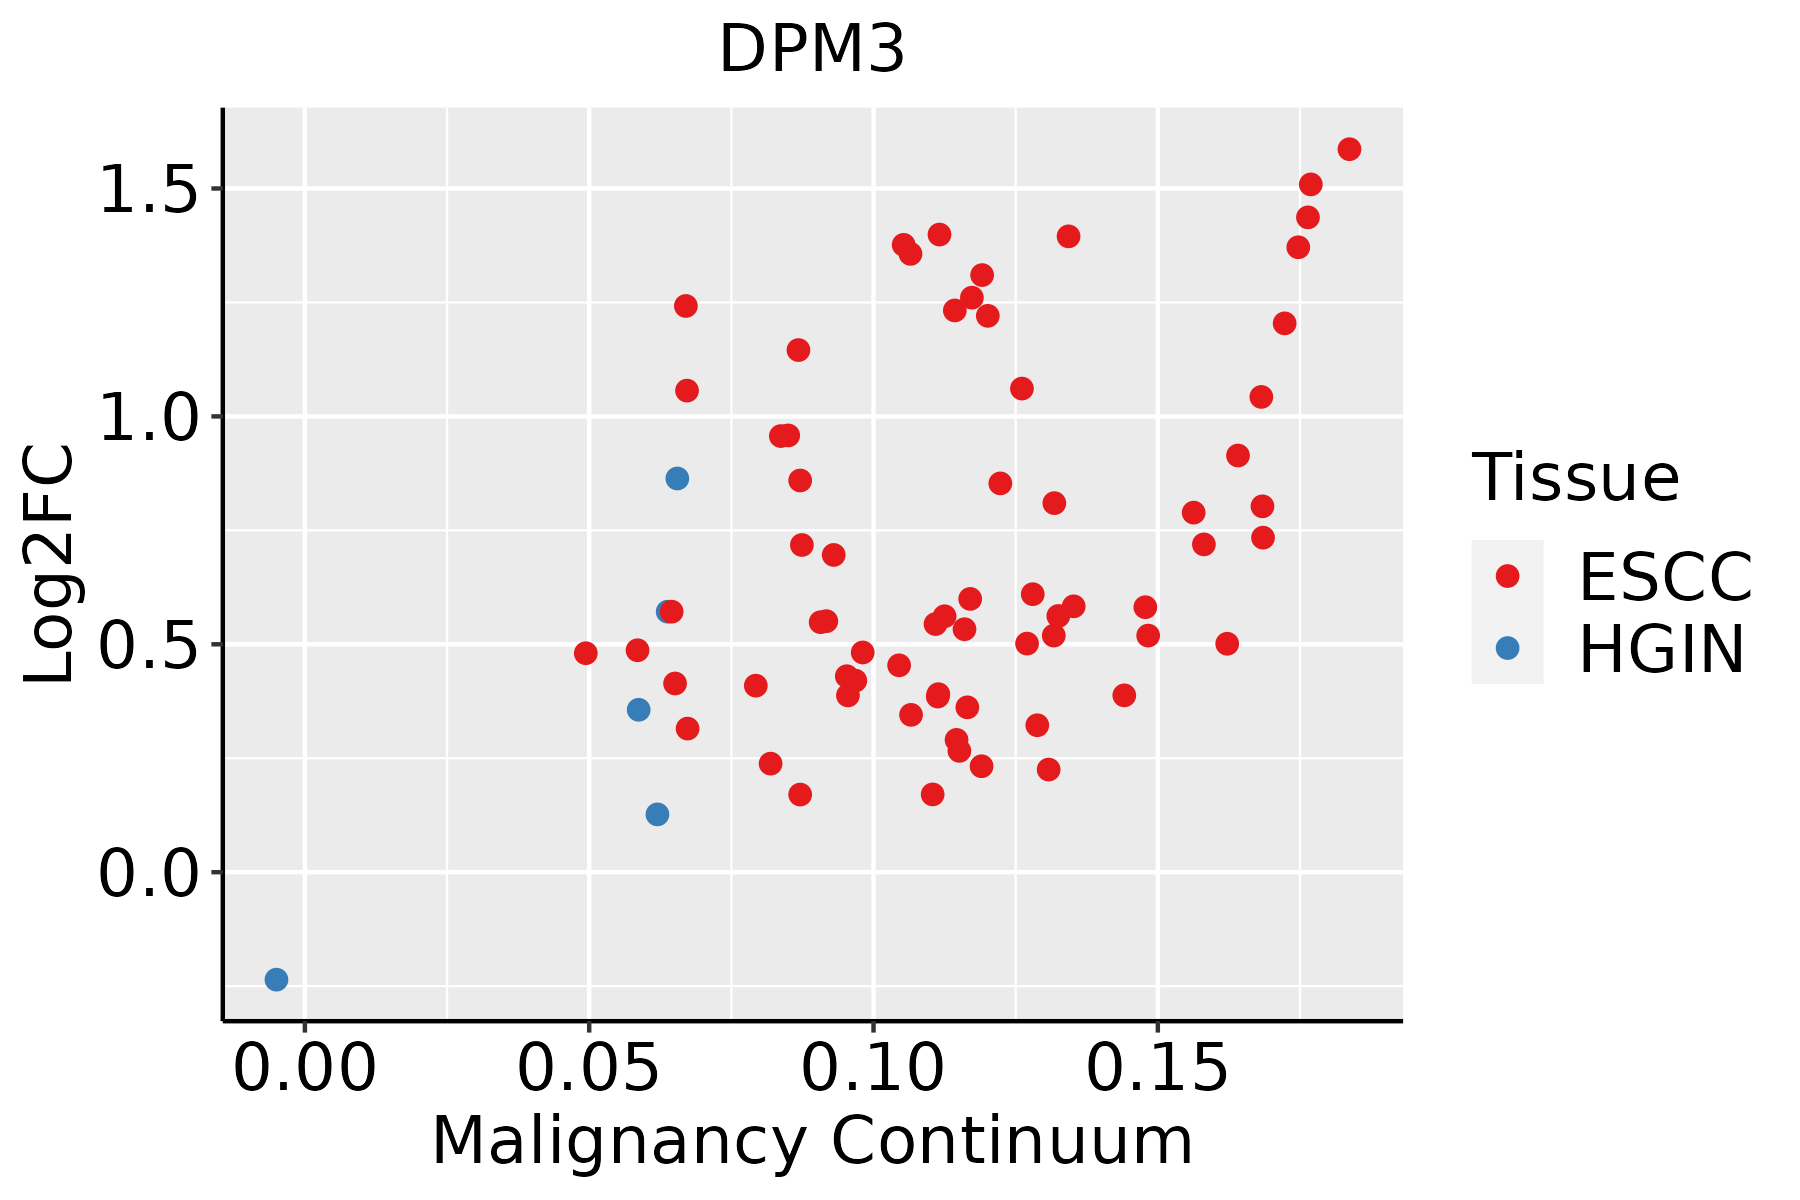 | ESCC: Esophageal squamous cell carcinoma |
| HGIN: High-grade intraepithelial neoplasias | ||
| LGIN: Low-grade intraepithelial neoplasias | ||
| Liver |  | HCC: Hepatocellular carcinoma |
| NAFLD: Non-alcoholic fatty liver disease | ||
| Oral Cavity |  | EOLP: Erosive Oral lichen planus |
| LP: leukoplakia | ||
| NEOLP: Non-erosive oral lichen planus | ||
| OSCC: Oral squamous cell carcinoma | ||
| Prostate | 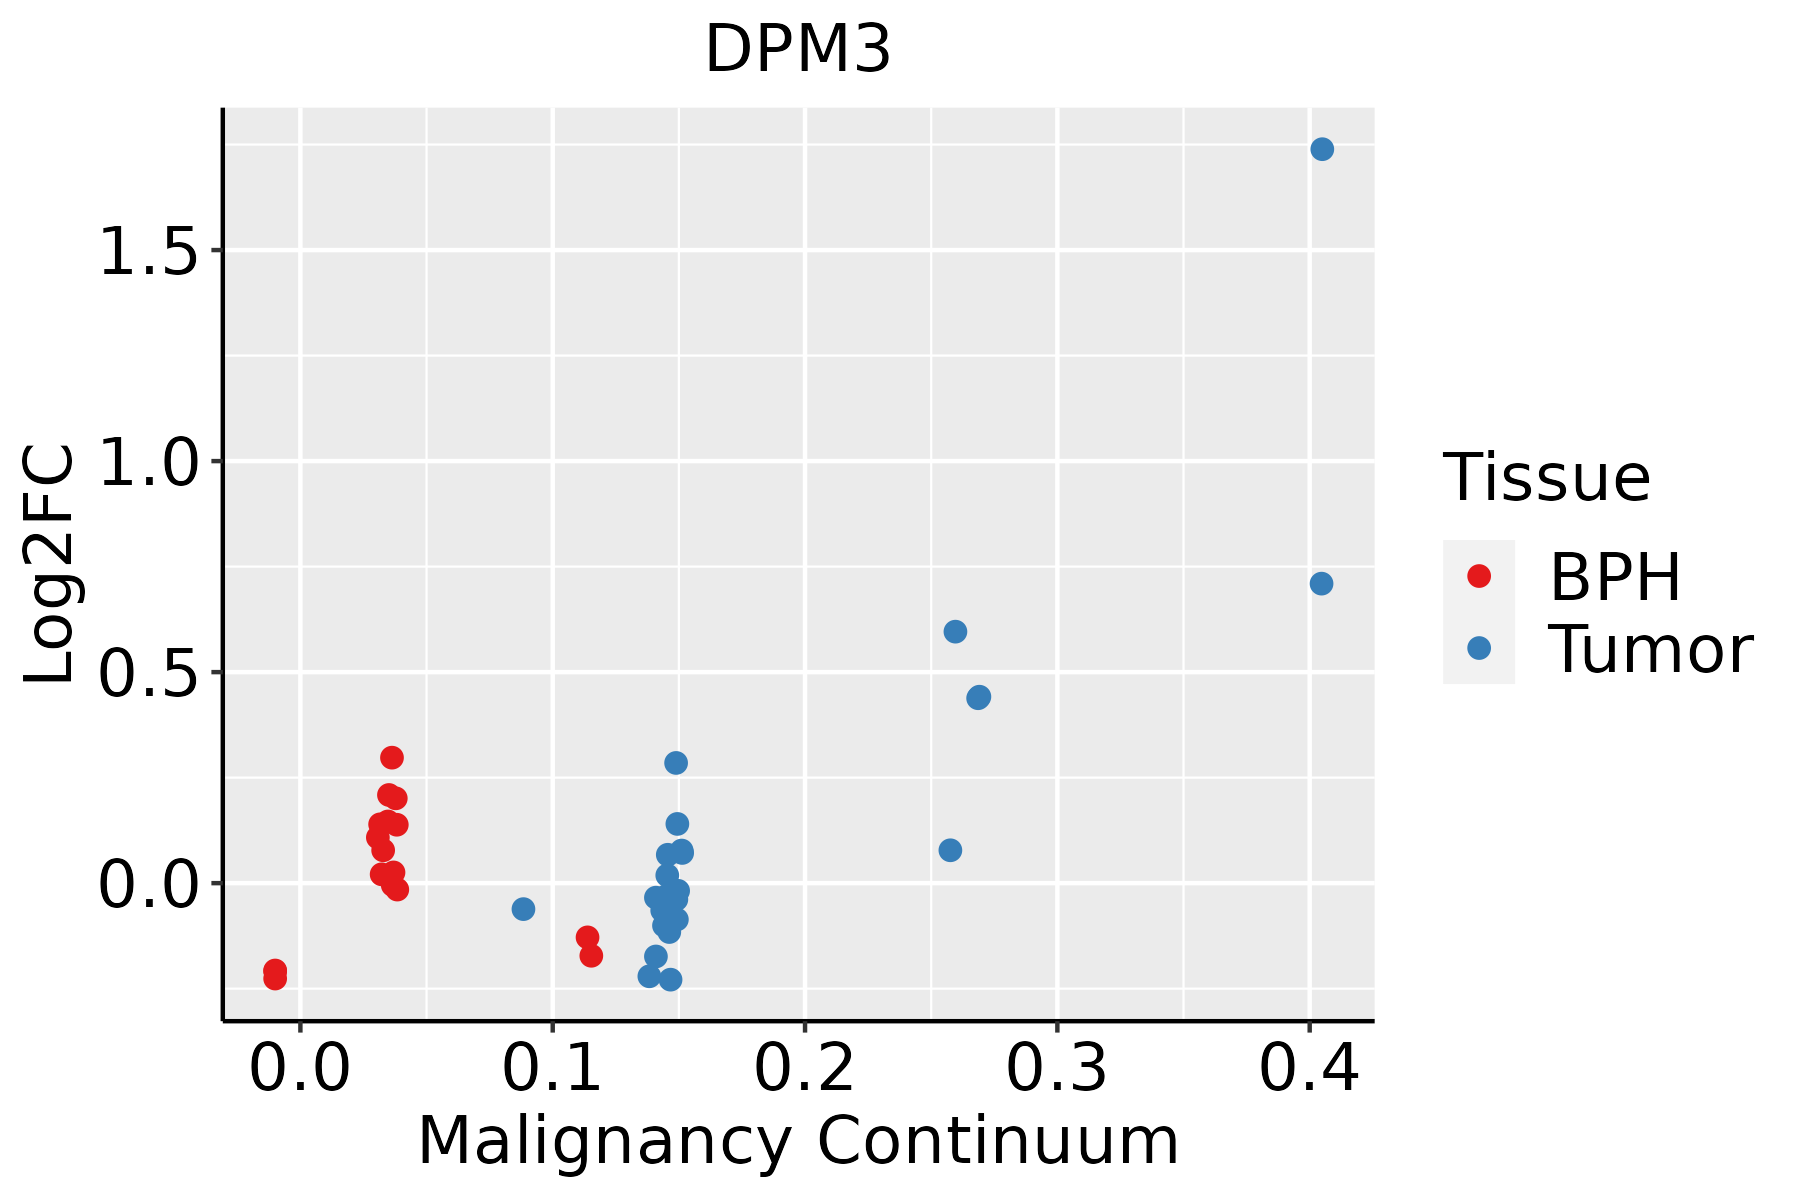 | BPH: Benign Prostatic Hyperplasia |
| Skin |  | AK: Actinic keratosis |
| cSCC: Cutaneous squamous cell carcinoma | ||
| SCCIS:squamous cell carcinoma in situ | ||
| Thyroid | 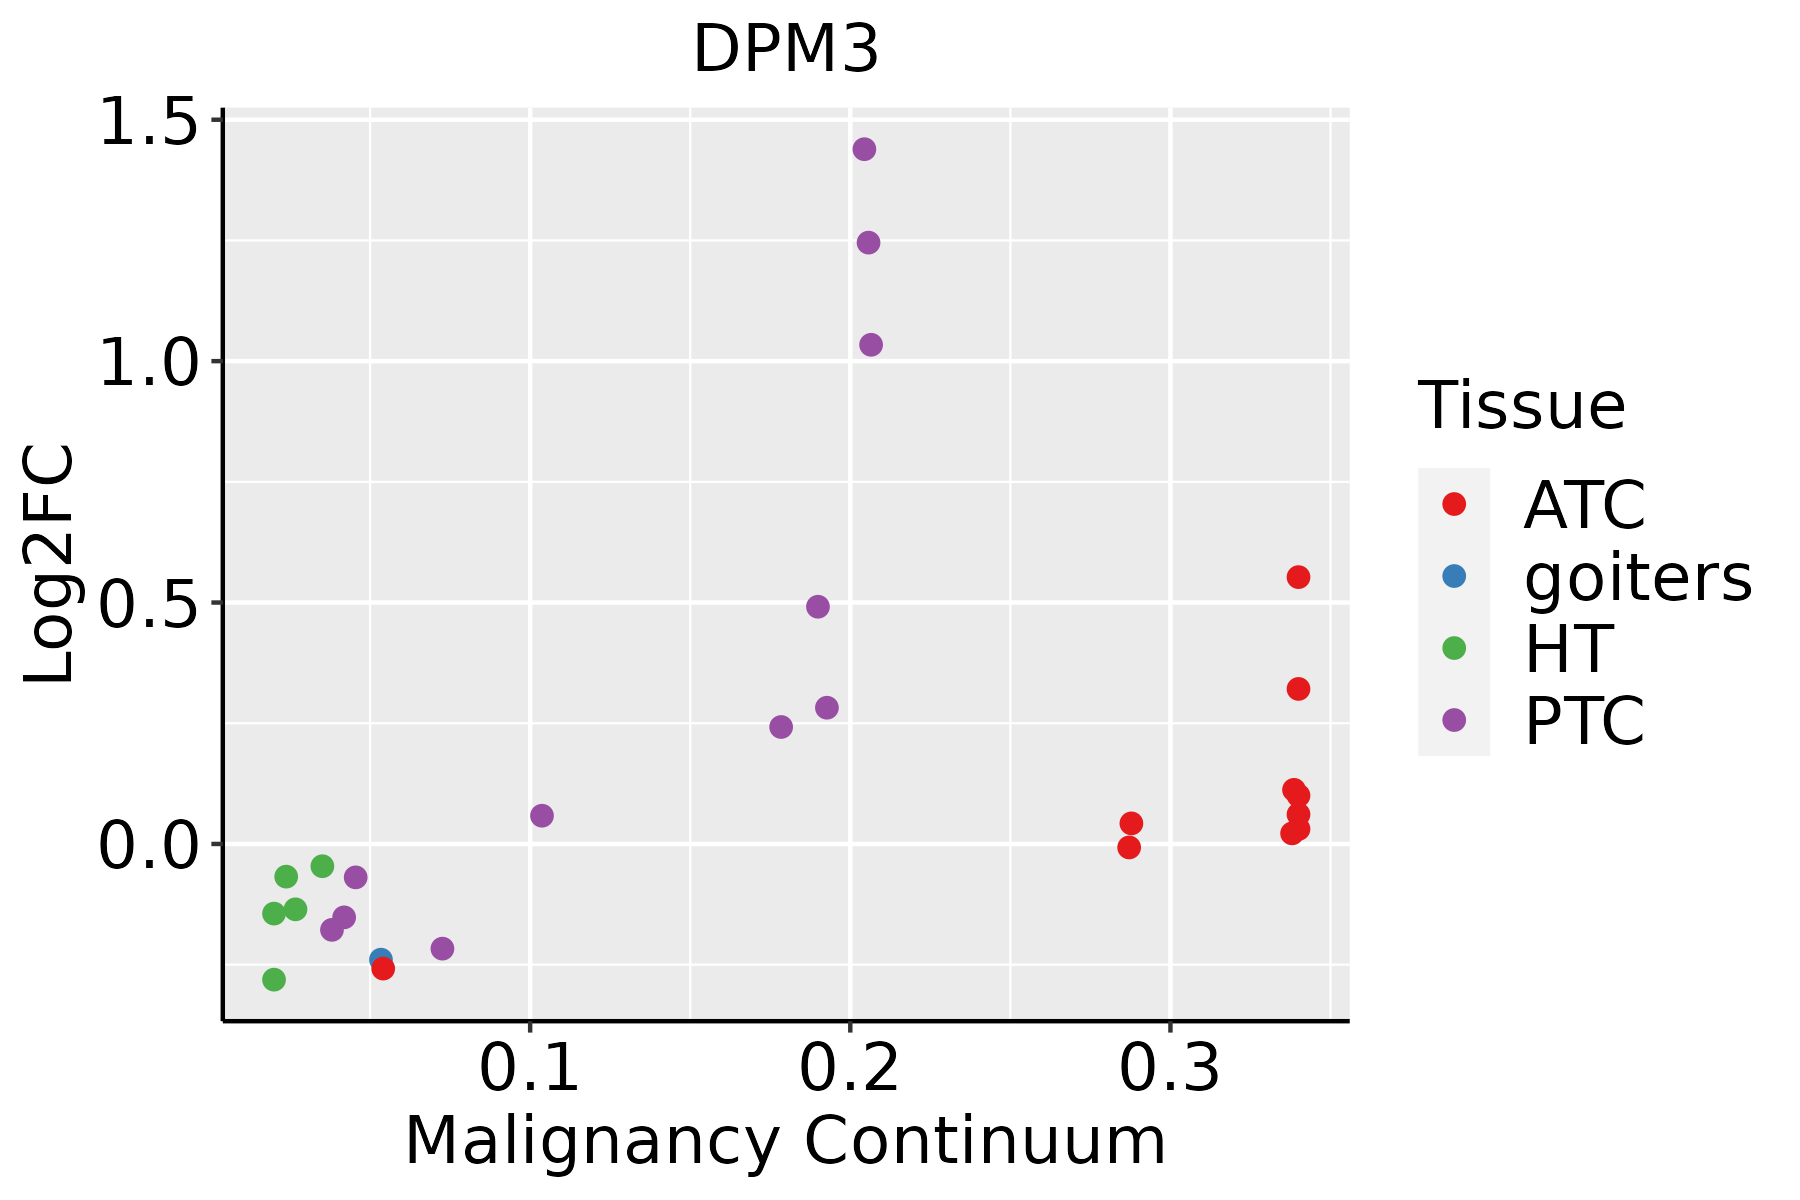 | ATC: Anaplastic thyroid cancer |
| HT: Hashimoto's thyroiditis | ||
| PTC: Papillary thyroid cancer |
| ∗log2FC in expression of this searched gene in stem-like cells from each diseased tissue sample relative to stem-like cells in normal samples in each tissue plotted against the malignancy continuum. Samples are colored based on if they are from different disease stage. |
Top |
Malignant transformation related pathway analysis |
| Find out the enriched GO biological processes and KEGG pathways involved in transition from healthy to precancer to cancer |
| Tissue | Disease Stage | Enriched GO biological Processes |
| Colorectum | AD |  |
| Colorectum | SER |  |
| Colorectum | MSS |  |
| Colorectum | MSI-H |  |
| Colorectum | FAP |  |
| ∗Top 15 enriched GO BP terms are showed in the bar plot of each disease state in each tissue. Each row represents a significant GO biological process which is colored according to the -log10(p.adjust). |
| Page: 1 2 3 4 5 6 7 8 9 |
| GO ID | Tissue | Disease Stage | Description | Gene Ratio | Bg Ratio | pvalue | p.adjust | Count |
| GO:0031647 | Colorectum | AD | regulation of protein stability | 108/3918 | 298/18723 | 6.33e-10 | 5.08e-08 | 108 |
| GO:0006486 | Colorectum | AD | protein glycosylation | 64/3918 | 226/18723 | 4.86e-03 | 3.27e-02 | 64 |
| GO:0043413 | Colorectum | AD | macromolecule glycosylation | 64/3918 | 226/18723 | 4.86e-03 | 3.27e-02 | 64 |
| GO:0006650 | Colorectum | AD | glycerophospholipid metabolic process | 83/3918 | 306/18723 | 5.40e-03 | 3.55e-02 | 83 |
| GO:0070085 | Colorectum | AD | glycosylation | 67/3918 | 240/18723 | 5.78e-03 | 3.67e-02 | 67 |
| GO:0006644 | Colorectum | AD | phospholipid metabolic process | 101/3918 | 383/18723 | 5.80e-03 | 3.67e-02 | 101 |
| GO:0045017 | Colorectum | AD | glycerolipid biosynthetic process | 69/3918 | 252/18723 | 8.33e-03 | 4.88e-02 | 69 |
| GO:00316471 | Colorectum | SER | regulation of protein stability | 86/2897 | 298/18723 | 2.56e-09 | 2.42e-07 | 86 |
| GO:0046486 | Colorectum | SER | glycerolipid metabolic process | 82/2897 | 392/18723 | 2.26e-03 | 2.17e-02 | 82 |
| GO:00066441 | Colorectum | SER | phospholipid metabolic process | 79/2897 | 383/18723 | 3.94e-03 | 3.24e-02 | 79 |
| GO:00450171 | Colorectum | SER | glycerolipid biosynthetic process | 55/2897 | 252/18723 | 4.47e-03 | 3.56e-02 | 55 |
| GO:00066501 | Colorectum | SER | glycerophospholipid metabolic process | 64/2897 | 306/18723 | 6.41e-03 | 4.60e-02 | 64 |
| GO:00316472 | Colorectum | MSS | regulation of protein stability | 103/3467 | 298/18723 | 2.52e-11 | 3.49e-09 | 103 |
| GO:003164716 | Endometrium | AEH | regulation of protein stability | 77/2100 | 298/18723 | 1.13e-12 | 2.26e-10 | 77 |
| GO:003164717 | Endometrium | EEC | regulation of protein stability | 80/2168 | 298/18723 | 2.48e-13 | 5.96e-11 | 80 |
| GO:003164727 | Esophagus | HGIN | regulation of protein stability | 96/2587 | 298/18723 | 2.21e-16 | 5.76e-14 | 96 |
| GO:0031647111 | Esophagus | ESCC | regulation of protein stability | 223/8552 | 298/18723 | 5.76e-25 | 1.52e-22 | 223 |
| GO:00086544 | Esophagus | ESCC | phospholipid biosynthetic process | 162/8552 | 253/18723 | 2.59e-09 | 5.73e-08 | 162 |
| GO:00464744 | Esophagus | ESCC | glycerophospholipid biosynthetic process | 135/8552 | 211/18723 | 5.75e-08 | 1.02e-06 | 135 |
| GO:00066433 | Esophagus | ESCC | membrane lipid metabolic process | 130/8552 | 203/18723 | 9.29e-08 | 1.54e-06 | 130 |
| Page: 1 2 3 4 5 6 |
| Pathway ID | Tissue | Disease Stage | Description | Gene Ratio | Bg Ratio | pvalue | p.adjust | qvalue | Count |
| hsa00510 | Colorectum | AD | N-Glycan biosynthesis | 21/2092 | 53/8465 | 1.15e-02 | 4.24e-02 | 2.71e-02 | 21 |
| hsa005101 | Colorectum | AD | N-Glycan biosynthesis | 21/2092 | 53/8465 | 1.15e-02 | 4.24e-02 | 2.71e-02 | 21 |
| hsa005102 | Colorectum | MSS | N-Glycan biosynthesis | 20/1875 | 53/8465 | 7.17e-03 | 2.83e-02 | 1.73e-02 | 20 |
| hsa005103 | Colorectum | MSS | N-Glycan biosynthesis | 20/1875 | 53/8465 | 7.17e-03 | 2.83e-02 | 1.73e-02 | 20 |
| hsa005106 | Esophagus | HGIN | N-Glycan biosynthesis | 17/1383 | 53/8465 | 3.43e-03 | 2.54e-02 | 2.02e-02 | 17 |
| hsa0051013 | Esophagus | HGIN | N-Glycan biosynthesis | 17/1383 | 53/8465 | 3.43e-03 | 2.54e-02 | 2.02e-02 | 17 |
| hsa0051023 | Esophagus | ESCC | N-Glycan biosynthesis | 39/4205 | 53/8465 | 3.26e-04 | 1.15e-03 | 5.89e-04 | 39 |
| hsa0051033 | Esophagus | ESCC | N-Glycan biosynthesis | 39/4205 | 53/8465 | 3.26e-04 | 1.15e-03 | 5.89e-04 | 39 |
| hsa005104 | Liver | Cirrhotic | N-Glycan biosynthesis | 32/2530 | 53/8465 | 3.82e-06 | 4.10e-05 | 2.53e-05 | 32 |
| hsa0051011 | Liver | Cirrhotic | N-Glycan biosynthesis | 32/2530 | 53/8465 | 3.82e-06 | 4.10e-05 | 2.53e-05 | 32 |
| hsa0051021 | Liver | HCC | N-Glycan biosynthesis | 40/4020 | 53/8465 | 2.95e-05 | 1.87e-04 | 1.04e-04 | 40 |
| hsa0051031 | Liver | HCC | N-Glycan biosynthesis | 40/4020 | 53/8465 | 2.95e-05 | 1.87e-04 | 1.04e-04 | 40 |
| hsa005105 | Oral cavity | OSCC | N-Glycan biosynthesis | 39/3704 | 53/8465 | 9.77e-06 | 4.36e-05 | 2.22e-05 | 39 |
| hsa0051012 | Oral cavity | OSCC | N-Glycan biosynthesis | 39/3704 | 53/8465 | 9.77e-06 | 4.36e-05 | 2.22e-05 | 39 |
| hsa0051022 | Oral cavity | LP | N-Glycan biosynthesis | 31/2418 | 53/8465 | 4.86e-06 | 4.14e-05 | 2.67e-05 | 31 |
| hsa0051032 | Oral cavity | LP | N-Glycan biosynthesis | 31/2418 | 53/8465 | 4.86e-06 | 4.14e-05 | 2.67e-05 | 31 |
| Page: 1 |
Top |
Cell-cell communication analysis |
| Identification of potential cell-cell interactions between two cell types and their ligand-receptor pairs for different disease states |
| Ligand | Receptor | LRpair | Pathway | Tissue | Disease Stage |
| Page: 1 |
Top |
Single-cell gene regulatory network inference analysis |
| Find out the significant the regulons (TFs) and the target genes of each regulon across cell types for different disease states |
| TF | Cell Type | Tissue | Disease Stage | Target Gene | RSS | Regulon Activity |
| ∗The dot plots of a searched regulon are shown for all cell subpopulations in each disease state of each tissue based on the regulon specific score inferred using pySCENIC and by calculating the average expression. |
| Page: 1 |
Top |
Somatic mutation of malignant transformation related genes |
| Annotation of somatic variants for genes involved in malignant transformation |
| Hugo Symbol | Variant Class | Variant Classification | dbSNP RS | HGVSc | HGVSp | HGVSp Short | SWISSPROT | BIOTYPE | SIFT | PolyPhen | Tumor Sample Barcode | Tissue | Histology | Sex | Age | Stage | Therapy Types | Drugs | Outcome |
| DPM3 | SNV | Missense_Mutation | c.79N>G | p.Leu27Val | p.L27V | Q9P2X0 | protein_coding | deleterious_low_confidence(0) | benign(0.073) | TCGA-AC-A5XS-01 | Breast | breast invasive carcinoma | Female | >=65 | I/II | Hormone Therapy | femara | SD | |
| DPM3 | SNV | Missense_Mutation | novel | c.155N>A | p.Thr52Asn | p.T52N | Q9P2X0 | protein_coding | tolerated(0.31) | benign(0.012) | TCGA-GM-A2D9-01 | Breast | breast invasive carcinoma | Female | >=65 | I/II | Hormone Therapy | arimidex | SD |
| DPM3 | SNV | Missense_Mutation | novel | c.136N>C | p.Ser46Pro | p.S46P | Q9P2X0 | protein_coding | deleterious(0.03) | benign(0.005) | TCGA-B5-A0JR-01 | Endometrium | uterine corpus endometrioid carcinoma | Female | >=65 | I/II | Unknown | Unknown | SD |
| DPM3 | SNV | Missense_Mutation | novel | c.350G>A | p.Arg117His | p.R117H | Q9P2X0 | protein_coding | tolerated(0.43) | benign(0.046) | TCGA-D1-A1NZ-01 | Endometrium | uterine corpus endometrioid carcinoma | Female | <65 | I/II | Unknown | Unknown | SD |
| DPM3 | SNV | Missense_Mutation | novel | c.260N>C | p.Val87Ala | p.V87A | Q9P2X0 | protein_coding | deleterious(0) | possibly_damaging(0.893) | TCGA-EO-A22U-01 | Endometrium | uterine corpus endometrioid carcinoma | Female | >=65 | I/II | Unknown | Unknown | SD |
| DPM3 | SNV | Missense_Mutation | novel | c.248N>A | p.Ala83Asp | p.A83D | Q9P2X0 | protein_coding | deleterious(0) | benign(0.372) | TCGA-EO-A3AV-01 | Endometrium | uterine corpus endometrioid carcinoma | Female | <65 | III/IV | Chemotherapy | carboplatin | CR |
| DPM3 | SNV | Missense_Mutation | c.168N>C | p.Leu56Phe | p.L56F | Q9P2X0 | protein_coding | tolerated(0.08) | probably_damaging(0.999) | TCGA-55-A490-01 | Lung | lung adenocarcinoma | Male | >=65 | I/II | Chemotherapy | carboplatin | SD |
| Page: 1 |
Top |
Related drugs of malignant transformation related genes |
| Identification of chemicals and drugs interact with genes involved in malignant transfromation |
| (DGIdb 4.0) |
| Entrez ID | Symbol | Category | Interaction Types | Drug Claim Name | Drug Name | PMIDs |
| Page: 1 |

Copyright 2023-Present -The University of Texas Health Science Center at Houston |