
|
|||||
|
 | |
| |
| |
| |
| |
| |
|
Gene: DPM1 |
Gene summary for DPM1 |
| Gene information | Species | Human | Gene symbol | DPM1 | Gene ID | 8813 |
| Gene name | dolichyl-phosphate mannosyltransferase subunit 1, catalytic | |
| Gene Alias | CDGIE | |
| Cytomap | 20q13.13 | |
| Gene Type | protein-coding | GO ID | GO:0006066 | UniProtAcc | O60762 |
Top |
Malignant transformation analysis |
| Identification of the aberrant gene expression in precancerous and cancerous lesions by comparing the gene expression of stem-like cells in diseased tissues with normal stem cells |
| Entrez ID | Symbol | Replicates | Species | Organ | Tissue | Adj P-value | Log2FC | Malignancy |
| 8813 | DPM1 | LZE4T | Human | Esophagus | ESCC | 1.55e-04 | 1.75e-01 | 0.0811 |
| 8813 | DPM1 | LZE5T | Human | Esophagus | ESCC | 1.63e-05 | 5.95e-02 | 0.0514 |
| 8813 | DPM1 | LZE7T | Human | Esophagus | ESCC | 7.73e-06 | 3.43e-01 | 0.0667 |
| 8813 | DPM1 | LZE8T | Human | Esophagus | ESCC | 9.95e-11 | -4.89e-02 | 0.067 |
| 8813 | DPM1 | LZE21D1 | Human | Esophagus | HGIN | 1.74e-02 | -1.27e-01 | 0.0632 |
| 8813 | DPM1 | LZE22T | Human | Esophagus | ESCC | 1.19e-04 | 3.35e-02 | 0.068 |
| 8813 | DPM1 | LZE24T | Human | Esophagus | ESCC | 1.10e-14 | 1.40e-01 | 0.0596 |
| 8813 | DPM1 | LZE6T | Human | Esophagus | ESCC | 3.09e-05 | 9.56e-02 | 0.0845 |
| 8813 | DPM1 | P1T-E | Human | Esophagus | ESCC | 4.86e-04 | 3.14e-01 | 0.0875 |
| 8813 | DPM1 | P2T-E | Human | Esophagus | ESCC | 1.97e-21 | 1.83e-01 | 0.1177 |
| 8813 | DPM1 | P4T-E | Human | Esophagus | ESCC | 6.94e-21 | 6.85e-01 | 0.1323 |
| 8813 | DPM1 | P5T-E | Human | Esophagus | ESCC | 5.40e-22 | 4.16e-01 | 0.1327 |
| 8813 | DPM1 | P8T-E | Human | Esophagus | ESCC | 4.07e-25 | 3.98e-01 | 0.0889 |
| 8813 | DPM1 | P9T-E | Human | Esophagus | ESCC | 6.17e-09 | 1.97e-01 | 0.1131 |
| 8813 | DPM1 | P10T-E | Human | Esophagus | ESCC | 2.22e-22 | 4.54e-01 | 0.116 |
| 8813 | DPM1 | P11T-E | Human | Esophagus | ESCC | 2.40e-07 | 6.27e-01 | 0.1426 |
| 8813 | DPM1 | P12T-E | Human | Esophagus | ESCC | 1.89e-20 | 3.92e-01 | 0.1122 |
| 8813 | DPM1 | P15T-E | Human | Esophagus | ESCC | 3.15e-18 | 2.32e-01 | 0.1149 |
| 8813 | DPM1 | P16T-E | Human | Esophagus | ESCC | 7.29e-26 | 5.32e-01 | 0.1153 |
| 8813 | DPM1 | P17T-E | Human | Esophagus | ESCC | 7.61e-13 | 1.66e-01 | 0.1278 |
| Page: 1 2 3 4 5 6 7 |
| Tissue | Expression Dynamics | Abbreviation |
| Esophagus |  | ESCC: Esophageal squamous cell carcinoma |
| HGIN: High-grade intraepithelial neoplasias | ||
| LGIN: Low-grade intraepithelial neoplasias | ||
| Liver | 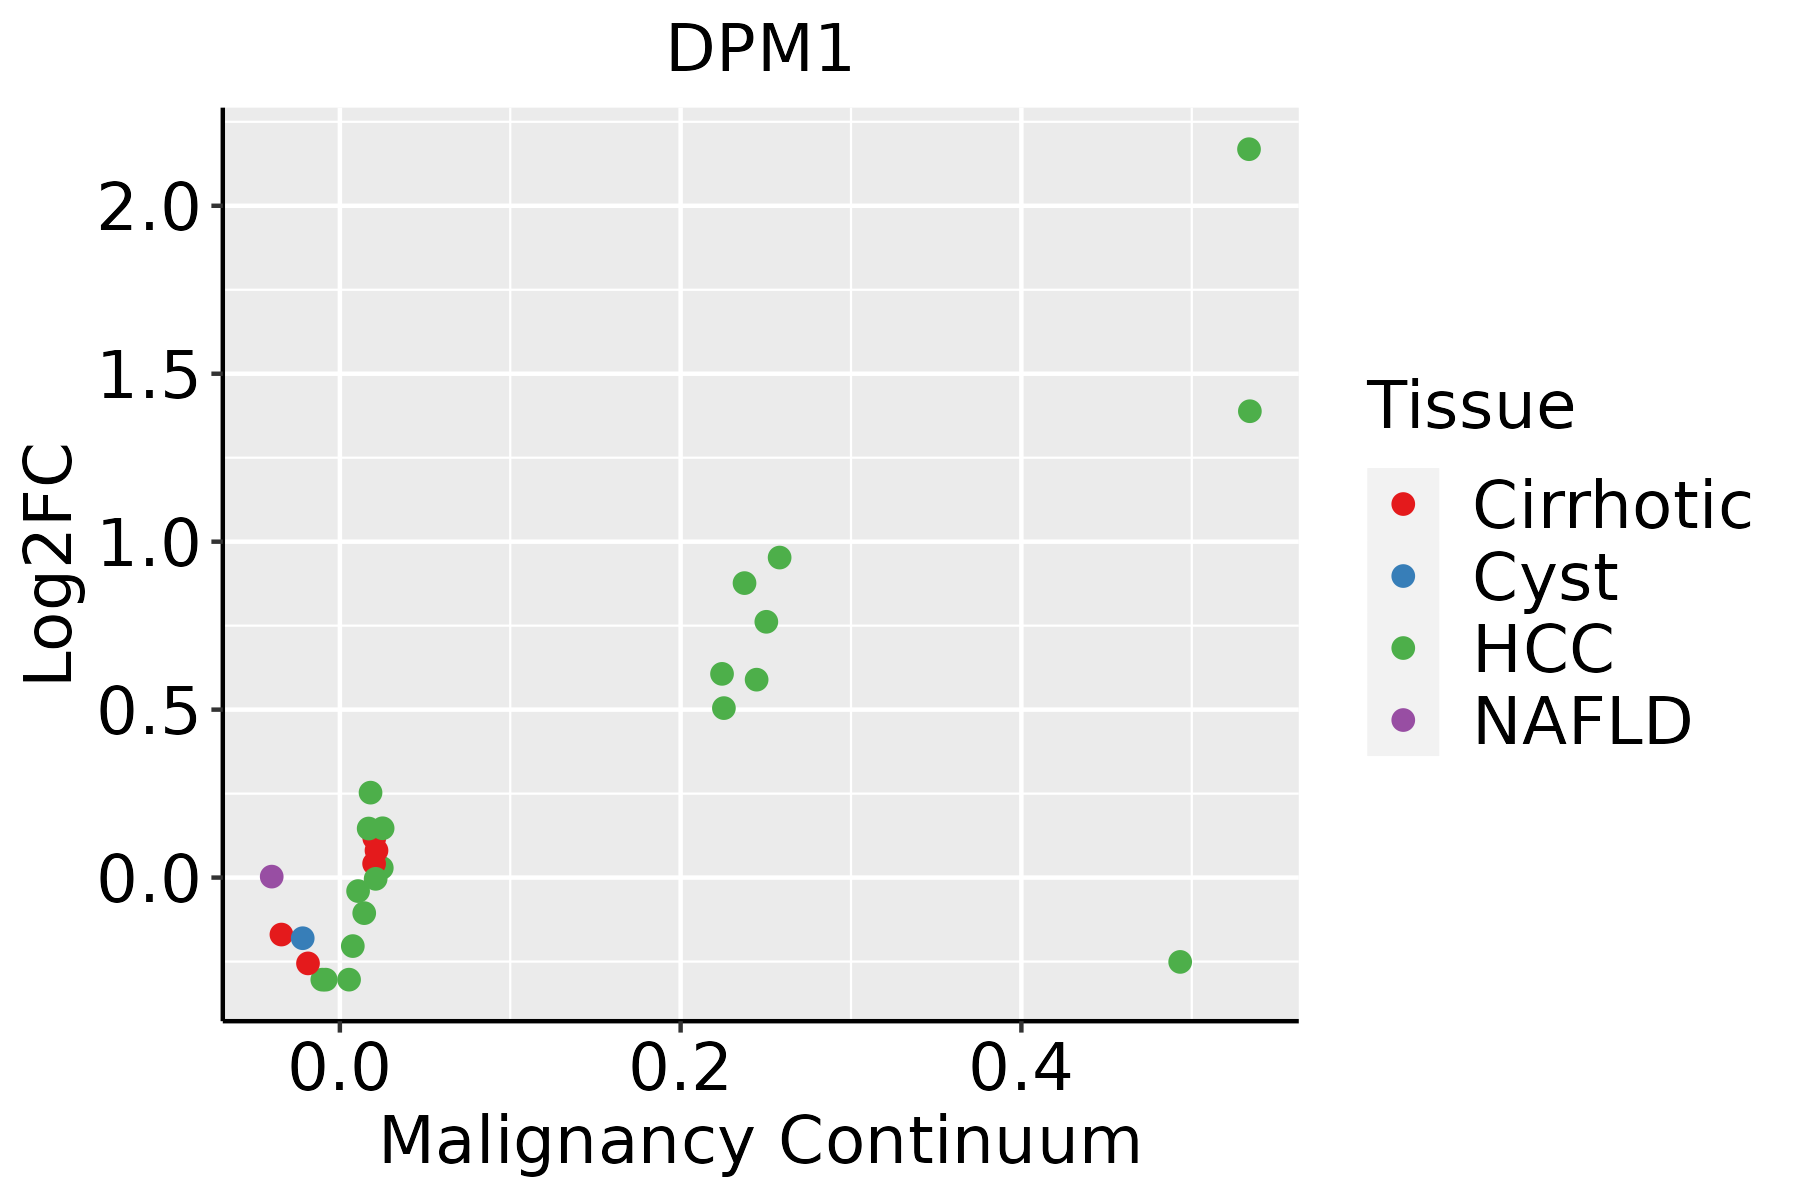 | HCC: Hepatocellular carcinoma |
| NAFLD: Non-alcoholic fatty liver disease | ||
| Oral Cavity |  | EOLP: Erosive Oral lichen planus |
| LP: leukoplakia | ||
| NEOLP: Non-erosive oral lichen planus | ||
| OSCC: Oral squamous cell carcinoma | ||
| Skin | 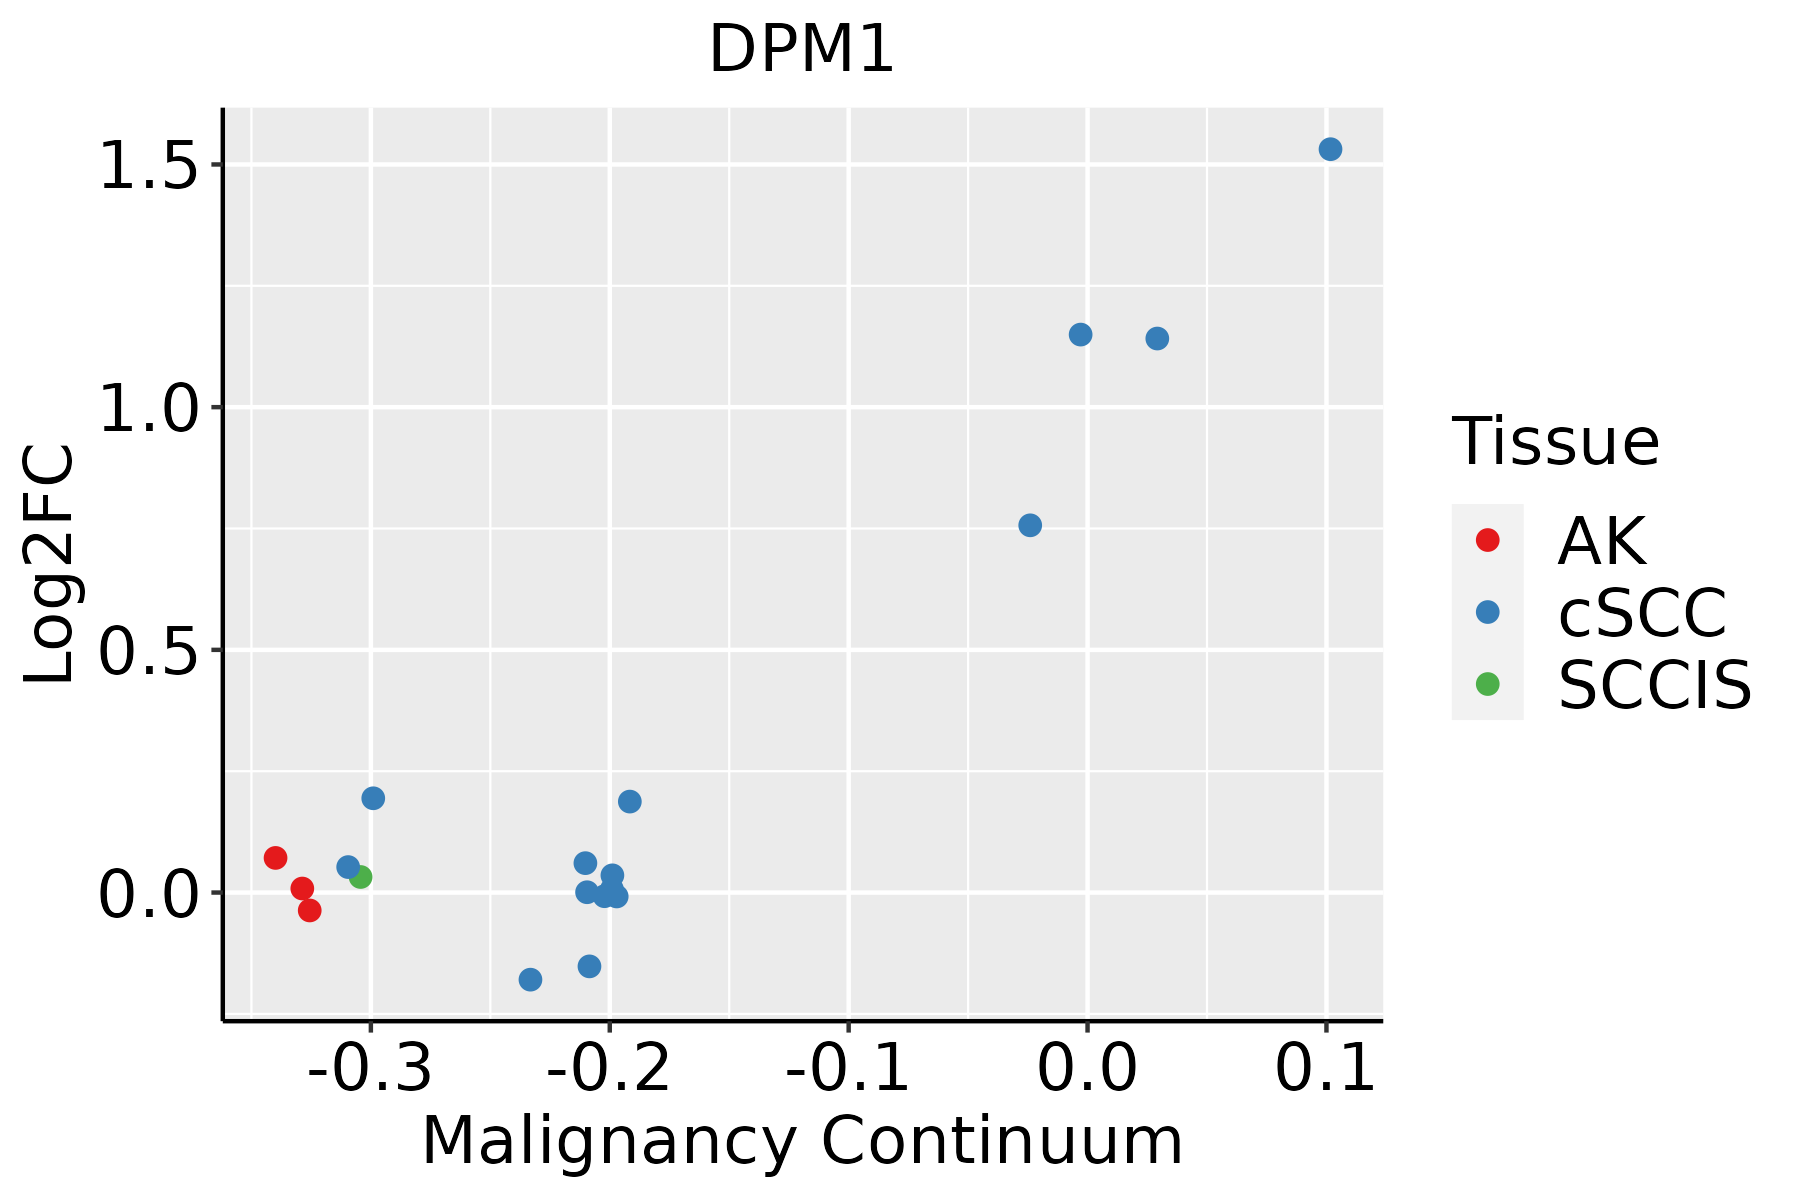 | AK: Actinic keratosis |
| cSCC: Cutaneous squamous cell carcinoma | ||
| SCCIS:squamous cell carcinoma in situ | ||
| Thyroid | 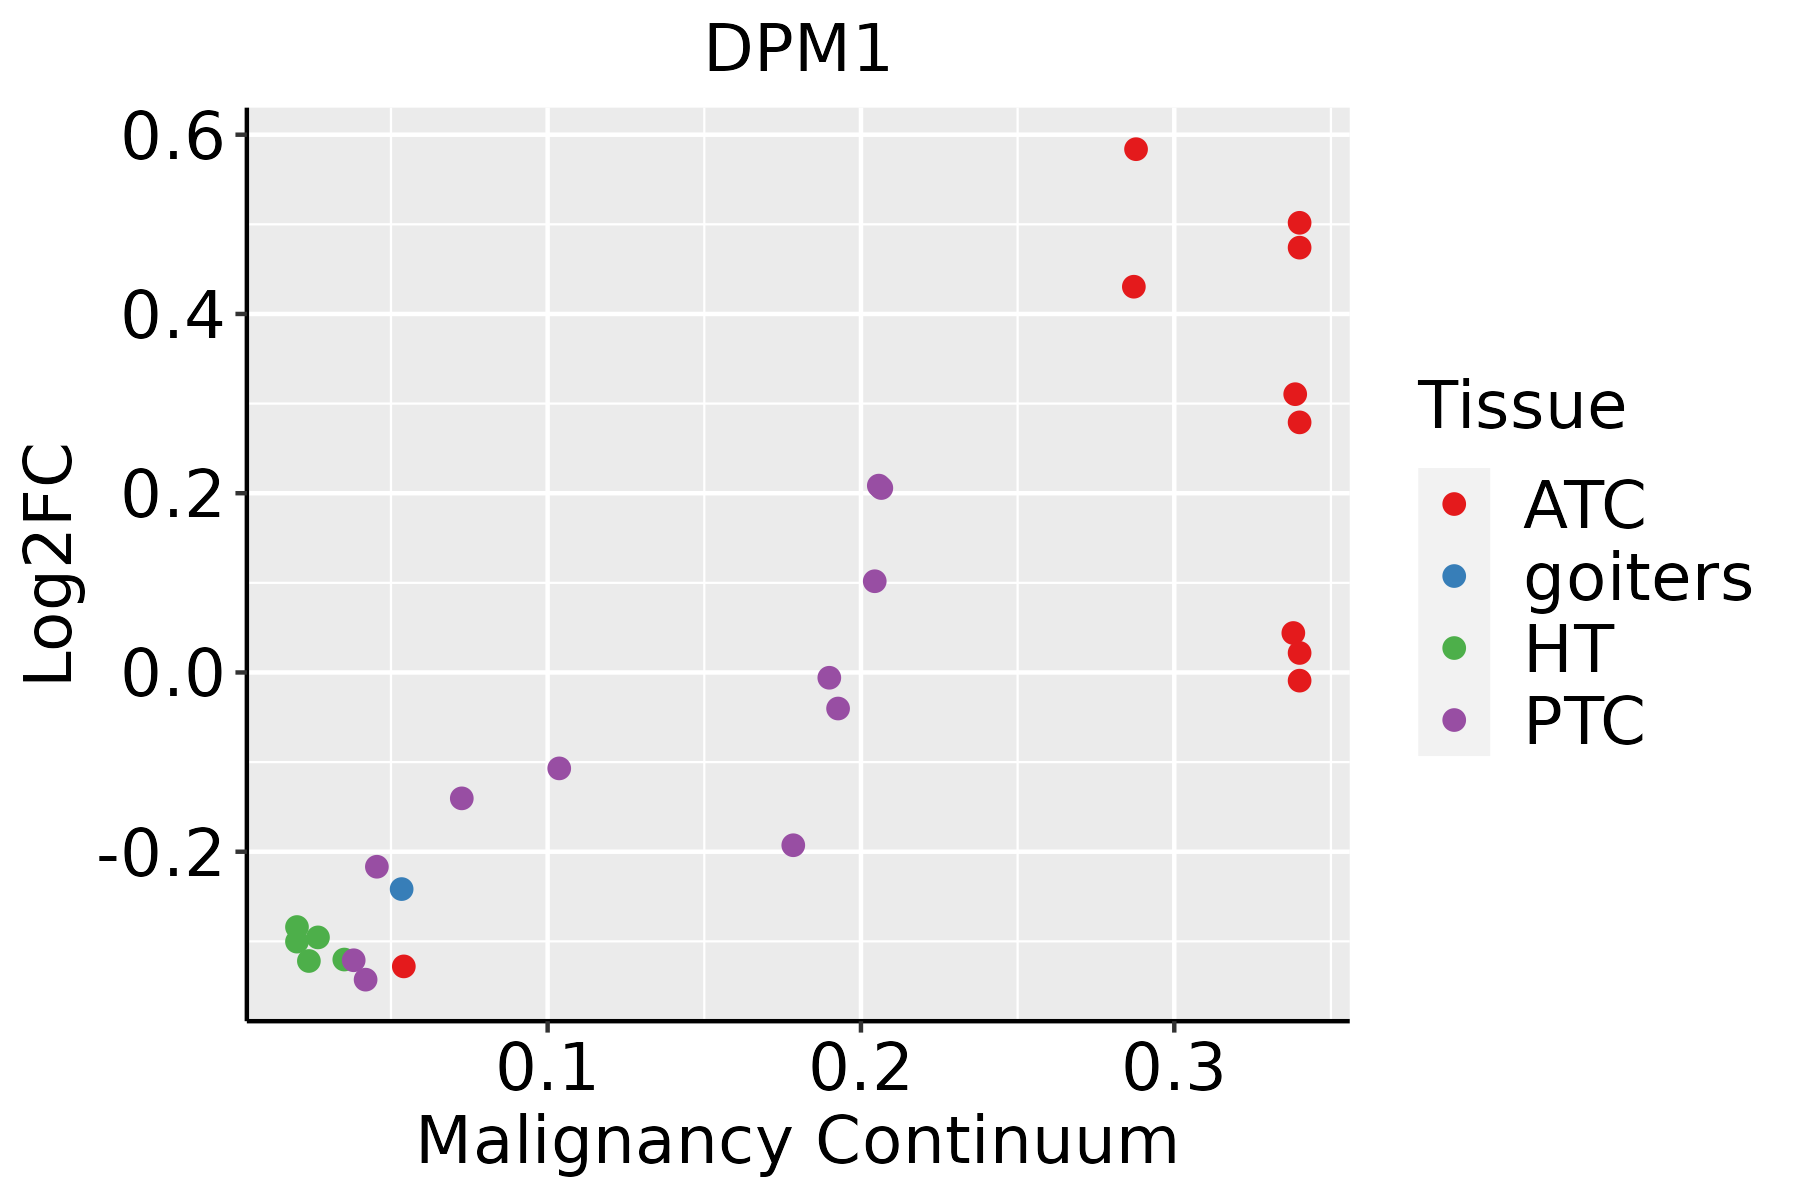 | ATC: Anaplastic thyroid cancer |
| HT: Hashimoto's thyroiditis | ||
| PTC: Papillary thyroid cancer |
| ∗log2FC in expression of this searched gene in stem-like cells from each diseased tissue sample relative to stem-like cells in normal samples in each tissue plotted against the malignancy continuum. Samples are colored based on if they are from different disease stage. |
Top |
Malignant transformation related pathway analysis |
| Find out the enriched GO biological processes and KEGG pathways involved in transition from healthy to precancer to cancer |
| Tissue | Disease Stage | Enriched GO biological Processes |
| Colorectum | AD |  |
| Colorectum | SER |  |
| Colorectum | MSS |  |
| Colorectum | MSI-H |  |
| Colorectum | FAP |  |
| ∗Top 15 enriched GO BP terms are showed in the bar plot of each disease state in each tissue. Each row represents a significant GO biological process which is colored according to the -log10(p.adjust). |
| Page: 1 2 3 4 5 6 7 8 9 |
| GO ID | Tissue | Disease Stage | Description | Gene Ratio | Bg Ratio | pvalue | p.adjust | Count |
| GO:00086544 | Esophagus | ESCC | phospholipid biosynthetic process | 162/8552 | 253/18723 | 2.59e-09 | 5.73e-08 | 162 |
| GO:00464744 | Esophagus | ESCC | glycerophospholipid biosynthetic process | 135/8552 | 211/18723 | 5.75e-08 | 1.02e-06 | 135 |
| GO:00066433 | Esophagus | ESCC | membrane lipid metabolic process | 130/8552 | 203/18723 | 9.29e-08 | 1.54e-06 | 130 |
| GO:00091002 | Esophagus | ESCC | glycoprotein metabolic process | 226/8552 | 387/18723 | 2.64e-07 | 3.94e-06 | 226 |
| GO:00450175 | Esophagus | ESCC | glycerolipid biosynthetic process | 154/8552 | 252/18723 | 5.20e-07 | 6.96e-06 | 154 |
| GO:00700854 | Esophagus | ESCC | glycosylation | 144/8552 | 240/18723 | 5.12e-06 | 5.38e-05 | 144 |
| GO:00066446 | Esophagus | ESCC | phospholipid metabolic process | 218/8552 | 383/18723 | 5.37e-06 | 5.59e-05 | 218 |
| GO:00464673 | Esophagus | ESCC | membrane lipid biosynthetic process | 91/8552 | 142/18723 | 7.19e-06 | 7.19e-05 | 91 |
| GO:00060668 | Esophagus | ESCC | alcohol metabolic process | 202/8552 | 353/18723 | 7.32e-06 | 7.26e-05 | 202 |
| GO:00064865 | Esophagus | ESCC | protein glycosylation | 135/8552 | 226/18723 | 1.36e-05 | 1.24e-04 | 135 |
| GO:00434135 | Esophagus | ESCC | macromolecule glycosylation | 135/8552 | 226/18723 | 1.36e-05 | 1.24e-04 | 135 |
| GO:00421573 | Esophagus | ESCC | lipoprotein metabolic process | 86/8552 | 135/18723 | 1.78e-05 | 1.57e-04 | 86 |
| GO:00092256 | Esophagus | ESCC | nucleotide-sugar metabolic process | 29/8552 | 36/18723 | 1.91e-05 | 1.67e-04 | 29 |
| GO:00064973 | Esophagus | ESCC | protein lipidation | 62/8552 | 92/18723 | 2.08e-05 | 1.80e-04 | 62 |
| GO:00091012 | Esophagus | ESCC | glycoprotein biosynthetic process | 181/8552 | 317/18723 | 2.54e-05 | 2.15e-04 | 181 |
| GO:00421583 | Esophagus | ESCC | lipoprotein biosynthetic process | 64/8552 | 96/18723 | 2.61e-05 | 2.20e-04 | 64 |
| GO:00065063 | Esophagus | ESCC | GPI anchor biosynthetic process | 26/8552 | 32/18723 | 3.97e-05 | 3.21e-04 | 26 |
| GO:00066505 | Esophagus | ESCC | glycerophospholipid metabolic process | 174/8552 | 306/18723 | 4.92e-05 | 3.85e-04 | 174 |
| GO:00065053 | Esophagus | ESCC | GPI anchor metabolic process | 26/8552 | 33/18723 | 1.06e-04 | 7.43e-04 | 26 |
| GO:00066642 | Esophagus | ESCC | glycolipid metabolic process | 63/8552 | 100/18723 | 3.55e-04 | 2.06e-03 | 63 |
| Page: 1 2 3 4 5 |
| Pathway ID | Tissue | Disease Stage | Description | Gene Ratio | Bg Ratio | pvalue | p.adjust | qvalue | Count |
| hsa005106 | Esophagus | HGIN | N-Glycan biosynthesis | 17/1383 | 53/8465 | 3.43e-03 | 2.54e-02 | 2.02e-02 | 17 |
| hsa0051013 | Esophagus | HGIN | N-Glycan biosynthesis | 17/1383 | 53/8465 | 3.43e-03 | 2.54e-02 | 2.02e-02 | 17 |
| hsa0051023 | Esophagus | ESCC | N-Glycan biosynthesis | 39/4205 | 53/8465 | 3.26e-04 | 1.15e-03 | 5.89e-04 | 39 |
| hsa0051033 | Esophagus | ESCC | N-Glycan biosynthesis | 39/4205 | 53/8465 | 3.26e-04 | 1.15e-03 | 5.89e-04 | 39 |
| hsa005104 | Liver | Cirrhotic | N-Glycan biosynthesis | 32/2530 | 53/8465 | 3.82e-06 | 4.10e-05 | 2.53e-05 | 32 |
| hsa0051011 | Liver | Cirrhotic | N-Glycan biosynthesis | 32/2530 | 53/8465 | 3.82e-06 | 4.10e-05 | 2.53e-05 | 32 |
| hsa0051021 | Liver | HCC | N-Glycan biosynthesis | 40/4020 | 53/8465 | 2.95e-05 | 1.87e-04 | 1.04e-04 | 40 |
| hsa0051031 | Liver | HCC | N-Glycan biosynthesis | 40/4020 | 53/8465 | 2.95e-05 | 1.87e-04 | 1.04e-04 | 40 |
| hsa005105 | Oral cavity | OSCC | N-Glycan biosynthesis | 39/3704 | 53/8465 | 9.77e-06 | 4.36e-05 | 2.22e-05 | 39 |
| hsa0051012 | Oral cavity | OSCC | N-Glycan biosynthesis | 39/3704 | 53/8465 | 9.77e-06 | 4.36e-05 | 2.22e-05 | 39 |
| hsa0051022 | Oral cavity | LP | N-Glycan biosynthesis | 31/2418 | 53/8465 | 4.86e-06 | 4.14e-05 | 2.67e-05 | 31 |
| hsa0051032 | Oral cavity | LP | N-Glycan biosynthesis | 31/2418 | 53/8465 | 4.86e-06 | 4.14e-05 | 2.67e-05 | 31 |
| Page: 1 |
Top |
Cell-cell communication analysis |
| Identification of potential cell-cell interactions between two cell types and their ligand-receptor pairs for different disease states |
| Ligand | Receptor | LRpair | Pathway | Tissue | Disease Stage |
| Page: 1 |
Top |
Single-cell gene regulatory network inference analysis |
| Find out the significant the regulons (TFs) and the target genes of each regulon across cell types for different disease states |
| TF | Cell Type | Tissue | Disease Stage | Target Gene | RSS | Regulon Activity |
| ∗The dot plots of a searched regulon are shown for all cell subpopulations in each disease state of each tissue based on the regulon specific score inferred using pySCENIC and by calculating the average expression. |
| Page: 1 |
Top |
Somatic mutation of malignant transformation related genes |
| Annotation of somatic variants for genes involved in malignant transformation |
| Hugo Symbol | Variant Class | Variant Classification | dbSNP RS | HGVSc | HGVSp | HGVSp Short | SWISSPROT | BIOTYPE | SIFT | PolyPhen | Tumor Sample Barcode | Tissue | Histology | Sex | Age | Stage | Therapy Types | Drugs | Outcome |
| DPM1 | SNV | Missense_Mutation | c.667N>C | p.Glu223Gln | p.E223Q | protein_coding | tolerated(0.75) | benign(0.023) | TCGA-A1-A0SI-01 | Breast | breast invasive carcinoma | Female | <65 | I/II | Unknown | Unknown | SD | ||
| DPM1 | SNV | Missense_Mutation | novel | c.307N>G | p.Ile103Val | p.I103V | protein_coding | tolerated(0.4) | benign(0.074) | TCGA-A7-A4SF-01 | Breast | breast invasive carcinoma | Female | <65 | I/II | Chemotherapy | carboplatin | CR | |
| DPM1 | SNV | Missense_Mutation | rs764346012 | c.47N>G | p.Glu16Gly | p.E16G | protein_coding | deleterious_low_confidence(0.03) | benign(0.007) | TCGA-EW-A1PH-01 | Breast | breast invasive carcinoma | Female | <65 | I/II | Chemotherapy | cyclophosphamide | SD | |
| DPM1 | SNV | Missense_Mutation | c.449G>T | p.Gly150Val | p.G150V | protein_coding | tolerated(0.07) | possibly_damaging(0.783) | TCGA-GM-A2D9-01 | Breast | breast invasive carcinoma | Female | >=65 | I/II | Hormone Therapy | arimidex | SD | ||
| DPM1 | SNV | Missense_Mutation | novel | c.477N>C | p.Leu159Phe | p.L159F | protein_coding | tolerated(0.31) | benign(0.044) | TCGA-VS-A8EI-01 | Cervix | cervical & endocervical cancer | Female | <65 | I/II | Chemotherapy | cisplatin | CR | |
| DPM1 | SNV | Missense_Mutation | novel | c.298A>T | p.Thr100Ser | p.T100S | protein_coding | tolerated(0.3) | possibly_damaging(0.823) | TCGA-VS-A9UJ-01 | Cervix | cervical & endocervical cancer | Female | <65 | I/II | Unknown | Unknown | PD | |
| DPM1 | SNV | Missense_Mutation | c.685T>G | p.Cys229Gly | p.C229G | protein_coding | deleterious(0) | probably_damaging(0.946) | TCGA-AA-A00N-01 | Colorectum | colon adenocarcinoma | Male | >=65 | I/II | Unknown | Unknown | PD | ||
| DPM1 | SNV | Missense_Mutation | c.224N>T | p.Ala75Val | p.A75V | protein_coding | tolerated(0.35) | probably_damaging(0.998) | TCGA-CM-6171-01 | Colorectum | colon adenocarcinoma | Female | >=65 | I/II | Unknown | Unknown | SD | ||
| DPM1 | SNV | Missense_Mutation | c.850N>A | p.Phe284Ile | p.F284I | protein_coding | deleterious(0) | possibly_damaging(0.902) | TCGA-AG-3726-01 | Colorectum | rectum adenocarcinoma | Female | <65 | I/II | Unknown | Unknown | SD | ||
| DPM1 | SNV | Missense_Mutation | c.392T>G | p.Phe131Cys | p.F131C | protein_coding | deleterious(0) | probably_damaging(0.992) | TCGA-AG-A002-01 | Colorectum | rectum adenocarcinoma | Male | <65 | I/II | Unknown | Unknown | SD |
| Page: 1 2 3 4 |
Top |
Related drugs of malignant transformation related genes |
| Identification of chemicals and drugs interact with genes involved in malignant transfromation |
| (DGIdb 4.0) |
| Entrez ID | Symbol | Category | Interaction Types | Drug Claim Name | Drug Name | PMIDs |
| Page: 1 |

Copyright 2023-Present -The University of Texas Health Science Center at Houston |