
|
|||||
|
 | |
| |
| |
| |
| |
| |
|
Gene: DPH7 |
Gene summary for DPH7 |
| Gene information | Species | Human | Gene symbol | DPH7 | Gene ID | 92715 |
| Gene name | diphthamide biosynthesis 7 | |
| Gene Alias | C9orf112 | |
| Cytomap | 9q34.3 | |
| Gene Type | protein-coding | GO ID | GO:0002181 | UniProtAcc | Q9BTV6 |
Top |
Malignant transformation analysis |
| Identification of the aberrant gene expression in precancerous and cancerous lesions by comparing the gene expression of stem-like cells in diseased tissues with normal stem cells |
| Entrez ID | Symbol | Replicates | Species | Organ | Tissue | Adj P-value | Log2FC | Malignancy |
| 92715 | DPH7 | LZE4T | Human | Esophagus | ESCC | 1.26e-06 | 1.99e-01 | 0.0811 |
| 92715 | DPH7 | LZE7T | Human | Esophagus | ESCC | 1.27e-04 | 2.49e-01 | 0.0667 |
| 92715 | DPH7 | LZE20T | Human | Esophagus | ESCC | 2.12e-09 | 3.09e-01 | 0.0662 |
| 92715 | DPH7 | LZE22T | Human | Esophagus | ESCC | 1.43e-05 | 2.56e-01 | 0.068 |
| 92715 | DPH7 | LZE24T | Human | Esophagus | ESCC | 4.53e-17 | 2.84e-01 | 0.0596 |
| 92715 | DPH7 | LZE21T | Human | Esophagus | ESCC | 4.47e-05 | 3.13e-01 | 0.0655 |
| 92715 | DPH7 | P1T-E | Human | Esophagus | ESCC | 3.69e-08 | 2.96e-01 | 0.0875 |
| 92715 | DPH7 | P2T-E | Human | Esophagus | ESCC | 3.97e-20 | 4.20e-01 | 0.1177 |
| 92715 | DPH7 | P4T-E | Human | Esophagus | ESCC | 1.50e-16 | 3.23e-01 | 0.1323 |
| 92715 | DPH7 | P5T-E | Human | Esophagus | ESCC | 1.69e-17 | 2.90e-01 | 0.1327 |
| 92715 | DPH7 | P8T-E | Human | Esophagus | ESCC | 1.09e-29 | 5.96e-01 | 0.0889 |
| 92715 | DPH7 | P9T-E | Human | Esophagus | ESCC | 2.51e-11 | 2.01e-01 | 0.1131 |
| 92715 | DPH7 | P10T-E | Human | Esophagus | ESCC | 4.32e-21 | 3.04e-01 | 0.116 |
| 92715 | DPH7 | P11T-E | Human | Esophagus | ESCC | 1.22e-14 | 6.21e-01 | 0.1426 |
| 92715 | DPH7 | P12T-E | Human | Esophagus | ESCC | 3.78e-24 | 3.42e-01 | 0.1122 |
| 92715 | DPH7 | P15T-E | Human | Esophagus | ESCC | 7.37e-22 | 4.56e-01 | 0.1149 |
| 92715 | DPH7 | P16T-E | Human | Esophagus | ESCC | 8.58e-21 | 3.07e-01 | 0.1153 |
| 92715 | DPH7 | P17T-E | Human | Esophagus | ESCC | 7.13e-03 | 2.01e-01 | 0.1278 |
| 92715 | DPH7 | P19T-E | Human | Esophagus | ESCC | 9.11e-03 | 2.93e-01 | 0.1662 |
| 92715 | DPH7 | P20T-E | Human | Esophagus | ESCC | 2.12e-13 | 2.38e-01 | 0.1124 |
| Page: 1 2 3 4 |
| Tissue | Expression Dynamics | Abbreviation |
| Esophagus | 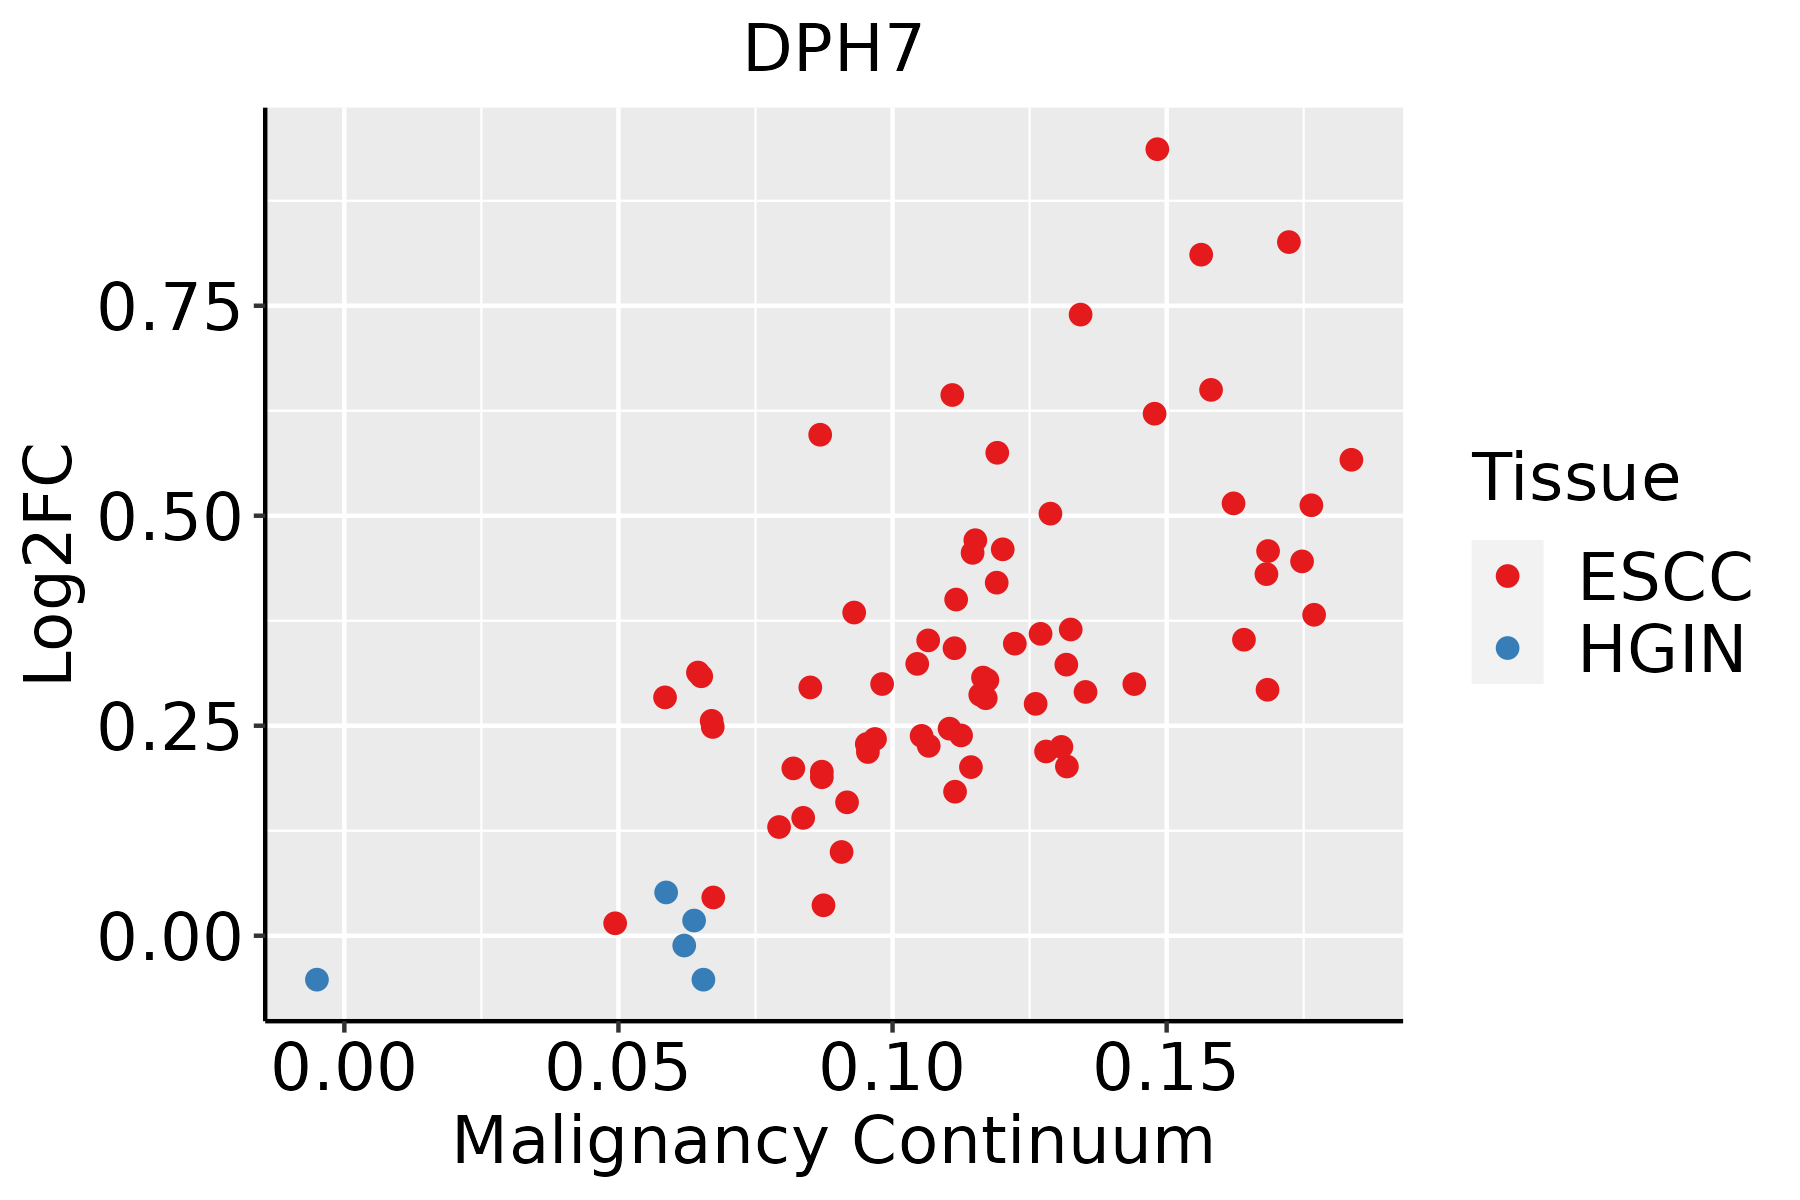 | ESCC: Esophageal squamous cell carcinoma |
| HGIN: High-grade intraepithelial neoplasias | ||
| LGIN: Low-grade intraepithelial neoplasias | ||
| Oral Cavity | 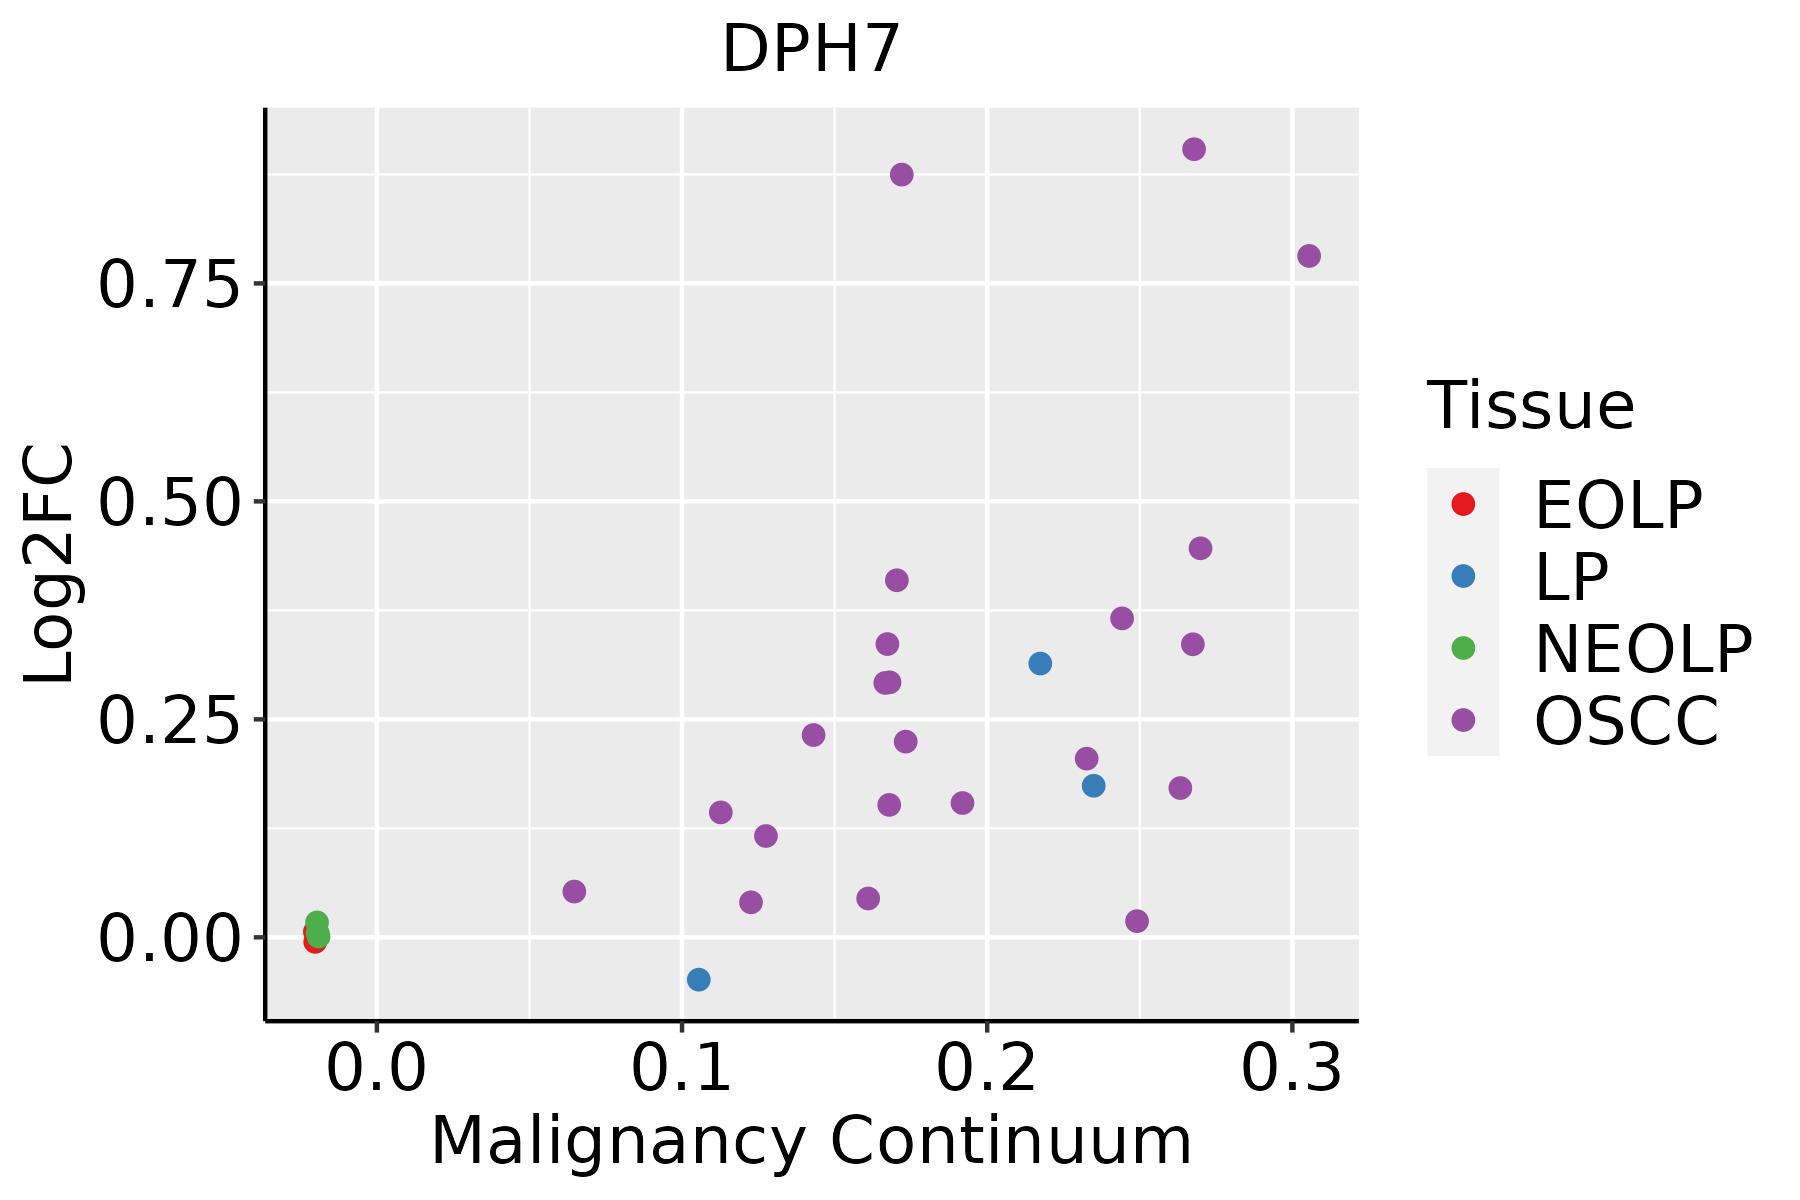 | EOLP: Erosive Oral lichen planus |
| LP: leukoplakia | ||
| NEOLP: Non-erosive oral lichen planus | ||
| OSCC: Oral squamous cell carcinoma |
| ∗log2FC in expression of this searched gene in stem-like cells from each diseased tissue sample relative to stem-like cells in normal samples in each tissue plotted against the malignancy continuum. Samples are colored based on if they are from different disease stage. |
Top |
Malignant transformation related pathway analysis |
| Find out the enriched GO biological processes and KEGG pathways involved in transition from healthy to precancer to cancer |
| Tissue | Disease Stage | Enriched GO biological Processes |
| Colorectum | AD |  |
| Colorectum | SER |  |
| Colorectum | MSS |  |
| Colorectum | MSI-H |  |
| Colorectum | FAP |  |
| ∗Top 15 enriched GO BP terms are showed in the bar plot of each disease state in each tissue. Each row represents a significant GO biological process which is colored according to the -log10(p.adjust). |
| Page: 1 2 3 4 5 6 7 8 9 |
| GO ID | Tissue | Disease Stage | Description | Gene Ratio | Bg Ratio | pvalue | p.adjust | Count |
| GO:0002181111 | Esophagus | ESCC | cytoplasmic translation | 135/8552 | 148/18723 | 4.17e-32 | 2.65e-29 | 135 |
| GO:0006417111 | Esophagus | ESCC | regulation of translation | 304/8552 | 468/18723 | 1.53e-17 | 1.33e-15 | 304 |
| GO:000641419 | Esophagus | ESCC | translational elongation | 41/8552 | 55/18723 | 1.26e-05 | 1.16e-04 | 41 |
| GO:000218120 | Oral cavity | OSCC | cytoplasmic translation | 133/7305 | 148/18723 | 1.94e-38 | 2.46e-35 | 133 |
| GO:000641720 | Oral cavity | OSCC | regulation of translation | 274/7305 | 468/18723 | 4.39e-18 | 4.63e-16 | 274 |
| GO:000641416 | Oral cavity | OSCC | translational elongation | 37/7305 | 55/18723 | 2.03e-05 | 1.94e-04 | 37 |
| Page: 1 |
| Pathway ID | Tissue | Disease Stage | Description | Gene Ratio | Bg Ratio | pvalue | p.adjust | qvalue | Count |
| Page: 1 |
Top |
Cell-cell communication analysis |
| Identification of potential cell-cell interactions between two cell types and their ligand-receptor pairs for different disease states |
| Ligand | Receptor | LRpair | Pathway | Tissue | Disease Stage |
| Page: 1 |
Top |
Single-cell gene regulatory network inference analysis |
| Find out the significant the regulons (TFs) and the target genes of each regulon across cell types for different disease states |
| TF | Cell Type | Tissue | Disease Stage | Target Gene | RSS | Regulon Activity |
| ∗The dot plots of a searched regulon are shown for all cell subpopulations in each disease state of each tissue based on the regulon specific score inferred using pySCENIC and by calculating the average expression. |
| Page: 1 |
Top |
Somatic mutation of malignant transformation related genes |
| Annotation of somatic variants for genes involved in malignant transformation |
| Hugo Symbol | Variant Class | Variant Classification | dbSNP RS | HGVSc | HGVSp | HGVSp Short | SWISSPROT | BIOTYPE | SIFT | PolyPhen | Tumor Sample Barcode | Tissue | Histology | Sex | Age | Stage | Therapy Types | Drugs | Outcome |
| DPH7 | insertion | Frame_Shift_Ins | novel | c.236_237insC | p.Leu80SerfsTer46 | p.L80Sfs*46 | Q9BTV6 | protein_coding | TCGA-A2-A3XZ-01 | Breast | breast invasive carcinoma | Female | <65 | I/II | Chemotherapy | carboplatin | CR | ||
| DPH7 | insertion | Nonsense_Mutation | novel | c.424_425insA | p.Cys142Ter | p.C142* | Q9BTV6 | protein_coding | TCGA-AN-A04A-01 | Breast | breast invasive carcinoma | Female | <65 | III/IV | Unknown | Unknown | SD | ||
| DPH7 | insertion | Nonsense_Mutation | novel | c.423_424insATCTGACCCTTCCCTGCTGCTACCCATCCGGGCCACTGTCTCATC | p.Gln141_Cys142insIleTerProPheProAlaAlaThrHisProGlyHisCysLeuIle | p.Q141_C142insI*PFPAATHPGHCLI | Q9BTV6 | protein_coding | TCGA-AN-A04A-01 | Breast | breast invasive carcinoma | Female | <65 | III/IV | Unknown | Unknown | SD | ||
| DPH7 | SNV | Missense_Mutation | rs3750384 | c.1328N>T | p.Ala443Val | p.A443V | Q9BTV6 | protein_coding | tolerated(1) | benign(0.001) | TCGA-EA-A410-01 | Cervix | cervical & endocervical cancer | Female | <65 | I/II | Unknown | Unknown | SD |
| DPH7 | SNV | Missense_Mutation | rs747961442 | c.589N>A | p.Glu197Lys | p.E197K | Q9BTV6 | protein_coding | deleterious(0) | possibly_damaging(0.878) | TCGA-A6-5661-01 | Colorectum | colon adenocarcinoma | Female | >=65 | I/II | Unknown | Unknown | SD |
| DPH7 | SNV | Missense_Mutation | rs201129300 | c.751N>T | p.Arg251Trp | p.R251W | Q9BTV6 | protein_coding | tolerated(0.05) | benign(0.189) | TCGA-G4-6320-01 | Colorectum | colon adenocarcinoma | Male | >=65 | III/IV | Chemotherapy | oxaliplatin | SD |
| DPH7 | SNV | Missense_Mutation | rs578129824 | c.385N>A | p.Val129Met | p.V129M | Q9BTV6 | protein_coding | tolerated(0.53) | benign(0) | TCGA-QG-A5Z2-01 | Colorectum | colon adenocarcinoma | Male | <65 | I/II | Unknown | Unknown | SD |
| DPH7 | SNV | Missense_Mutation | rs147900158 | c.1091N>T | p.Thr364Met | p.T364M | Q9BTV6 | protein_coding | tolerated(0.12) | benign(0.211) | TCGA-F5-6814-01 | Colorectum | rectum adenocarcinoma | Male | <65 | I/II | Unknown | Unknown | SD |
| DPH7 | SNV | Missense_Mutation | novel | c.236N>A | p.Pro79His | p.P79H | Q9BTV6 | protein_coding | deleterious(0.01) | possibly_damaging(0.862) | TCGA-A5-A0G2-01 | Endometrium | uterine corpus endometrioid carcinoma | Female | <65 | III/IV | Unknown | Unknown | SD |
| DPH7 | SNV | Missense_Mutation | novel | c.1330N>A | p.Leu444Ile | p.L444I | Q9BTV6 | protein_coding | deleterious(0) | probably_damaging(0.911) | TCGA-AP-A1DK-01 | Endometrium | uterine corpus endometrioid carcinoma | Female | <65 | I/II | Unknown | Unknown | SD |
| Page: 1 2 3 |
Top |
Related drugs of malignant transformation related genes |
| Identification of chemicals and drugs interact with genes involved in malignant transfromation |
| (DGIdb 4.0) |
| Entrez ID | Symbol | Category | Interaction Types | Drug Claim Name | Drug Name | PMIDs |
| Page: 1 |

Copyright 2023-Present -The University of Texas Health Science Center at Houston |