
|
|||||
|
 | |
| |
| |
| |
| |
| |
|
Gene: DPH6 |
Gene summary for DPH6 |
| Gene information | Species | Human | Gene symbol | DPH6 | Gene ID | 89978 |
| Gene name | diphthamine biosynthesis 6 | |
| Gene Alias | ATPBD4 | |
| Cytomap | 15q14 | |
| Gene Type | protein-coding | GO ID | GO:0002181 | UniProtAcc | Q7L8W6 |
Top |
Malignant transformation analysis |
| Identification of the aberrant gene expression in precancerous and cancerous lesions by comparing the gene expression of stem-like cells in diseased tissues with normal stem cells |
| Entrez ID | Symbol | Replicates | Species | Organ | Tissue | Adj P-value | Log2FC | Malignancy |
| 89978 | DPH6 | CCI_1 | Human | Cervix | CC | 9.59e-08 | 6.78e-01 | 0.528 |
| 89978 | DPH6 | CCI_3 | Human | Cervix | CC | 1.94e-02 | 5.15e-01 | 0.516 |
| 89978 | DPH6 | HTA11_3410_2000001011 | Human | Colorectum | AD | 1.70e-20 | -7.43e-01 | 0.0155 |
| 89978 | DPH6 | HTA11_2487_2000001011 | Human | Colorectum | SER | 3.37e-09 | -7.05e-01 | -0.1808 |
| 89978 | DPH6 | HTA11_3361_2000001011 | Human | Colorectum | AD | 1.98e-07 | -7.13e-01 | -0.1207 |
| 89978 | DPH6 | HTA11_83_2000001011 | Human | Colorectum | SER | 9.48e-03 | -5.47e-01 | -0.1526 |
| 89978 | DPH6 | HTA11_696_2000001011 | Human | Colorectum | AD | 5.69e-11 | -5.48e-01 | -0.1464 |
| 89978 | DPH6 | HTA11_866_2000001011 | Human | Colorectum | AD | 1.00e-08 | -5.24e-01 | -0.1001 |
| 89978 | DPH6 | HTA11_1391_2000001011 | Human | Colorectum | AD | 7.70e-09 | -5.50e-01 | -0.059 |
| 89978 | DPH6 | HTA11_5212_2000001011 | Human | Colorectum | AD | 2.46e-04 | -7.54e-01 | -0.2061 |
| 89978 | DPH6 | HTA11_7862_2000001011 | Human | Colorectum | AD | 5.50e-06 | -7.25e-01 | -0.0179 |
| 89978 | DPH6 | HTA11_866_3004761011 | Human | Colorectum | AD | 7.62e-15 | -6.77e-01 | 0.096 |
| 89978 | DPH6 | HTA11_10711_2000001011 | Human | Colorectum | AD | 3.94e-06 | -5.76e-01 | 0.0338 |
| 89978 | DPH6 | HTA11_7696_3000711011 | Human | Colorectum | AD | 1.05e-08 | -4.77e-01 | 0.0674 |
| 89978 | DPH6 | HTA11_99999970781_79442 | Human | Colorectum | MSS | 9.09e-08 | -4.61e-01 | 0.294 |
| 89978 | DPH6 | HTA11_99999971662_82457 | Human | Colorectum | MSS | 7.87e-25 | -7.41e-01 | 0.3859 |
| 89978 | DPH6 | HTA11_99999973899_84307 | Human | Colorectum | MSS | 2.44e-06 | -7.30e-01 | 0.2585 |
| 89978 | DPH6 | HTA11_99999974143_84620 | Human | Colorectum | MSS | 1.23e-16 | -6.17e-01 | 0.3005 |
| 89978 | DPH6 | F007 | Human | Colorectum | FAP | 1.37e-03 | -4.22e-01 | 0.1176 |
| 89978 | DPH6 | A015-C-203 | Human | Colorectum | FAP | 3.12e-23 | -4.66e-02 | -0.1294 |
| Page: 1 2 3 4 5 6 7 8 |
| Tissue | Expression Dynamics | Abbreviation |
| Cervix |  | CC: Cervix cancer |
| HSIL_HPV: HPV-infected high-grade squamous intraepithelial lesions | ||
| N_HPV: HPV-infected normal cervix | ||
| Colorectum (GSE201348) |  | FAP: Familial adenomatous polyposis |
| CRC: Colorectal cancer | ||
| Colorectum (HTA11) | 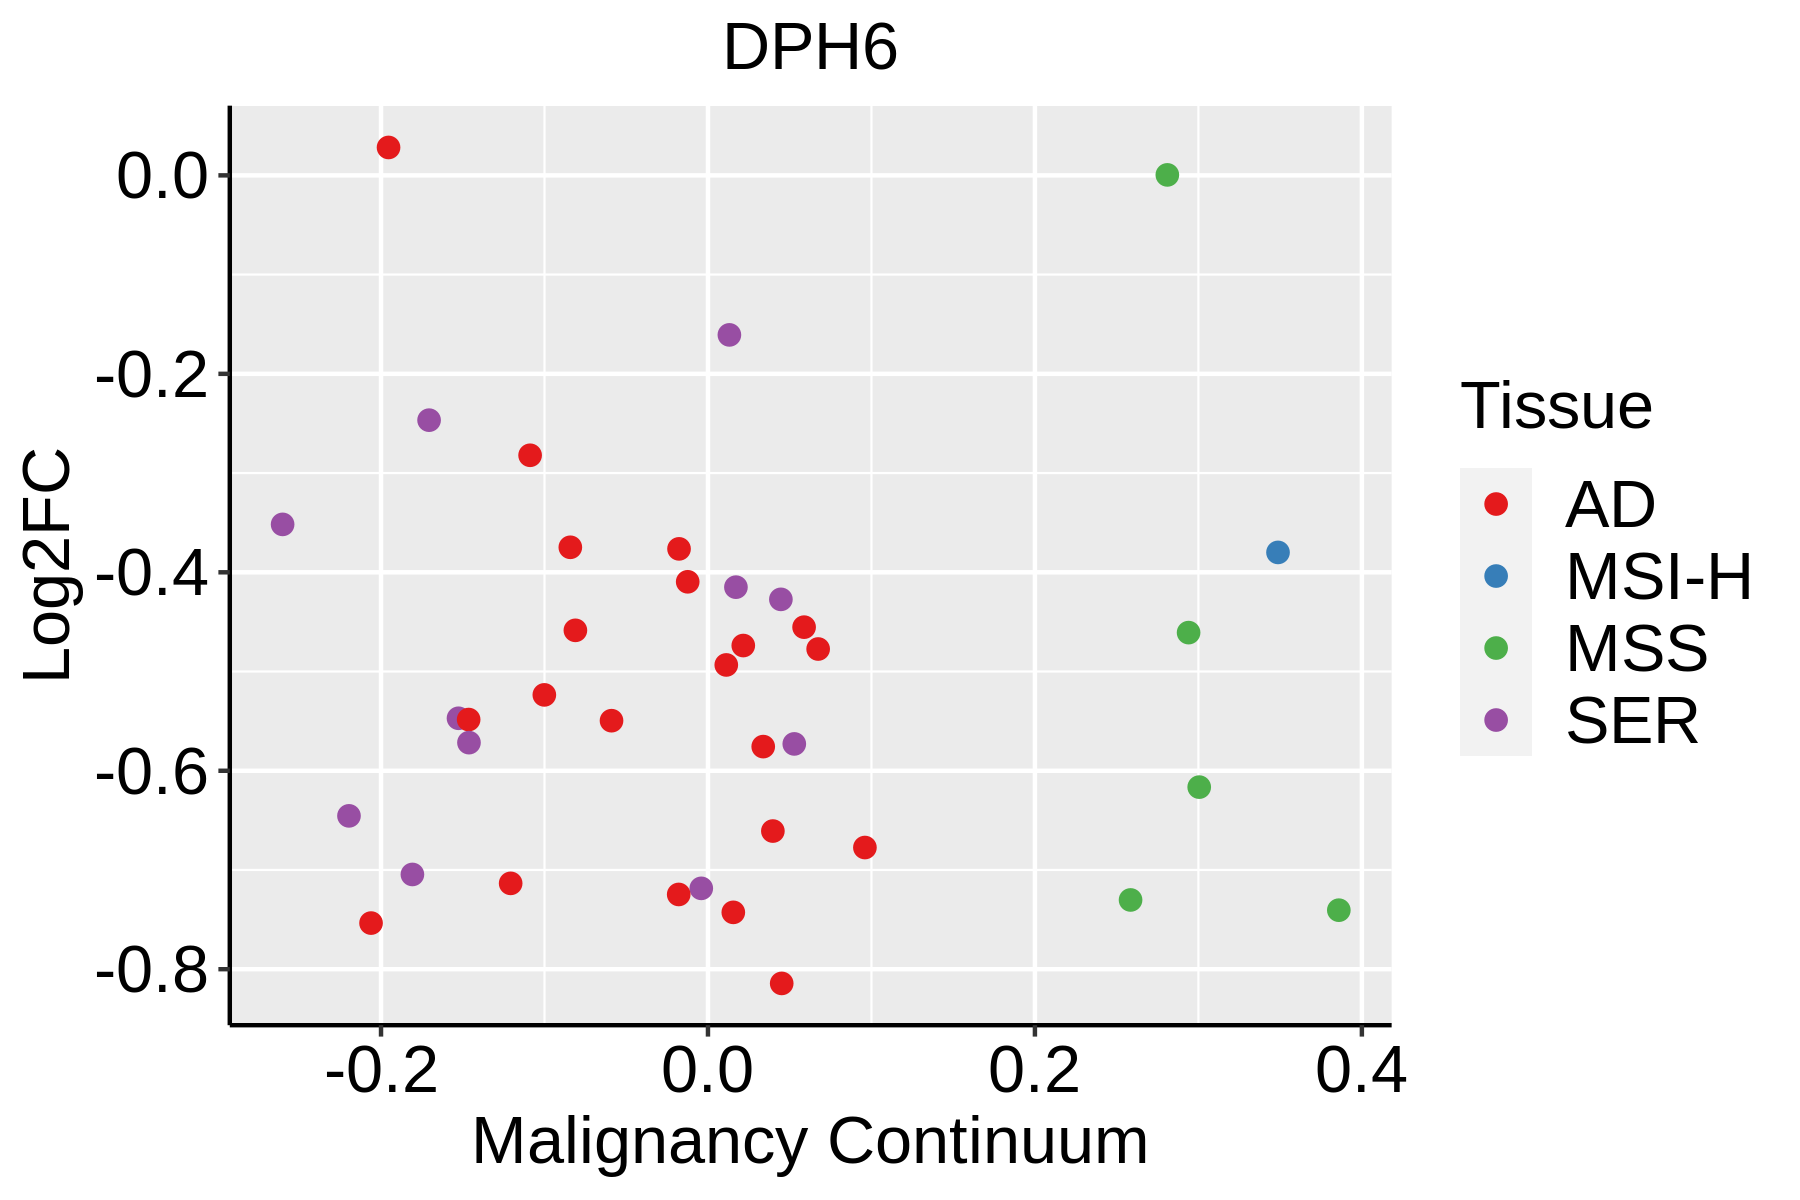 | AD: Adenomas |
| SER: Sessile serrated lesions | ||
| MSI-H: Microsatellite-high colorectal cancer | ||
| MSS: Microsatellite stable colorectal cancer | ||
| Endometrium |  | AEH: Atypical endometrial hyperplasia |
| EEC: Endometrioid Cancer | ||
| Esophagus | 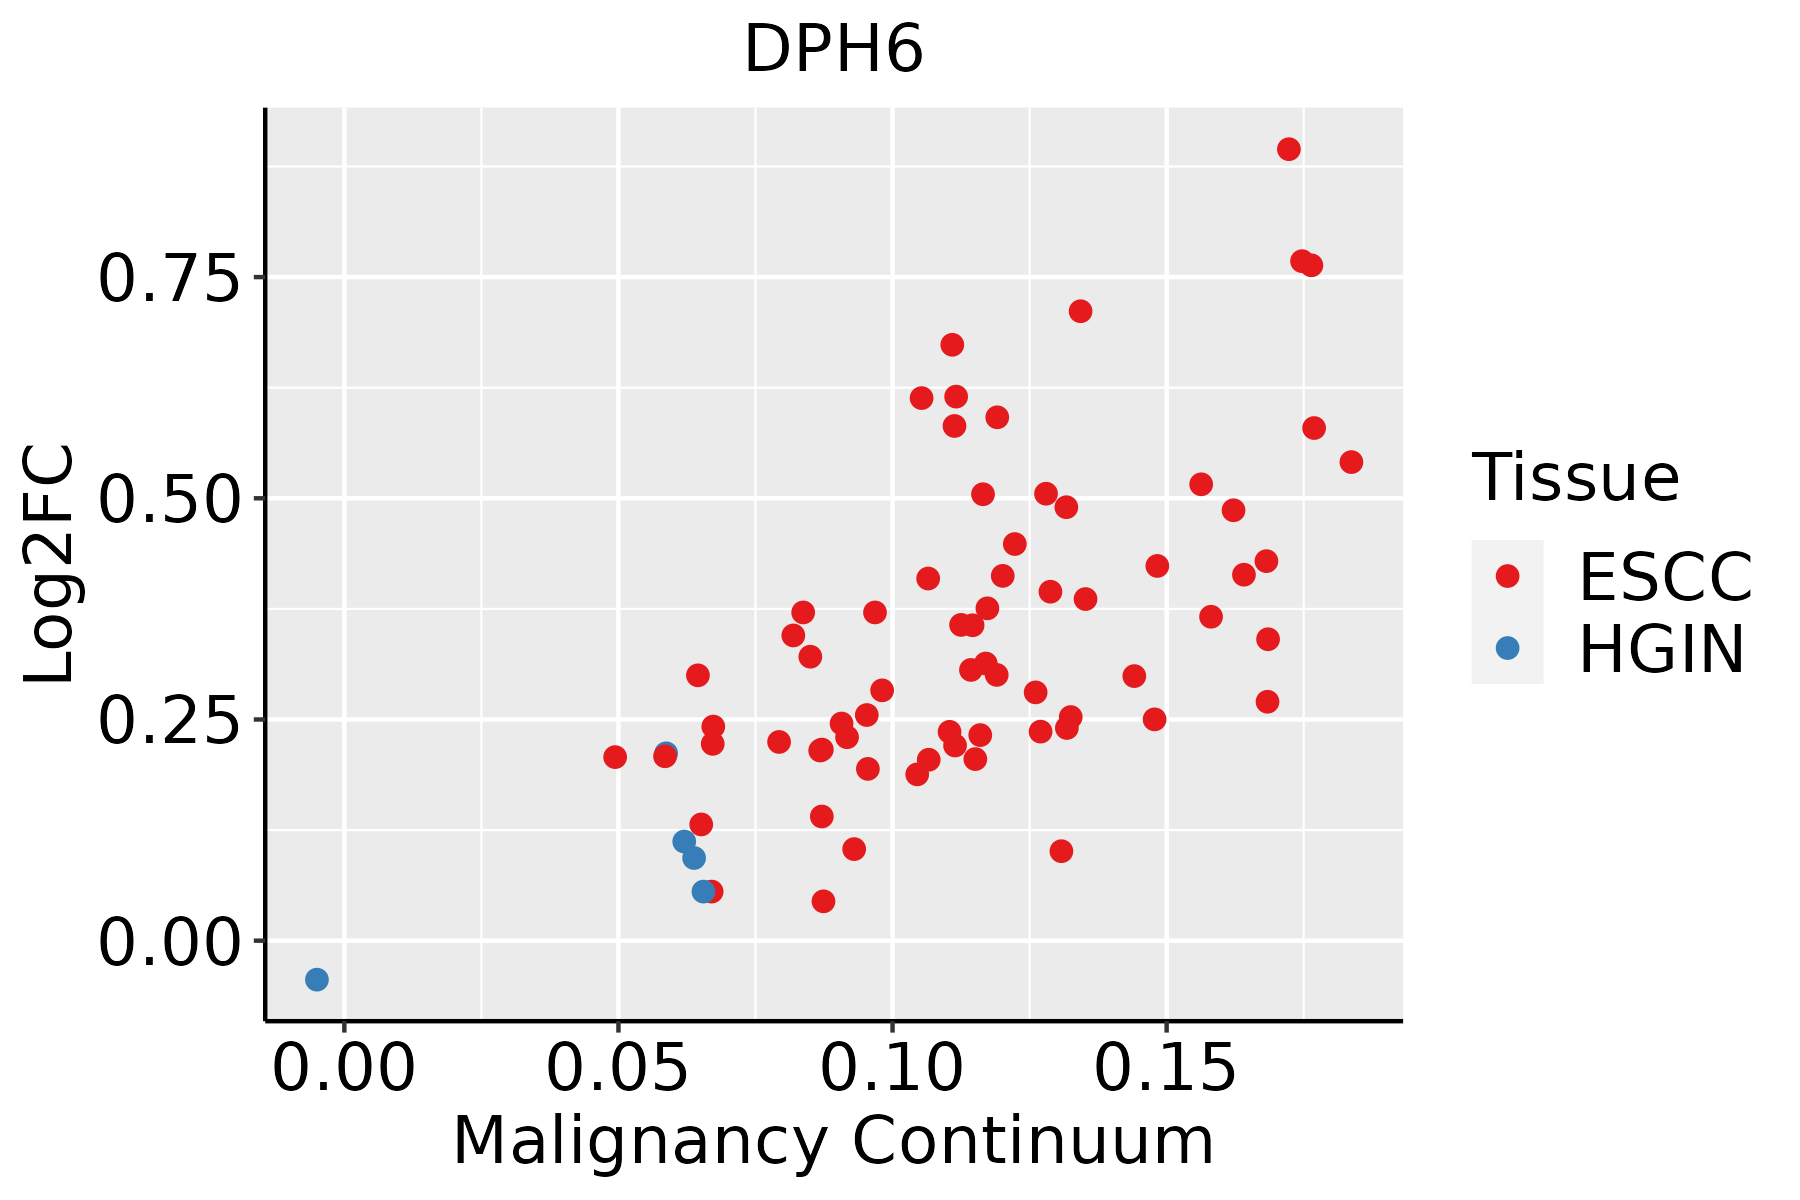 | ESCC: Esophageal squamous cell carcinoma |
| HGIN: High-grade intraepithelial neoplasias | ||
| LGIN: Low-grade intraepithelial neoplasias | ||
| Liver |  | HCC: Hepatocellular carcinoma |
| NAFLD: Non-alcoholic fatty liver disease | ||
| Lung | 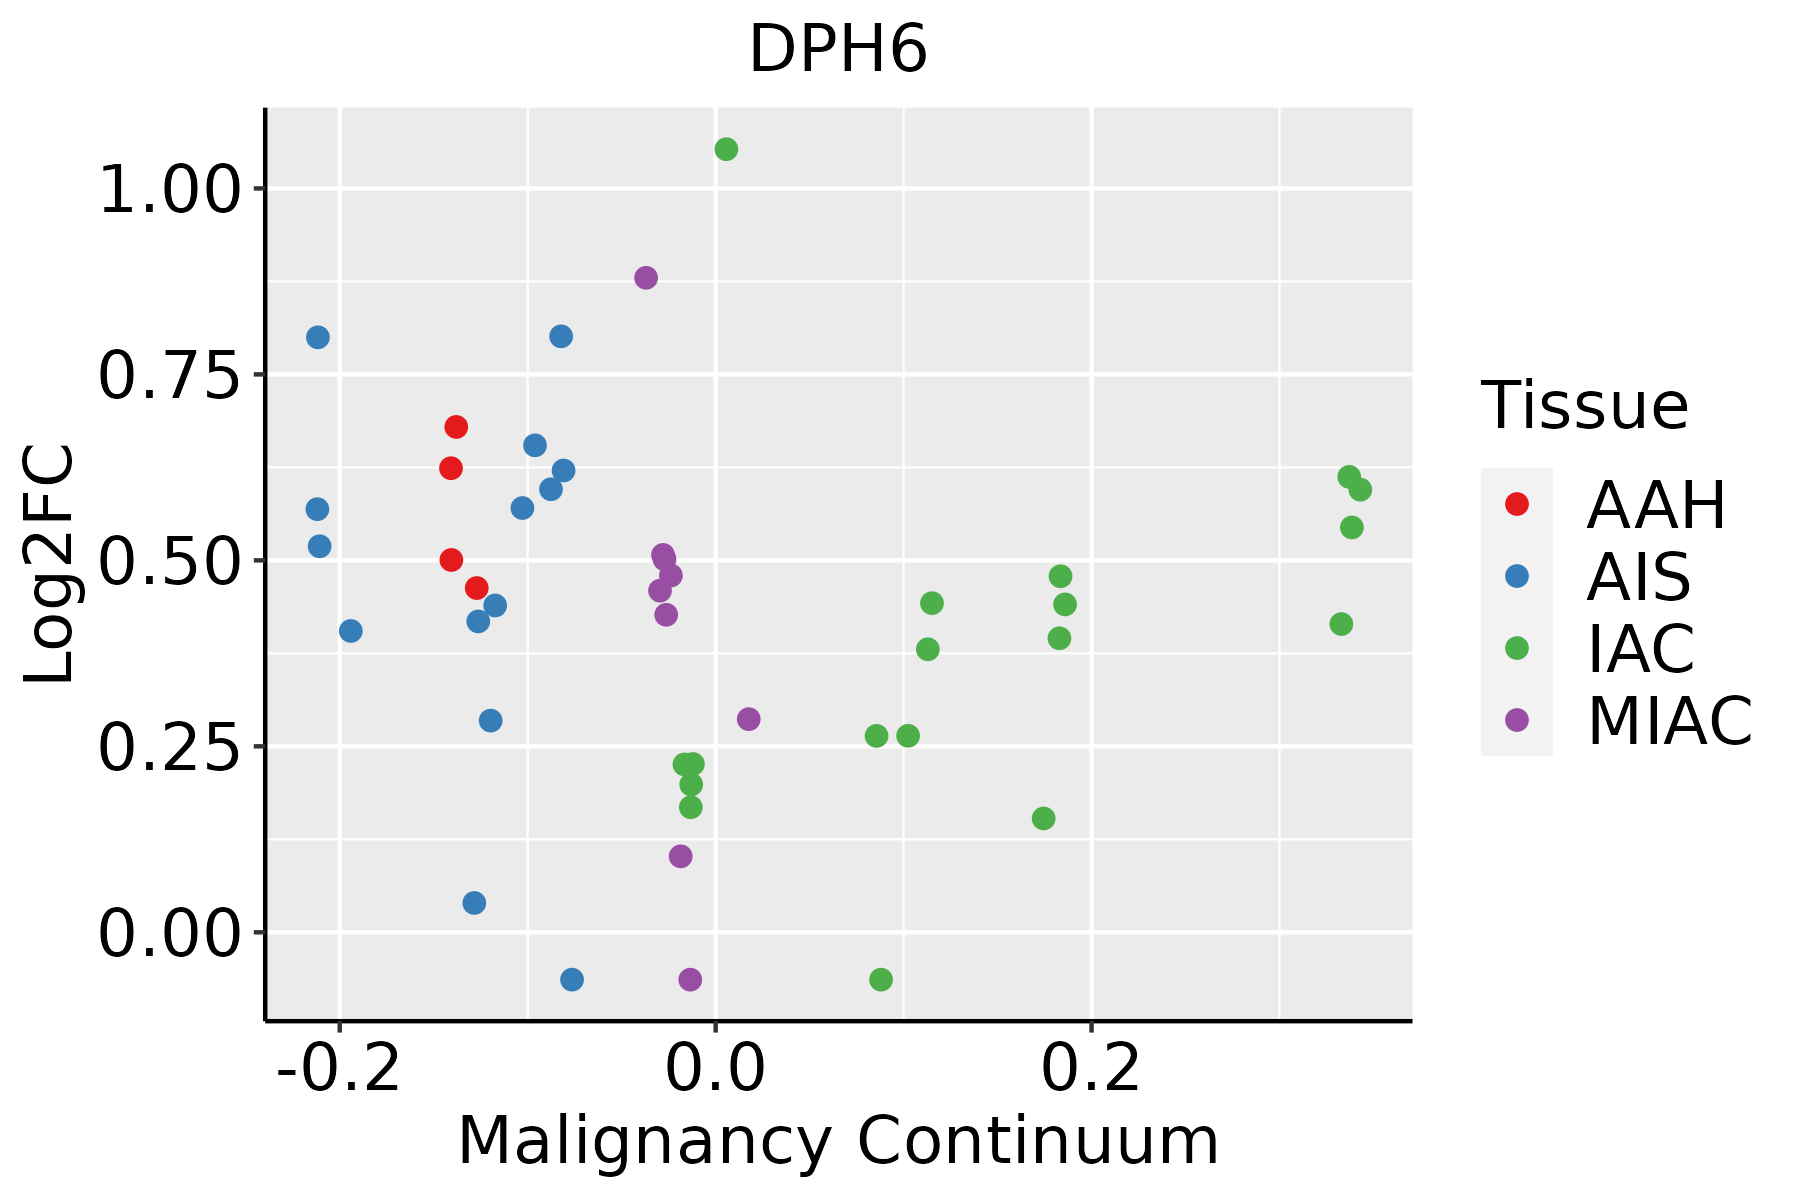 | AAH: Atypical adenomatous hyperplasia |
| AIS: Adenocarcinoma in situ | ||
| IAC: Invasive lung adenocarcinoma | ||
| MIA: Minimally invasive adenocarcinoma | ||
| Oral Cavity | 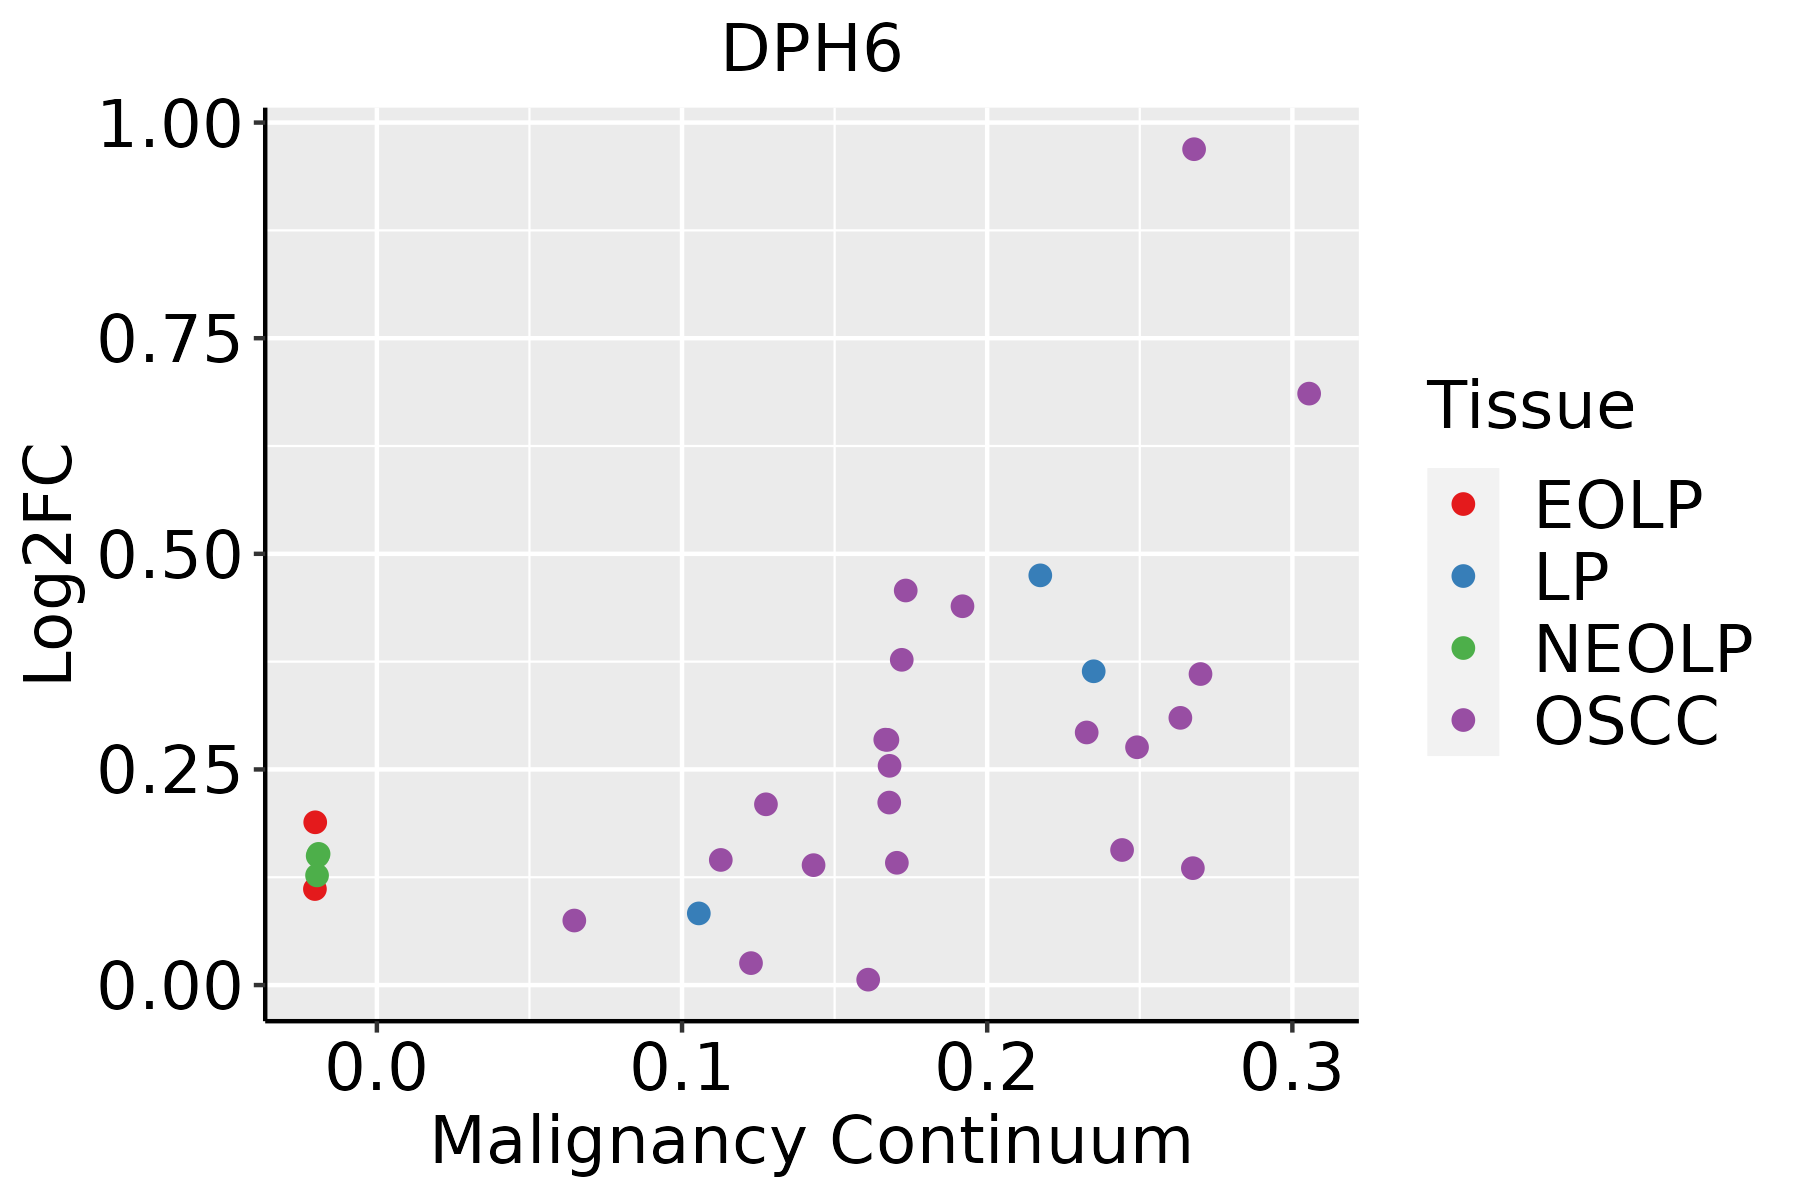 | EOLP: Erosive Oral lichen planus |
| LP: leukoplakia | ||
| NEOLP: Non-erosive oral lichen planus | ||
| OSCC: Oral squamous cell carcinoma |
| ∗log2FC in expression of this searched gene in stem-like cells from each diseased tissue sample relative to stem-like cells in normal samples in each tissue plotted against the malignancy continuum. Samples are colored based on if they are from different disease stage. |
Top |
Malignant transformation related pathway analysis |
| Find out the enriched GO biological processes and KEGG pathways involved in transition from healthy to precancer to cancer |
| Tissue | Disease Stage | Enriched GO biological Processes |
| Colorectum | AD |  |
| Colorectum | SER |  |
| Colorectum | MSS |  |
| Colorectum | MSI-H |  |
| Colorectum | FAP |  |
| ∗Top 15 enriched GO BP terms are showed in the bar plot of each disease state in each tissue. Each row represents a significant GO biological process which is colored according to the -log10(p.adjust). |
| Page: 1 2 3 4 5 6 7 8 9 |
| GO ID | Tissue | Disease Stage | Description | Gene Ratio | Bg Ratio | pvalue | p.adjust | Count |
| GO:000218110 | Cervix | CC | cytoplasmic translation | 96/2311 | 148/18723 | 4.87e-51 | 2.91e-47 | 96 |
| GO:000641710 | Cervix | CC | regulation of translation | 89/2311 | 468/18723 | 1.86e-05 | 3.46e-04 | 89 |
| GO:0002181 | Colorectum | AD | cytoplasmic translation | 109/3918 | 148/18723 | 3.40e-43 | 2.13e-39 | 109 |
| GO:0006417 | Colorectum | AD | regulation of translation | 141/3918 | 468/18723 | 1.32e-06 | 4.22e-05 | 141 |
| GO:0006414 | Colorectum | AD | translational elongation | 21/3918 | 55/18723 | 2.53e-03 | 1.93e-02 | 21 |
| GO:00021811 | Colorectum | SER | cytoplasmic translation | 102/2897 | 148/18723 | 1.38e-48 | 8.49e-45 | 102 |
| GO:00064171 | Colorectum | SER | regulation of translation | 100/2897 | 468/18723 | 3.76e-04 | 5.74e-03 | 100 |
| GO:00064141 | Colorectum | SER | translational elongation | 17/2897 | 55/18723 | 3.00e-03 | 2.65e-02 | 17 |
| GO:00021812 | Colorectum | MSS | cytoplasmic translation | 108/3467 | 148/18723 | 1.78e-47 | 1.11e-43 | 108 |
| GO:00064172 | Colorectum | MSS | regulation of translation | 134/3467 | 468/18723 | 4.43e-08 | 2.38e-06 | 134 |
| GO:00064142 | Colorectum | MSS | translational elongation | 19/3467 | 55/18723 | 3.47e-03 | 2.59e-02 | 19 |
| GO:00021814 | Colorectum | FAP | cytoplasmic translation | 76/2622 | 148/18723 | 3.31e-27 | 2.03e-23 | 76 |
| GO:00064174 | Colorectum | FAP | regulation of translation | 111/2622 | 468/18723 | 8.47e-09 | 1.13e-06 | 111 |
| GO:00021815 | Colorectum | CRC | cytoplasmic translation | 70/2078 | 148/18723 | 1.53e-28 | 9.16e-25 | 70 |
| GO:00064175 | Colorectum | CRC | regulation of translation | 82/2078 | 468/18723 | 1.79e-05 | 5.40e-04 | 82 |
| GO:00064143 | Colorectum | CRC | translational elongation | 14/2078 | 55/18723 | 2.21e-03 | 2.15e-02 | 14 |
| GO:000218116 | Endometrium | AEH | cytoplasmic translation | 104/2100 | 148/18723 | 1.01e-64 | 6.07e-61 | 104 |
| GO:000641716 | Endometrium | AEH | regulation of translation | 94/2100 | 468/18723 | 1.14e-08 | 7.62e-07 | 94 |
| GO:00064149 | Endometrium | AEH | translational elongation | 13/2100 | 55/18723 | 6.76e-03 | 3.94e-02 | 13 |
| GO:000218117 | Endometrium | EEC | cytoplasmic translation | 104/2168 | 148/18723 | 2.53e-63 | 1.52e-59 | 104 |
| Page: 1 2 3 |
| Pathway ID | Tissue | Disease Stage | Description | Gene Ratio | Bg Ratio | pvalue | p.adjust | qvalue | Count |
| Page: 1 |
Top |
Cell-cell communication analysis |
| Identification of potential cell-cell interactions between two cell types and their ligand-receptor pairs for different disease states |
| Ligand | Receptor | LRpair | Pathway | Tissue | Disease Stage |
| Page: 1 |
Top |
Single-cell gene regulatory network inference analysis |
| Find out the significant the regulons (TFs) and the target genes of each regulon across cell types for different disease states |
| TF | Cell Type | Tissue | Disease Stage | Target Gene | RSS | Regulon Activity |
| ∗The dot plots of a searched regulon are shown for all cell subpopulations in each disease state of each tissue based on the regulon specific score inferred using pySCENIC and by calculating the average expression. |
| Page: 1 |
Top |
Somatic mutation of malignant transformation related genes |
| Annotation of somatic variants for genes involved in malignant transformation |
| Hugo Symbol | Variant Class | Variant Classification | dbSNP RS | HGVSc | HGVSp | HGVSp Short | SWISSPROT | BIOTYPE | SIFT | PolyPhen | Tumor Sample Barcode | Tissue | Histology | Sex | Age | Stage | Therapy Types | Drugs | Outcome |
| DPH6 | SNV | Missense_Mutation | c.274G>A | p.Glu92Lys | p.E92K | Q7L8W6 | protein_coding | deleterious(0) | probably_damaging(0.996) | TCGA-A8-A09I-01 | Breast | breast invasive carcinoma | Female | >=65 | I/II | Hormone Therapy | anastrozole | SD | |
| DPH6 | insertion | Frame_Shift_Ins | novel | c.770_771insTG | p.Tyr258AlafsTer31 | p.Y258Afs*31 | Q7L8W6 | protein_coding | TCGA-AR-A0TU-01 | Breast | breast invasive carcinoma | Female | <65 | I/II | Unspecific | Doxorubicin | SD | ||
| DPH6 | SNV | Missense_Mutation | c.431G>T | p.Arg144Ile | p.R144I | Q7L8W6 | protein_coding | deleterious(0) | benign(0.213) | TCGA-AA-3510-01 | Colorectum | colon adenocarcinoma | Male | >=65 | I/II | Unknown | Unknown | SD | |
| DPH6 | SNV | Missense_Mutation | c.431N>A | p.Arg144Lys | p.R144K | Q7L8W6 | protein_coding | tolerated(0.06) | benign(0.033) | TCGA-CA-6717-01 | Colorectum | colon adenocarcinoma | Male | <65 | I/II | Chemotherapy | oxaliplatin | CR | |
| DPH6 | SNV | Missense_Mutation | novel | c.199N>A | p.Leu67Ile | p.L67I | Q7L8W6 | protein_coding | tolerated(0.05) | benign(0.313) | TCGA-A5-A0G2-01 | Endometrium | uterine corpus endometrioid carcinoma | Female | <65 | III/IV | Unknown | Unknown | SD |
| DPH6 | SNV | Missense_Mutation | c.712N>A | p.Ala238Thr | p.A238T | Q7L8W6 | protein_coding | deleterious(0.03) | benign(0.196) | TCGA-AX-A0J1-01 | Endometrium | uterine corpus endometrioid carcinoma | Female | >=65 | I/II | Unknown | Unknown | SD | |
| DPH6 | SNV | Missense_Mutation | novel | c.374G>A | p.Arg125Gln | p.R125Q | Q7L8W6 | protein_coding | deleterious(0) | probably_damaging(0.999) | TCGA-AX-A2HC-01 | Endometrium | uterine corpus endometrioid carcinoma | Female | <65 | III/IV | Chemotherapy | paclitaxel | PD |
| DPH6 | SNV | Missense_Mutation | c.177C>A | p.Asp59Glu | p.D59E | Q7L8W6 | protein_coding | tolerated(1) | benign(0.003) | TCGA-B5-A0K9-01 | Endometrium | uterine corpus endometrioid carcinoma | Female | >=65 | I/II | Unknown | Unknown | SD | |
| DPH6 | SNV | Missense_Mutation | novel | c.23N>A | p.Ser8Asn | p.S8N | Q7L8W6 | protein_coding | deleterious(0) | probably_damaging(0.994) | TCGA-EY-A1GU-01 | Endometrium | uterine corpus endometrioid carcinoma | Female | >=65 | I/II | Unknown | Unknown | SD |
| DPH6 | SNV | Missense_Mutation | novel | c.253N>C | p.Tyr85His | p.Y85H | Q7L8W6 | protein_coding | deleterious(0) | probably_damaging(1) | TCGA-EY-A5W2-01 | Endometrium | uterine corpus endometrioid carcinoma | Female | >=65 | I/II | Unknown | Unknown | SD |
| Page: 1 2 3 |
Top |
Related drugs of malignant transformation related genes |
| Identification of chemicals and drugs interact with genes involved in malignant transfromation |
| (DGIdb 4.0) |
| Entrez ID | Symbol | Category | Interaction Types | Drug Claim Name | Drug Name | PMIDs |
| Page: 1 |

Copyright 2023-Present -The University of Texas Health Science Center at Houston |