
|
|||||
|
 | |
| |
| |
| |
| |
| |
|
Gene: DPH3 |
Gene summary for DPH3 |
| Gene information | Species | Human | Gene symbol | DPH3 | Gene ID | 285381 |
| Gene name | diphthamide biosynthesis 3 | |
| Gene Alias | DELGIP | |
| Cytomap | 3p25.1 | |
| Gene Type | protein-coding | GO ID | GO:0002097 | UniProtAcc | Q96FX2 |
Top |
Malignant transformation analysis |
| Identification of the aberrant gene expression in precancerous and cancerous lesions by comparing the gene expression of stem-like cells in diseased tissues with normal stem cells |
| Entrez ID | Symbol | Replicates | Species | Organ | Tissue | Adj P-value | Log2FC | Malignancy |
| 285381 | DPH3 | LZE4T | Human | Esophagus | ESCC | 7.54e-10 | 2.12e-01 | 0.0811 |
| 285381 | DPH3 | LZE8T | Human | Esophagus | ESCC | 5.40e-03 | -3.87e-02 | 0.067 |
| 285381 | DPH3 | LZE20T | Human | Esophagus | ESCC | 1.57e-06 | 4.55e-02 | 0.0662 |
| 285381 | DPH3 | LZE22T | Human | Esophagus | ESCC | 4.72e-03 | 1.68e-01 | 0.068 |
| 285381 | DPH3 | LZE24T | Human | Esophagus | ESCC | 6.69e-10 | 2.38e-01 | 0.0596 |
| 285381 | DPH3 | LZE6T | Human | Esophagus | ESCC | 1.24e-04 | 2.83e-01 | 0.0845 |
| 285381 | DPH3 | P1T-E | Human | Esophagus | ESCC | 1.05e-02 | 6.48e-02 | 0.0875 |
| 285381 | DPH3 | P2T-E | Human | Esophagus | ESCC | 4.77e-22 | 1.91e-01 | 0.1177 |
| 285381 | DPH3 | P4T-E | Human | Esophagus | ESCC | 3.54e-18 | 5.69e-01 | 0.1323 |
| 285381 | DPH3 | P5T-E | Human | Esophagus | ESCC | 5.82e-45 | 9.79e-01 | 0.1327 |
| 285381 | DPH3 | P8T-E | Human | Esophagus | ESCC | 1.08e-07 | 9.07e-02 | 0.0889 |
| 285381 | DPH3 | P9T-E | Human | Esophagus | ESCC | 1.12e-13 | 1.44e-01 | 0.1131 |
| 285381 | DPH3 | P10T-E | Human | Esophagus | ESCC | 4.61e-08 | 6.76e-02 | 0.116 |
| 285381 | DPH3 | P11T-E | Human | Esophagus | ESCC | 1.22e-12 | 4.02e-01 | 0.1426 |
| 285381 | DPH3 | P12T-E | Human | Esophagus | ESCC | 4.91e-14 | 2.57e-01 | 0.1122 |
| 285381 | DPH3 | P15T-E | Human | Esophagus | ESCC | 2.49e-08 | 8.44e-02 | 0.1149 |
| 285381 | DPH3 | P16T-E | Human | Esophagus | ESCC | 1.13e-14 | 1.06e-01 | 0.1153 |
| 285381 | DPH3 | P17T-E | Human | Esophagus | ESCC | 4.72e-05 | 2.48e-01 | 0.1278 |
| 285381 | DPH3 | P19T-E | Human | Esophagus | ESCC | 1.82e-05 | 7.25e-01 | 0.1662 |
| 285381 | DPH3 | P20T-E | Human | Esophagus | ESCC | 1.16e-20 | 3.95e-01 | 0.1124 |
| Page: 1 2 3 4 5 |
| Tissue | Expression Dynamics | Abbreviation |
| Esophagus |  | ESCC: Esophageal squamous cell carcinoma |
| HGIN: High-grade intraepithelial neoplasias | ||
| LGIN: Low-grade intraepithelial neoplasias | ||
| Liver | 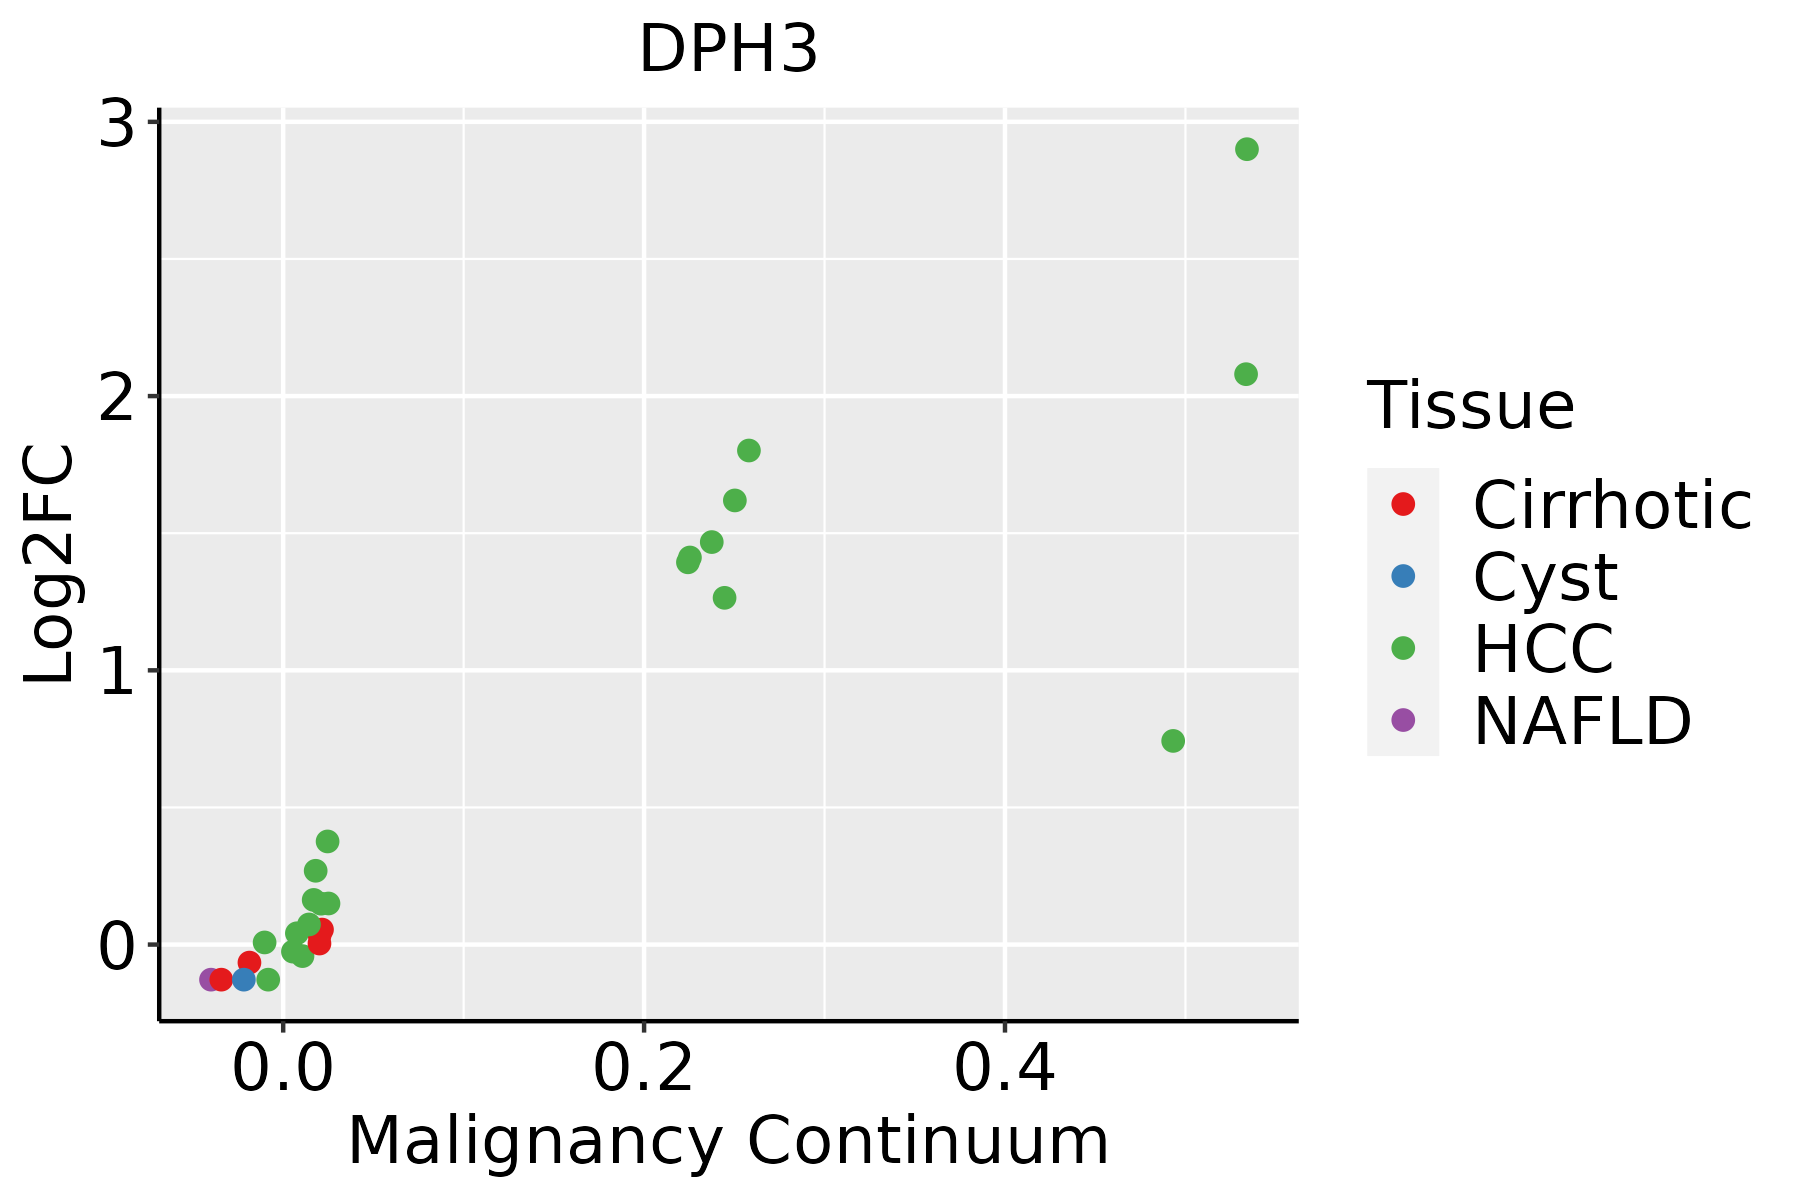 | HCC: Hepatocellular carcinoma |
| NAFLD: Non-alcoholic fatty liver disease | ||
| Oral Cavity | 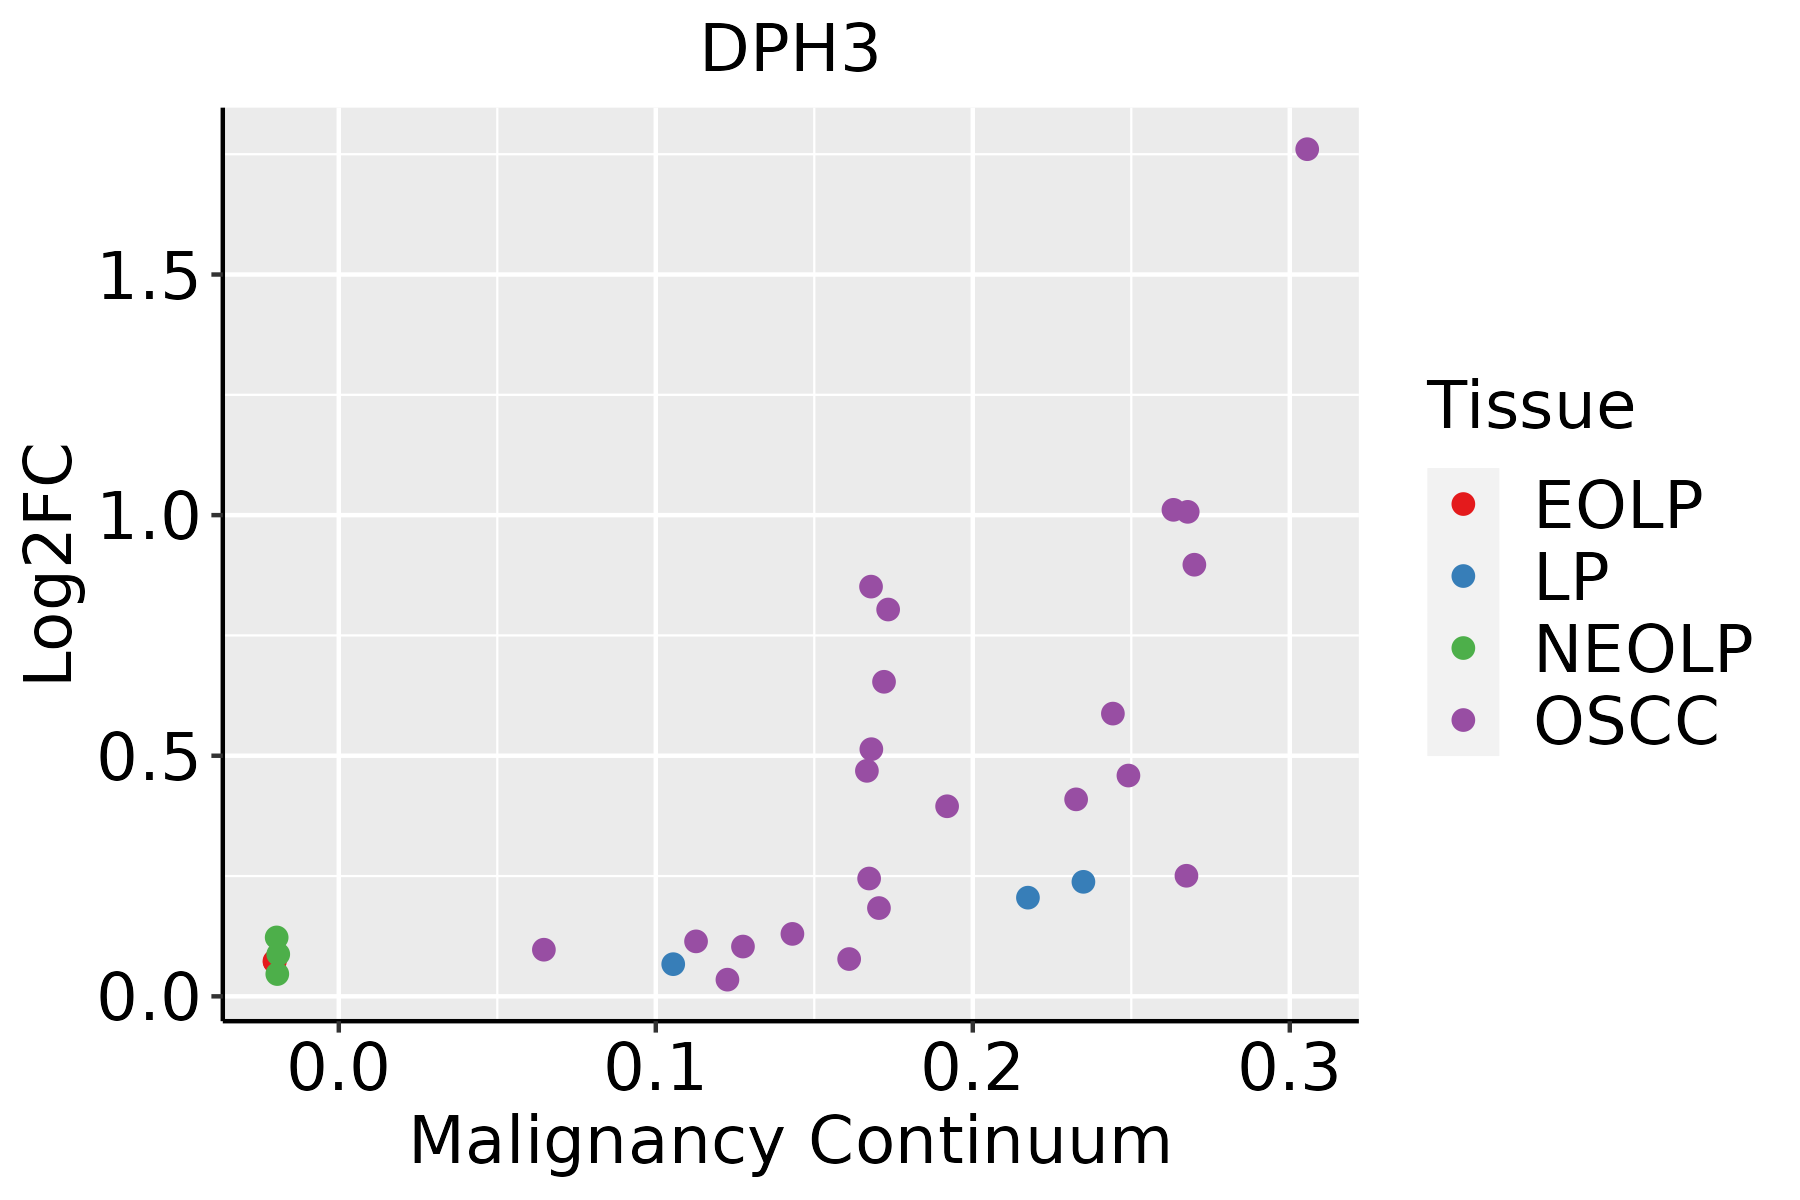 | EOLP: Erosive Oral lichen planus |
| LP: leukoplakia | ||
| NEOLP: Non-erosive oral lichen planus | ||
| OSCC: Oral squamous cell carcinoma | ||
| Skin |  | AK: Actinic keratosis |
| cSCC: Cutaneous squamous cell carcinoma | ||
| SCCIS:squamous cell carcinoma in situ |
| ∗log2FC in expression of this searched gene in stem-like cells from each diseased tissue sample relative to stem-like cells in normal samples in each tissue plotted against the malignancy continuum. Samples are colored based on if they are from different disease stage. |
Top |
Malignant transformation related pathway analysis |
| Find out the enriched GO biological processes and KEGG pathways involved in transition from healthy to precancer to cancer |
| Tissue | Disease Stage | Enriched GO biological Processes |
| Colorectum | AD |  |
| Colorectum | SER |  |
| Colorectum | MSS |  |
| Colorectum | MSI-H |  |
| Colorectum | FAP |  |
| ∗Top 15 enriched GO BP terms are showed in the bar plot of each disease state in each tissue. Each row represents a significant GO biological process which is colored according to the -log10(p.adjust). |
| Page: 1 2 3 4 5 6 7 8 9 |
| GO ID | Tissue | Disease Stage | Description | Gene Ratio | Bg Ratio | pvalue | p.adjust | Count |
| GO:003447015 | Esophagus | ESCC | ncRNA processing | 300/8552 | 395/18723 | 3.09e-35 | 3.26e-32 | 300 |
| GO:0002181111 | Esophagus | ESCC | cytoplasmic translation | 135/8552 | 148/18723 | 4.17e-32 | 2.65e-29 | 135 |
| GO:003466012 | Esophagus | ESCC | ncRNA metabolic process | 346/8552 | 485/18723 | 4.35e-31 | 2.51e-28 | 346 |
| GO:0051098111 | Esophagus | ESCC | regulation of binding | 251/8552 | 363/18723 | 6.73e-20 | 8.46e-18 | 251 |
| GO:0006417111 | Esophagus | ESCC | regulation of translation | 304/8552 | 468/18723 | 1.53e-17 | 1.33e-15 | 304 |
| GO:0051099111 | Esophagus | ESCC | positive regulation of binding | 122/8552 | 173/18723 | 2.79e-11 | 9.45e-10 | 122 |
| GO:00080333 | Esophagus | ESCC | tRNA processing | 92/8552 | 127/18723 | 7.83e-10 | 1.93e-08 | 92 |
| GO:00063992 | Esophagus | ESCC | tRNA metabolic process | 122/8552 | 179/18723 | 9.03e-10 | 2.19e-08 | 122 |
| GO:00094512 | Esophagus | ESCC | RNA modification | 114/8552 | 167/18723 | 2.76e-09 | 6.04e-08 | 114 |
| GO:00064002 | Esophagus | ESCC | tRNA modification | 62/8552 | 90/18723 | 7.02e-06 | 7.04e-05 | 62 |
| GO:000641419 | Esophagus | ESCC | translational elongation | 41/8552 | 55/18723 | 1.26e-05 | 1.16e-04 | 41 |
| GO:00512244 | Esophagus | ESCC | negative regulation of protein transport | 74/8552 | 127/18723 | 2.86e-03 | 1.21e-02 | 74 |
| GO:19049505 | Esophagus | ESCC | negative regulation of establishment of protein localization | 76/8552 | 131/18723 | 2.96e-03 | 1.24e-02 | 76 |
| GO:000930617 | Esophagus | ESCC | protein secretion | 190/8552 | 359/18723 | 3.22e-03 | 1.34e-02 | 190 |
| GO:003559217 | Esophagus | ESCC | establishment of protein localization to extracellular region | 190/8552 | 360/18723 | 3.77e-03 | 1.53e-02 | 190 |
| GO:007169210 | Esophagus | ESCC | protein localization to extracellular region | 193/8552 | 368/18723 | 5.01e-03 | 1.92e-02 | 193 |
| GO:005070810 | Esophagus | ESCC | regulation of protein secretion | 142/8552 | 268/18723 | 9.31e-03 | 3.24e-02 | 142 |
| GO:00344702 | Liver | HCC | ncRNA processing | 293/7958 | 395/18723 | 4.26e-38 | 6.76e-35 | 293 |
| GO:000218122 | Liver | HCC | cytoplasmic translation | 132/7958 | 148/18723 | 9.09e-33 | 5.76e-30 | 132 |
| GO:00346601 | Liver | HCC | ncRNA metabolic process | 332/7958 | 485/18723 | 1.48e-31 | 7.80e-29 | 332 |
| Page: 1 2 3 4 |
| Pathway ID | Tissue | Disease Stage | Description | Gene Ratio | Bg Ratio | pvalue | p.adjust | qvalue | Count |
| Page: 1 |
Top |
Cell-cell communication analysis |
| Identification of potential cell-cell interactions between two cell types and their ligand-receptor pairs for different disease states |
| Ligand | Receptor | LRpair | Pathway | Tissue | Disease Stage |
| Page: 1 |
Top |
Single-cell gene regulatory network inference analysis |
| Find out the significant the regulons (TFs) and the target genes of each regulon across cell types for different disease states |
| TF | Cell Type | Tissue | Disease Stage | Target Gene | RSS | Regulon Activity |
| ∗The dot plots of a searched regulon are shown for all cell subpopulations in each disease state of each tissue based on the regulon specific score inferred using pySCENIC and by calculating the average expression. |
| Page: 1 |
Top |
Somatic mutation of malignant transformation related genes |
| Annotation of somatic variants for genes involved in malignant transformation |
| Hugo Symbol | Variant Class | Variant Classification | dbSNP RS | HGVSc | HGVSp | HGVSp Short | SWISSPROT | BIOTYPE | SIFT | PolyPhen | Tumor Sample Barcode | Tissue | Histology | Sex | Age | Stage | Therapy Types | Drugs | Outcome |
| DPH3 | SNV | Missense_Mutation | c.31N>A | p.Glu11Lys | p.E11K | Q96FX2 | protein_coding | deleterious(0.04) | possibly_damaging(0.573) | TCGA-AC-A23H-01 | Breast | breast invasive carcinoma | Female | >=65 | I/II | Unknown | Unknown | PD | |
| DPH3 | SNV | Missense_Mutation | c.69C>A | p.Phe23Leu | p.F23L | Q96FX2 | protein_coding | tolerated(0.23) | benign(0.232) | TCGA-AA-A010-01 | Colorectum | colon adenocarcinoma | Female | <65 | I/II | Chemotherapy | folinic | CR | |
| DPH3 | insertion | In_Frame_Ins | novel | c.48_49insAACGGGAAA | p.Asp16_Glu17insAsnGlyLys | p.D16_E17insNGK | Q96FX2 | protein_coding | TCGA-AM-5820-01 | Colorectum | colon adenocarcinoma | Female | <65 | I/II | Unknown | Unknown | SD | ||
| DPH3 | SNV | Missense_Mutation | novel | c.115N>G | p.Leu39Val | p.L39V | Q96FX2 | protein_coding | deleterious(0) | probably_damaging(0.944) | TCGA-B5-A1MR-01 | Endometrium | uterine corpus endometrioid carcinoma | Female | >=65 | III/IV | Unknown | Unknown | SD |
| DPH3 | SNV | Missense_Mutation | novel | c.47A>G | p.Asp16Gly | p.D16G | Q96FX2 | protein_coding | deleterious(0) | probably_damaging(0.936) | TCGA-B5-A1MW-01 | Endometrium | uterine corpus endometrioid carcinoma | Female | <65 | I/II | Unknown | Unknown | PD |
| DPH3 | SNV | Missense_Mutation | novel | c.74C>G | p.Pro25Arg | p.P25R | Q96FX2 | protein_coding | deleterious(0) | probably_damaging(0.999) | TCGA-22-1002-01 | Lung | lung squamous cell carcinoma | Male | >=65 | I/II | Unknown | Unknown | SD |
| DPH3 | SNV | Missense_Mutation | novel | c.112G>A | p.Asp38Asn | p.D38N | Q96FX2 | protein_coding | tolerated(0.07) | possibly_damaging(0.784) | TCGA-KU-A6H7-01 | Oral cavity | head & neck squamous cell carcinoma | Female | <65 | I/II | Chemotherapy | cisplatin | CR |
| Page: 1 |
Top |
Related drugs of malignant transformation related genes |
| Identification of chemicals and drugs interact with genes involved in malignant transfromation |
| (DGIdb 4.0) |
| Entrez ID | Symbol | Category | Interaction Types | Drug Claim Name | Drug Name | PMIDs |
| Page: 1 |

Copyright 2023-Present -The University of Texas Health Science Center at Houston |