
|
|||||
|
 | |
| |
| |
| |
| |
| |
|
Gene: DPF2 |
Gene summary for DPF2 |
| Gene information | Species | Human | Gene symbol | DPF2 | Gene ID | 5977 |
| Gene name | double PHD fingers 2 | |
| Gene Alias | CSS7 | |
| Cytomap | 11q13.1 | |
| Gene Type | protein-coding | GO ID | GO:0000122 | UniProtAcc | J3KMZ8 |
Top |
Malignant transformation analysis |
| Identification of the aberrant gene expression in precancerous and cancerous lesions by comparing the gene expression of stem-like cells in diseased tissues with normal stem cells |
| Entrez ID | Symbol | Replicates | Species | Organ | Tissue | Adj P-value | Log2FC | Malignancy |
| 5977 | DPF2 | LZE2T | Human | Esophagus | ESCC | 3.93e-02 | 3.63e-01 | 0.082 |
| 5977 | DPF2 | LZE4T | Human | Esophagus | ESCC | 7.04e-15 | 4.47e-01 | 0.0811 |
| 5977 | DPF2 | LZE7T | Human | Esophagus | ESCC | 6.72e-11 | 4.40e-01 | 0.0667 |
| 5977 | DPF2 | LZE8T | Human | Esophagus | ESCC | 2.55e-09 | 3.63e-01 | 0.067 |
| 5977 | DPF2 | LZE20T | Human | Esophagus | ESCC | 1.40e-19 | 6.14e-01 | 0.0662 |
| 5977 | DPF2 | LZE22T | Human | Esophagus | ESCC | 5.13e-04 | 3.11e-01 | 0.068 |
| 5977 | DPF2 | LZE24T | Human | Esophagus | ESCC | 1.13e-28 | 7.09e-01 | 0.0596 |
| 5977 | DPF2 | LZE6T | Human | Esophagus | ESCC | 1.50e-05 | 3.31e-01 | 0.0845 |
| 5977 | DPF2 | P1T-E | Human | Esophagus | ESCC | 4.92e-04 | 2.96e-01 | 0.0875 |
| 5977 | DPF2 | P2T-E | Human | Esophagus | ESCC | 1.05e-43 | 6.67e-01 | 0.1177 |
| 5977 | DPF2 | P4T-E | Human | Esophagus | ESCC | 1.68e-43 | 9.07e-01 | 0.1323 |
| 5977 | DPF2 | P5T-E | Human | Esophagus | ESCC | 2.10e-19 | 2.91e-01 | 0.1327 |
| 5977 | DPF2 | P8T-E | Human | Esophagus | ESCC | 1.83e-42 | 6.85e-01 | 0.0889 |
| 5977 | DPF2 | P9T-E | Human | Esophagus | ESCC | 6.31e-13 | 3.39e-01 | 0.1131 |
| 5977 | DPF2 | P10T-E | Human | Esophagus | ESCC | 2.43e-54 | 8.55e-01 | 0.116 |
| 5977 | DPF2 | P11T-E | Human | Esophagus | ESCC | 1.55e-18 | 6.54e-01 | 0.1426 |
| 5977 | DPF2 | P12T-E | Human | Esophagus | ESCC | 1.29e-55 | 9.74e-01 | 0.1122 |
| 5977 | DPF2 | P15T-E | Human | Esophagus | ESCC | 7.79e-34 | 7.93e-01 | 0.1149 |
| 5977 | DPF2 | P16T-E | Human | Esophagus | ESCC | 8.10e-61 | 9.95e-01 | 0.1153 |
| 5977 | DPF2 | P17T-E | Human | Esophagus | ESCC | 5.68e-16 | 5.46e-01 | 0.1278 |
| Page: 1 2 3 4 5 6 |
| Tissue | Expression Dynamics | Abbreviation |
| Esophagus | 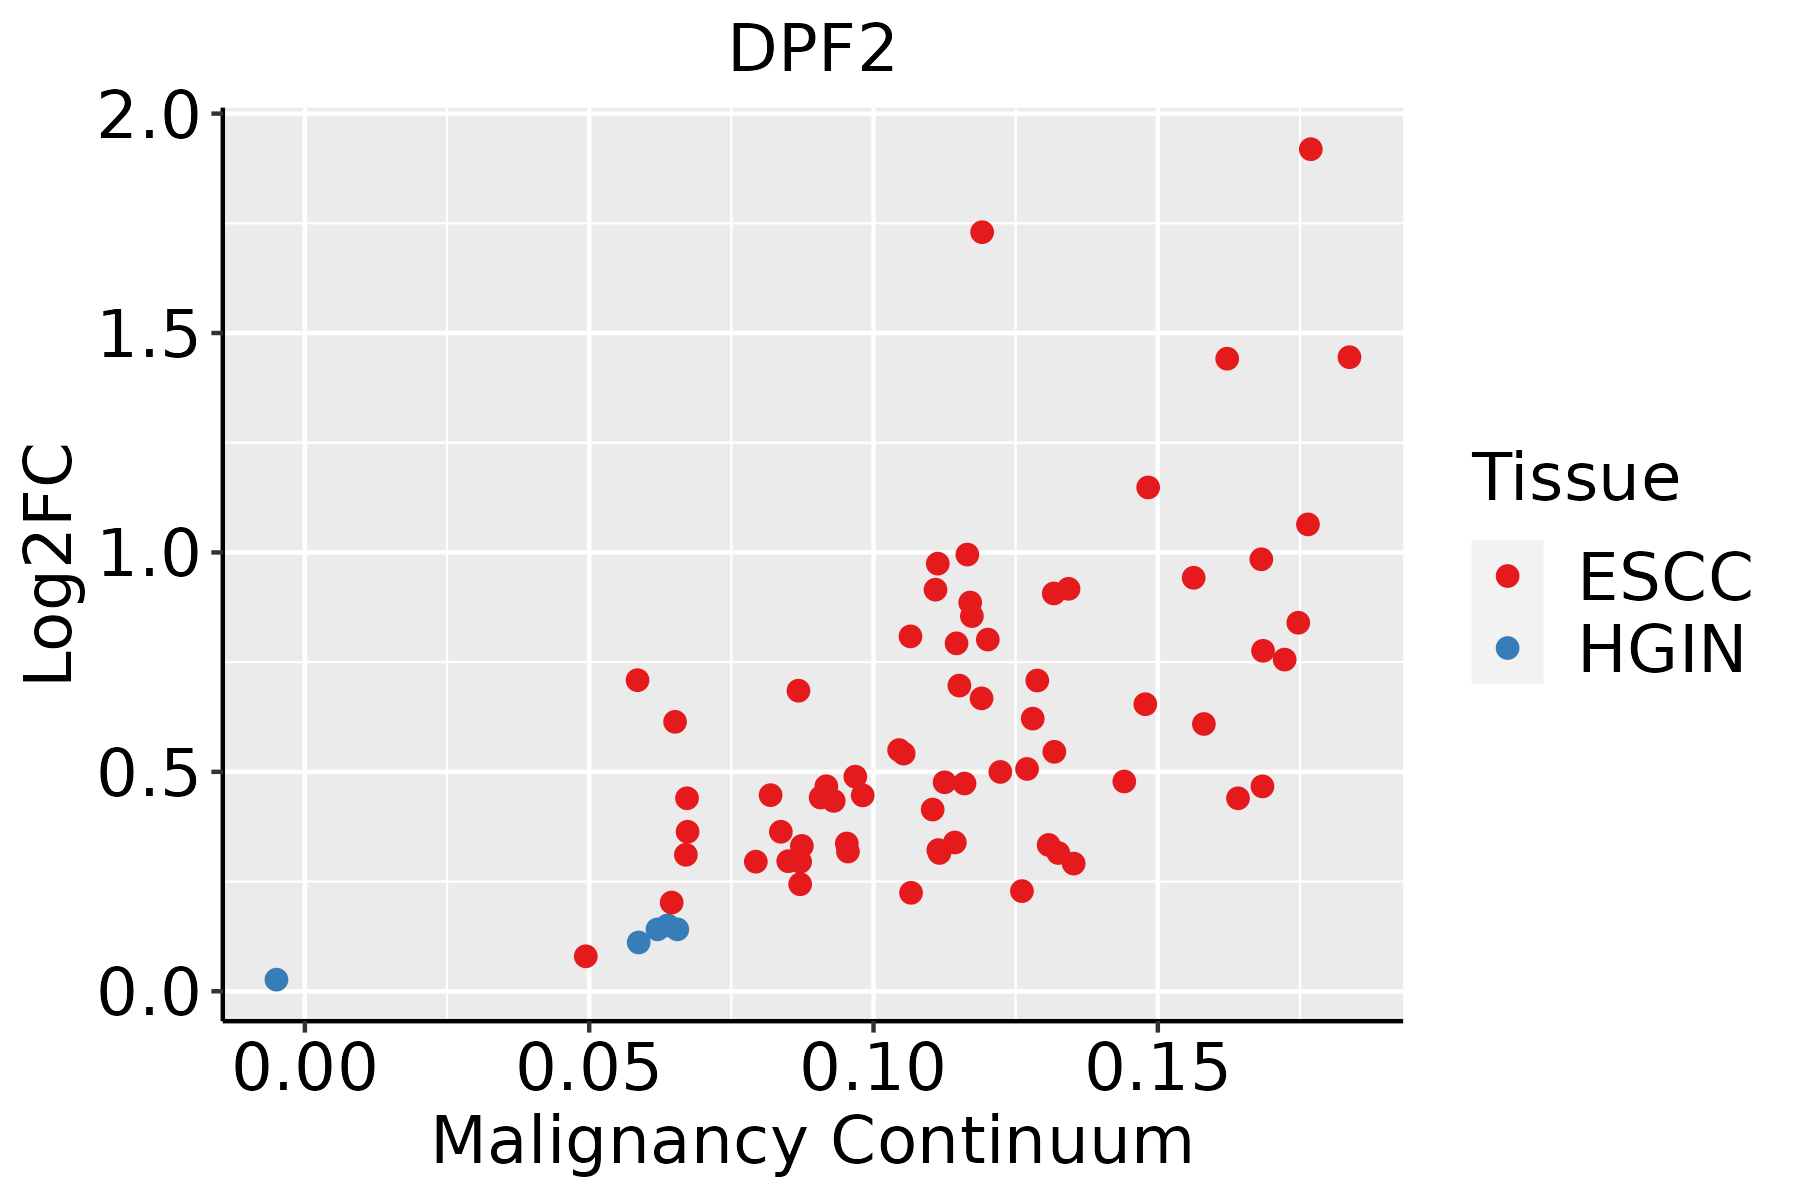 | ESCC: Esophageal squamous cell carcinoma |
| HGIN: High-grade intraepithelial neoplasias | ||
| LGIN: Low-grade intraepithelial neoplasias | ||
| Liver | 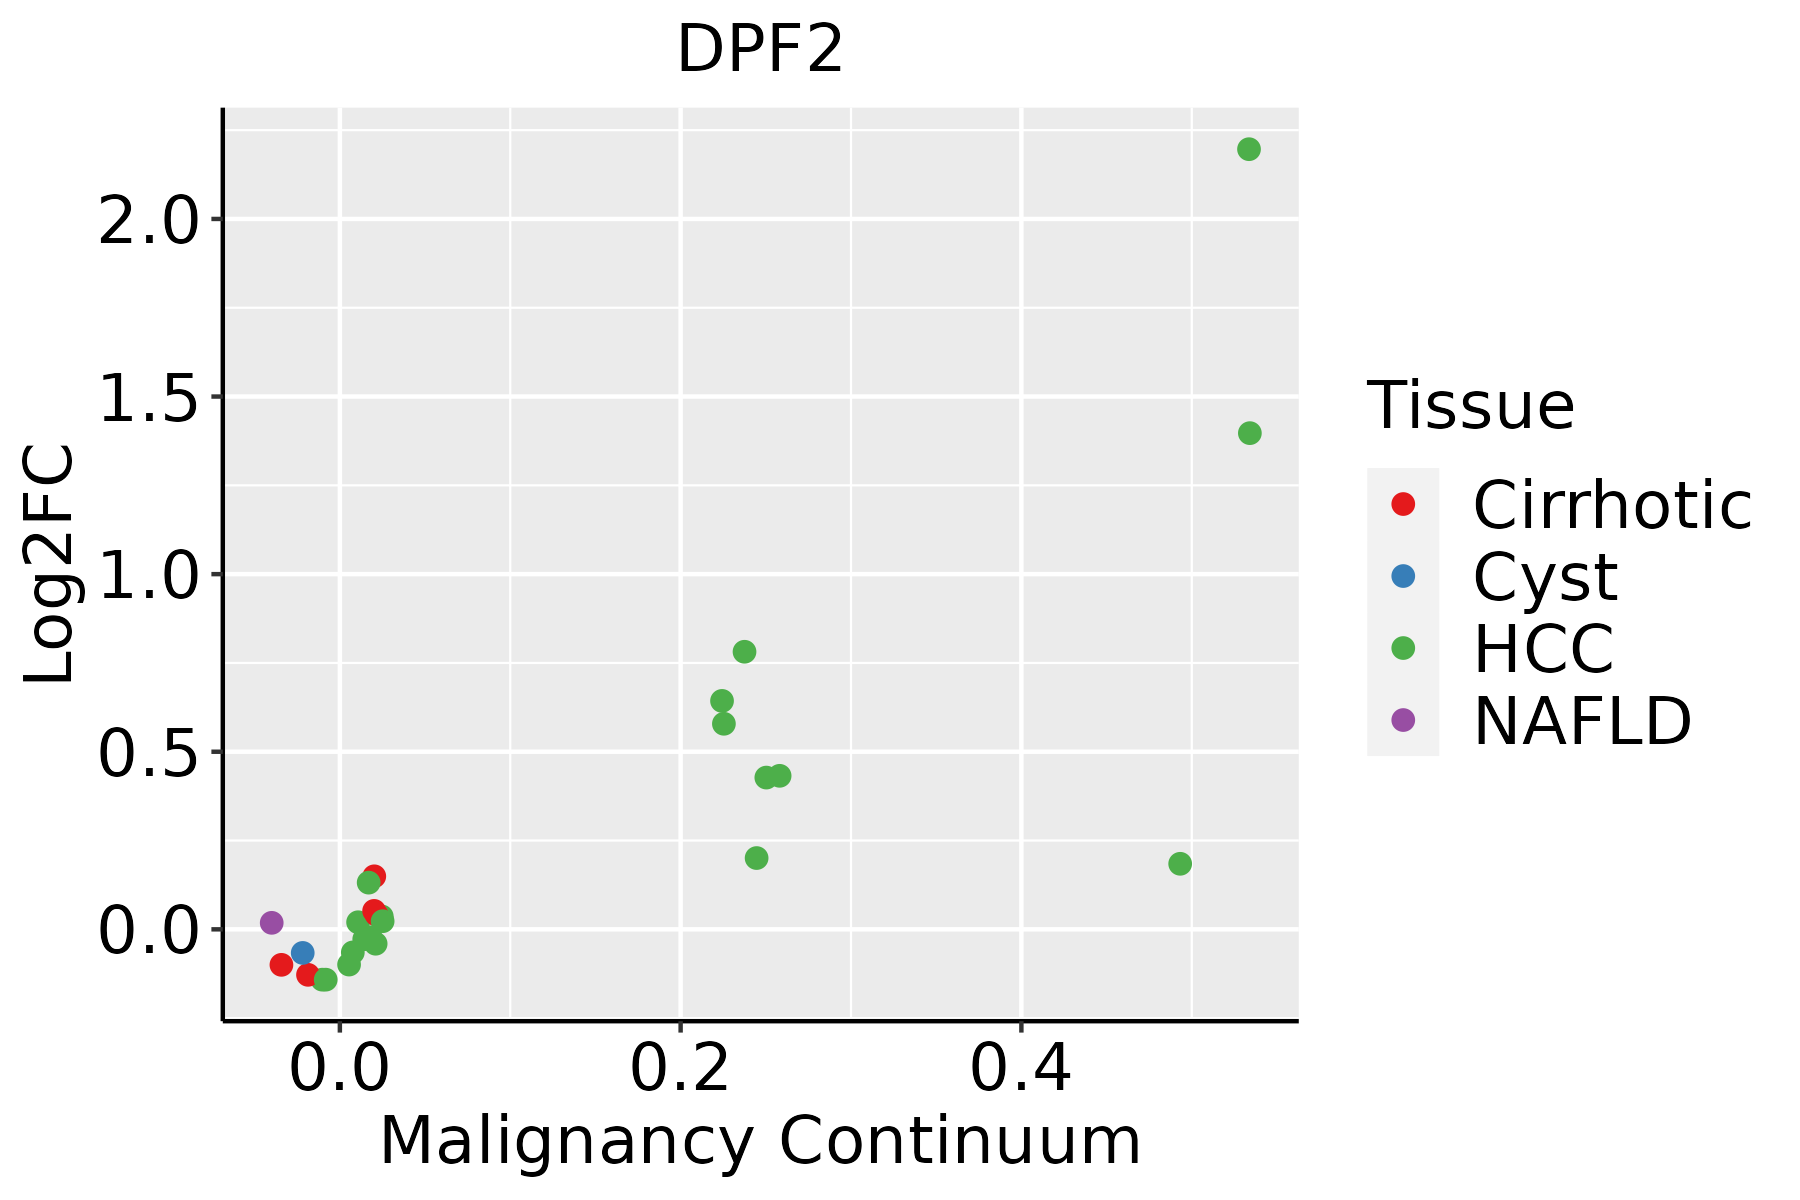 | HCC: Hepatocellular carcinoma |
| NAFLD: Non-alcoholic fatty liver disease | ||
| Oral Cavity | 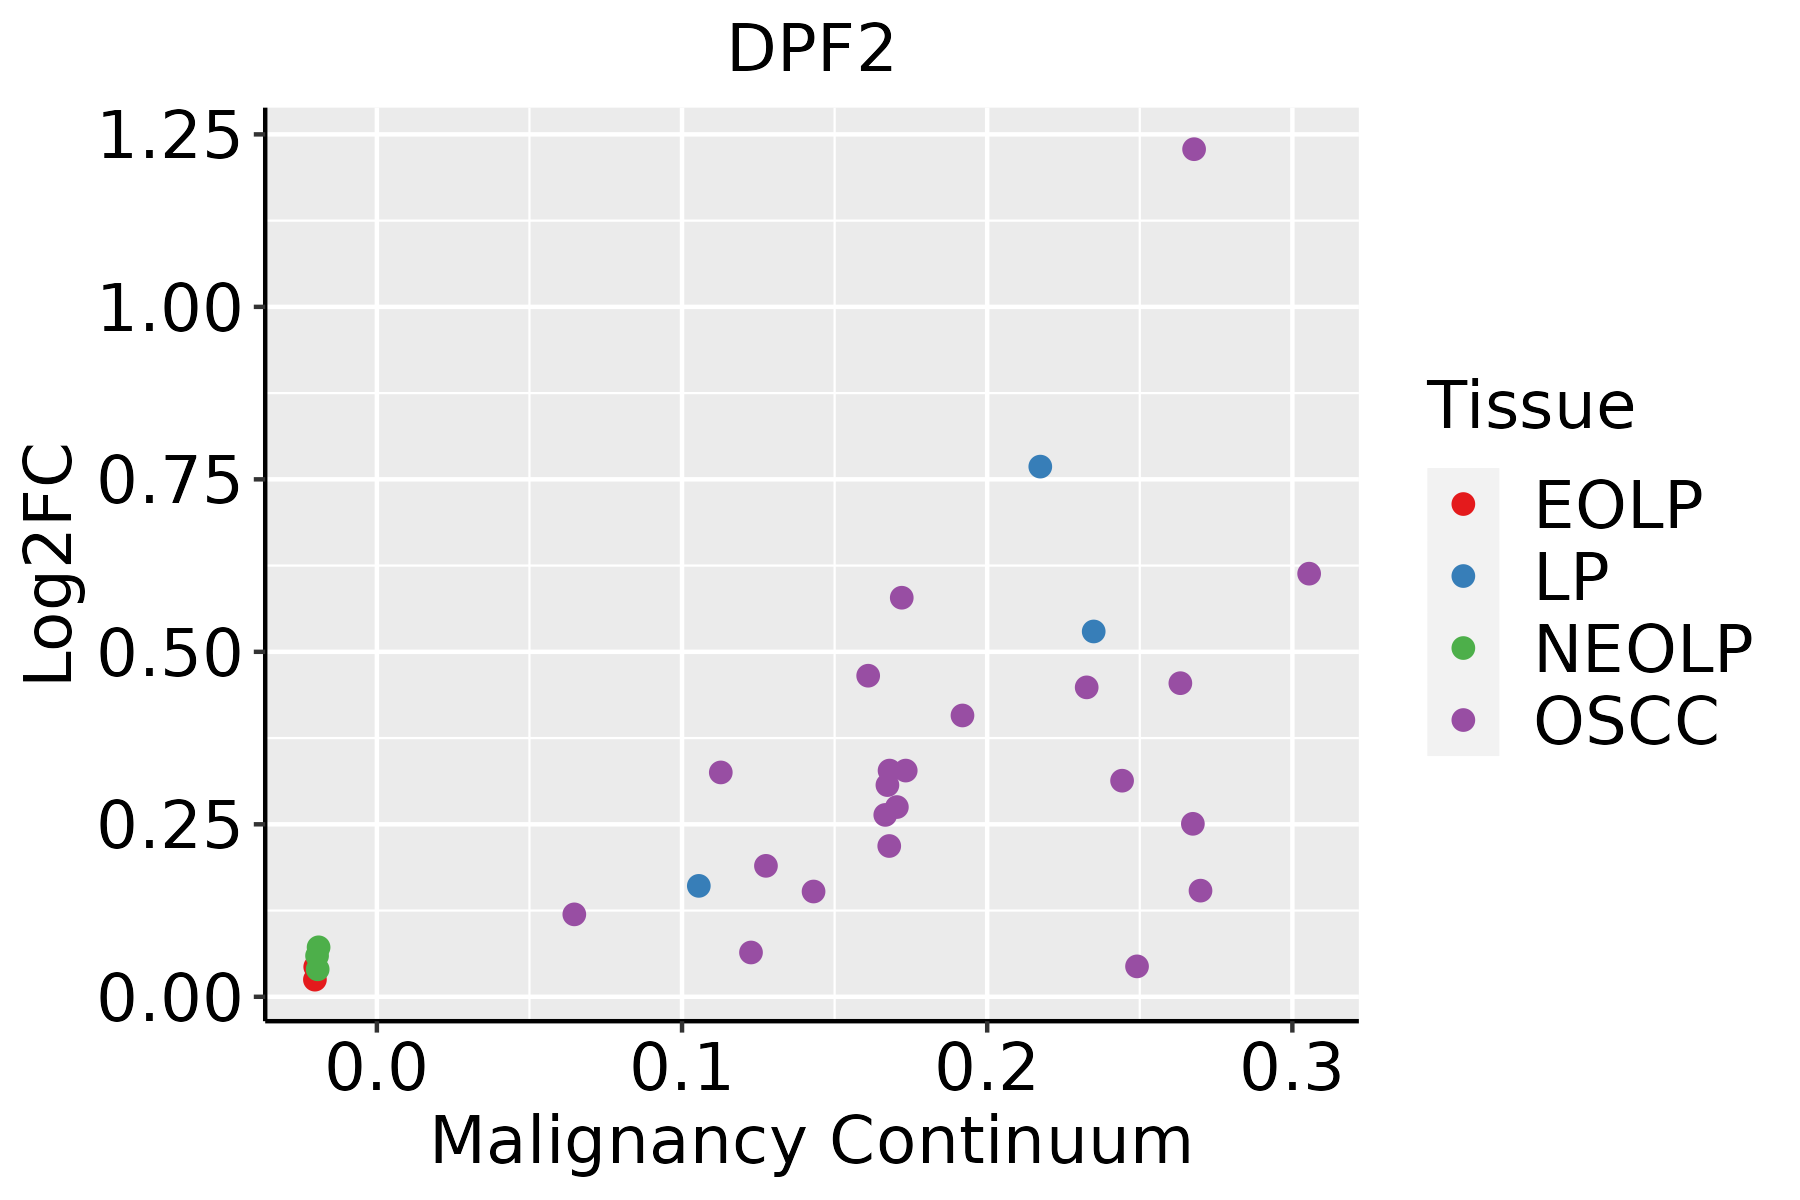 | EOLP: Erosive Oral lichen planus |
| LP: leukoplakia | ||
| NEOLP: Non-erosive oral lichen planus | ||
| OSCC: Oral squamous cell carcinoma | ||
| Thyroid | 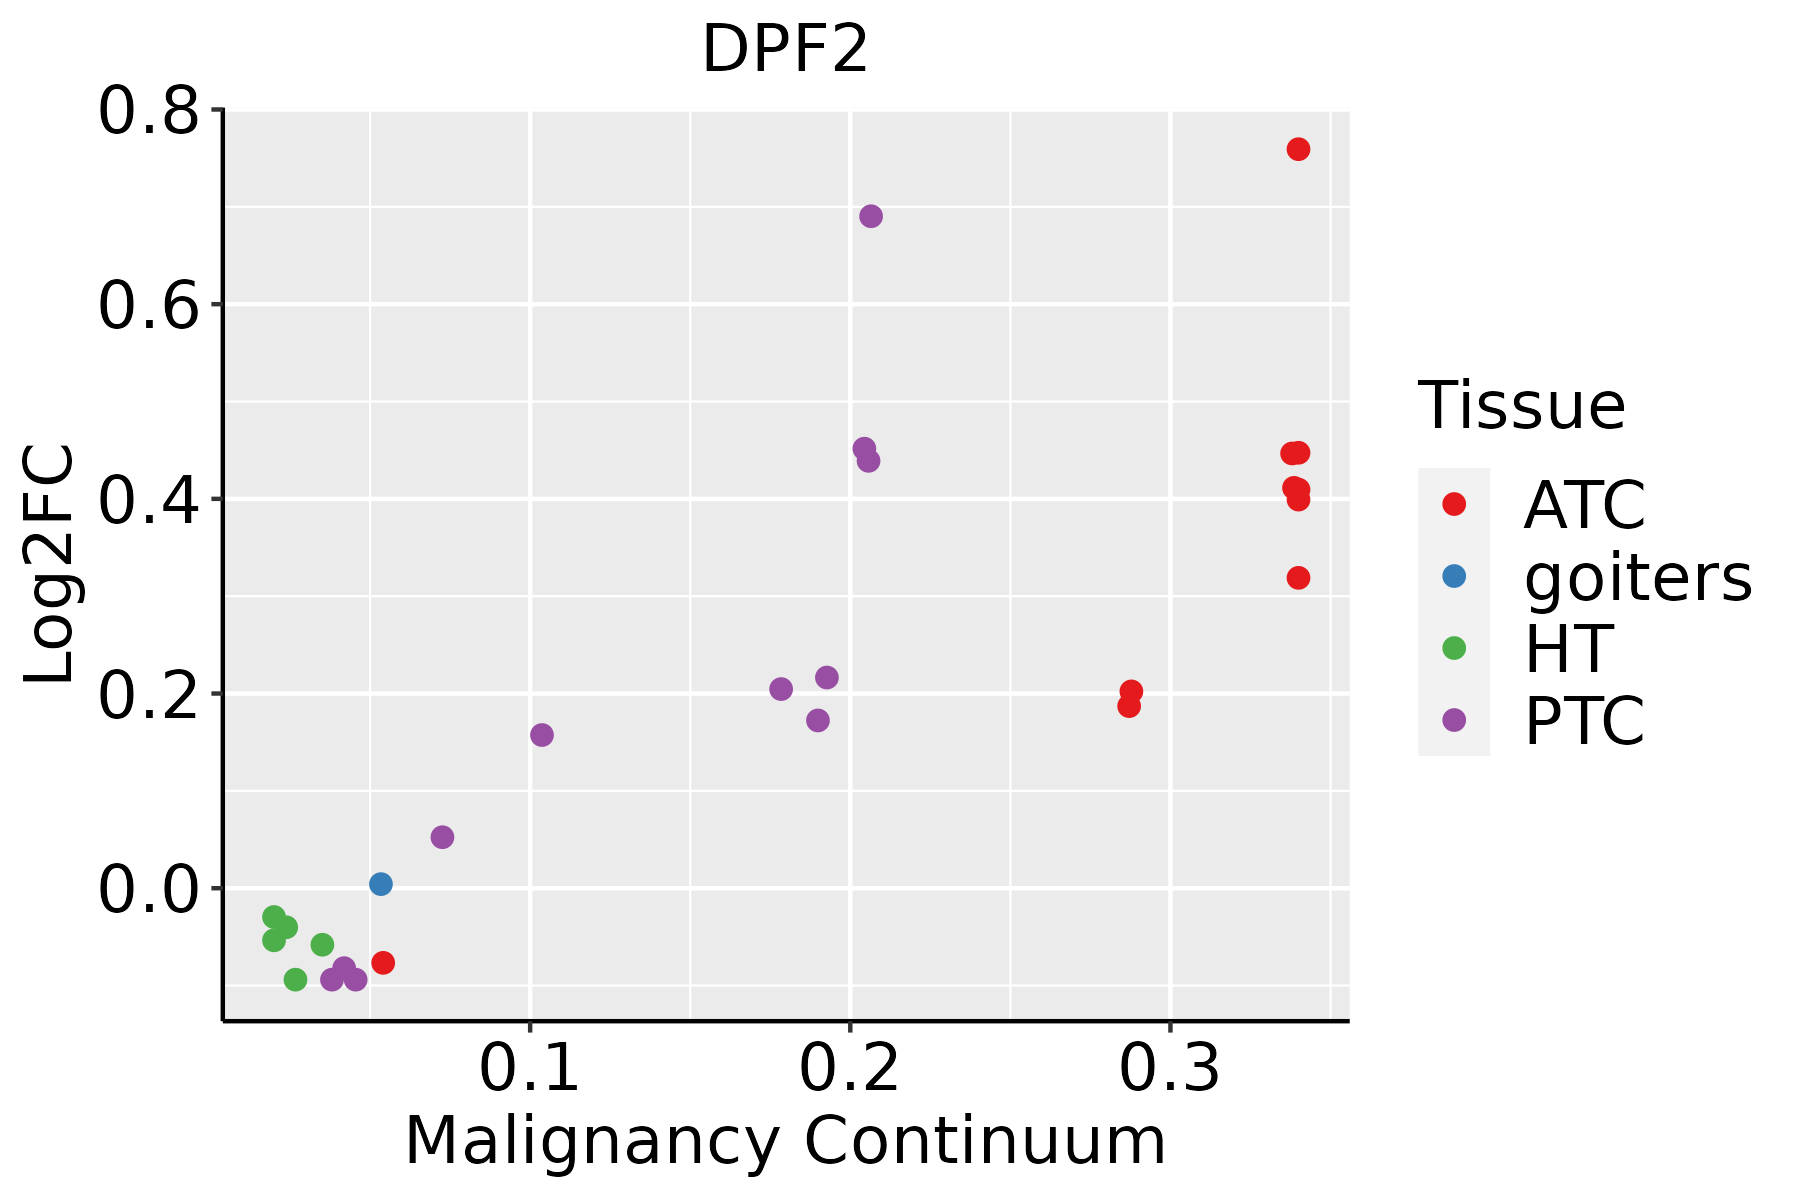 | ATC: Anaplastic thyroid cancer |
| HT: Hashimoto's thyroiditis | ||
| PTC: Papillary thyroid cancer |
| ∗log2FC in expression of this searched gene in stem-like cells from each diseased tissue sample relative to stem-like cells in normal samples in each tissue plotted against the malignancy continuum. Samples are colored based on if they are from different disease stage. |
Top |
Malignant transformation related pathway analysis |
| Find out the enriched GO biological processes and KEGG pathways involved in transition from healthy to precancer to cancer |
| Tissue | Disease Stage | Enriched GO biological Processes |
| Colorectum | AD |  |
| Colorectum | SER |  |
| Colorectum | MSS |  |
| Colorectum | MSI-H |  |
| Colorectum | FAP |  |
| ∗Top 15 enriched GO BP terms are showed in the bar plot of each disease state in each tissue. Each row represents a significant GO biological process which is colored according to the -log10(p.adjust). |
| Page: 1 2 3 4 5 6 7 8 9 |
| GO ID | Tissue | Disease Stage | Description | Gene Ratio | Bg Ratio | pvalue | p.adjust | Count |
| GO:000632517 | Esophagus | ESCC | chromatin organization | 240/8552 | 409/18723 | 6.52e-08 | 1.14e-06 | 240 |
| GO:00022446 | Esophagus | ESCC | hematopoietic progenitor cell differentiation | 66/8552 | 114/18723 | 5.74e-03 | 2.13e-02 | 66 |
| GO:000632511 | Liver | HCC | chromatin organization | 206/7958 | 409/18723 | 7.23e-04 | 4.41e-03 | 206 |
| GO:000632510 | Oral cavity | OSCC | chromatin organization | 190/7305 | 409/18723 | 1.17e-03 | 5.97e-03 | 190 |
| GO:00022445 | Oral cavity | OSCC | hematopoietic progenitor cell differentiation | 57/7305 | 114/18723 | 1.09e-02 | 3.71e-02 | 57 |
| GO:000632520 | Thyroid | PTC | chromatin organization | 183/5968 | 409/18723 | 2.55e-08 | 5.70e-07 | 183 |
| GO:19015325 | Thyroid | PTC | regulation of hematopoietic progenitor cell differentiation | 18/5968 | 32/18723 | 3.72e-03 | 1.79e-02 | 18 |
| GO:0006325110 | Thyroid | ATC | chromatin organization | 189/6293 | 409/18723 | 6.40e-08 | 1.13e-06 | 189 |
| GO:190153212 | Thyroid | ATC | regulation of hematopoietic progenitor cell differentiation | 19/6293 | 32/18723 | 2.46e-03 | 1.14e-02 | 19 |
| GO:00022448 | Thyroid | ATC | hematopoietic progenitor cell differentiation | 51/6293 | 114/18723 | 8.62e-03 | 3.28e-02 | 51 |
| Page: 1 |
| Pathway ID | Tissue | Disease Stage | Description | Gene Ratio | Bg Ratio | pvalue | p.adjust | qvalue | Count |
| Page: 1 |
Top |
Cell-cell communication analysis |
| Identification of potential cell-cell interactions between two cell types and their ligand-receptor pairs for different disease states |
| Ligand | Receptor | LRpair | Pathway | Tissue | Disease Stage |
| Page: 1 |
Top |
Single-cell gene regulatory network inference analysis |
| Find out the significant the regulons (TFs) and the target genes of each regulon across cell types for different disease states |
| TF | Cell Type | Tissue | Disease Stage | Target Gene | RSS | Regulon Activity |
| ∗The dot plots of a searched regulon are shown for all cell subpopulations in each disease state of each tissue based on the regulon specific score inferred using pySCENIC and by calculating the average expression. |
| Page: 1 |
Top |
Somatic mutation of malignant transformation related genes |
| Annotation of somatic variants for genes involved in malignant transformation |
| Hugo Symbol | Variant Class | Variant Classification | dbSNP RS | HGVSc | HGVSp | HGVSp Short | SWISSPROT | BIOTYPE | SIFT | PolyPhen | Tumor Sample Barcode | Tissue | Histology | Sex | Age | Stage | Therapy Types | Drugs | Outcome |
| DPF2 | SNV | Missense_Mutation | c.385G>C | p.Glu129Gln | p.E129Q | protein_coding | tolerated(0.08) | possibly_damaging(0.617) | TCGA-AC-A23H-01 | Breast | breast invasive carcinoma | Female | >=65 | I/II | Unknown | Unknown | PD | ||
| DPF2 | SNV | Missense_Mutation | novel | c.675G>C | p.Gln225His | p.Q225H | protein_coding | tolerated_low_confidence(0.08) | benign(0) | TCGA-IR-A3LA-01 | Cervix | cervical & endocervical cancer | Female | <65 | I/II | Chemotherapy | cisplatin | CR | |
| DPF2 | SNV | Missense_Mutation | c.803C>A | p.Ser268Tyr | p.S268Y | protein_coding | deleterious(0.01) | possibly_damaging(0.851) | TCGA-A6-5661-01 | Colorectum | colon adenocarcinoma | Female | >=65 | I/II | Unknown | Unknown | SD | ||
| DPF2 | SNV | Missense_Mutation | c.941N>C | p.Arg314Pro | p.R314P | protein_coding | deleterious(0) | benign(0.003) | TCGA-AA-3506-01 | Colorectum | colon adenocarcinoma | Male | >=65 | I/II | Unknown | Unknown | SD | ||
| DPF2 | SNV | Missense_Mutation | c.1001N>G | p.Tyr334Cys | p.Y334C | protein_coding | deleterious(0) | probably_damaging(0.975) | TCGA-NH-A5IV-01 | Colorectum | colon adenocarcinoma | Female | >=65 | I/II | Unknown | Unknown | SD | ||
| DPF2 | SNV | Missense_Mutation | c.949C>T | p.His317Tyr | p.H317Y | protein_coding | deleterious(0.01) | possibly_damaging(0.856) | TCGA-AG-3902-01 | Colorectum | rectum adenocarcinoma | Male | <65 | I/II | Unknown | Unknown | SD | ||
| DPF2 | SNV | Missense_Mutation | c.1153T>A | p.Cys385Ser | p.C385S | protein_coding | deleterious(0) | probably_damaging(1) | TCGA-AG-A01Y-01 | Colorectum | rectum adenocarcinoma | Female | <65 | I/II | Chemotherapy | 5-fluorouracil | CR | ||
| DPF2 | SNV | Missense_Mutation | c.535N>T | p.Arg179Cys | p.R179C | protein_coding | deleterious(0) | probably_damaging(0.969) | TCGA-EI-6882-01 | Colorectum | rectum adenocarcinoma | Male | <65 | I/II | Unknown | Unknown | SD | ||
| DPF2 | SNV | Missense_Mutation | novel | c.785C>T | p.Thr262Ile | p.T262I | protein_coding | tolerated(0.15) | probably_damaging(0.937) | TCGA-A5-A0G1-01 | Endometrium | uterine corpus endometrioid carcinoma | Female | >=65 | I/II | Unknown | Unknown | SD | |
| DPF2 | SNV | Missense_Mutation | rs760880895 | c.113N>A | p.Arg38His | p.R38H | protein_coding | deleterious(0) | probably_damaging(0.979) | TCGA-A5-A0G2-01 | Endometrium | uterine corpus endometrioid carcinoma | Female | <65 | III/IV | Unknown | Unknown | SD |
| Page: 1 2 3 4 |
Top |
Related drugs of malignant transformation related genes |
| Identification of chemicals and drugs interact with genes involved in malignant transfromation |
| (DGIdb 4.0) |
| Entrez ID | Symbol | Category | Interaction Types | Drug Claim Name | Drug Name | PMIDs |
| Page: 1 |

Copyright 2023-Present -The University of Texas Health Science Center at Houston |