
|
|||||
|
 | |
| |
| |
| |
| |
| |
|
Gene: DPCD |
Gene summary for DPCD |
| Gene information | Species | Human | Gene symbol | DPCD | Gene ID | 25911 |
| Gene name | deleted in primary ciliary dyskinesia homolog (mouse) | |
| Gene Alias | DPCD | |
| Cytomap | 10q24.32 | |
| Gene Type | protein-coding | GO ID | GO:0000003 | UniProtAcc | Q5JQQ4 |
Top |
Malignant transformation analysis |
| Identification of the aberrant gene expression in precancerous and cancerous lesions by comparing the gene expression of stem-like cells in diseased tissues with normal stem cells |
| Entrez ID | Symbol | Replicates | Species | Organ | Tissue | Adj P-value | Log2FC | Malignancy |
| 25911 | DPCD | LZE4T | Human | Esophagus | ESCC | 4.88e-02 | 1.43e-01 | 0.0811 |
| 25911 | DPCD | LZE24T | Human | Esophagus | ESCC | 2.43e-10 | 4.35e-01 | 0.0596 |
| 25911 | DPCD | P1T-E | Human | Esophagus | ESCC | 2.75e-04 | 2.81e-01 | 0.0875 |
| 25911 | DPCD | P2T-E | Human | Esophagus | ESCC | 1.41e-36 | 6.40e-01 | 0.1177 |
| 25911 | DPCD | P4T-E | Human | Esophagus | ESCC | 6.40e-29 | 6.74e-01 | 0.1323 |
| 25911 | DPCD | P5T-E | Human | Esophagus | ESCC | 2.41e-39 | 7.22e-01 | 0.1327 |
| 25911 | DPCD | P8T-E | Human | Esophagus | ESCC | 1.06e-16 | 2.56e-01 | 0.0889 |
| 25911 | DPCD | P9T-E | Human | Esophagus | ESCC | 6.45e-07 | 1.13e-01 | 0.1131 |
| 25911 | DPCD | P10T-E | Human | Esophagus | ESCC | 1.43e-09 | 1.70e-01 | 0.116 |
| 25911 | DPCD | P11T-E | Human | Esophagus | ESCC | 3.55e-10 | 3.40e-01 | 0.1426 |
| 25911 | DPCD | P12T-E | Human | Esophagus | ESCC | 3.92e-13 | 2.74e-01 | 0.1122 |
| 25911 | DPCD | P15T-E | Human | Esophagus | ESCC | 2.52e-13 | 3.02e-01 | 0.1149 |
| 25911 | DPCD | P16T-E | Human | Esophagus | ESCC | 7.24e-26 | 5.61e-01 | 0.1153 |
| 25911 | DPCD | P17T-E | Human | Esophagus | ESCC | 1.27e-09 | 3.66e-01 | 0.1278 |
| 25911 | DPCD | P19T-E | Human | Esophagus | ESCC | 4.00e-05 | 5.23e-01 | 0.1662 |
| 25911 | DPCD | P20T-E | Human | Esophagus | ESCC | 9.42e-11 | 2.70e-01 | 0.1124 |
| 25911 | DPCD | P21T-E | Human | Esophagus | ESCC | 3.08e-23 | 4.46e-01 | 0.1617 |
| 25911 | DPCD | P22T-E | Human | Esophagus | ESCC | 1.83e-19 | 2.86e-01 | 0.1236 |
| 25911 | DPCD | P23T-E | Human | Esophagus | ESCC | 1.25e-21 | 5.60e-01 | 0.108 |
| 25911 | DPCD | P24T-E | Human | Esophagus | ESCC | 1.62e-14 | 2.80e-01 | 0.1287 |
| Page: 1 2 3 4 5 |
| Tissue | Expression Dynamics | Abbreviation |
| Esophagus | 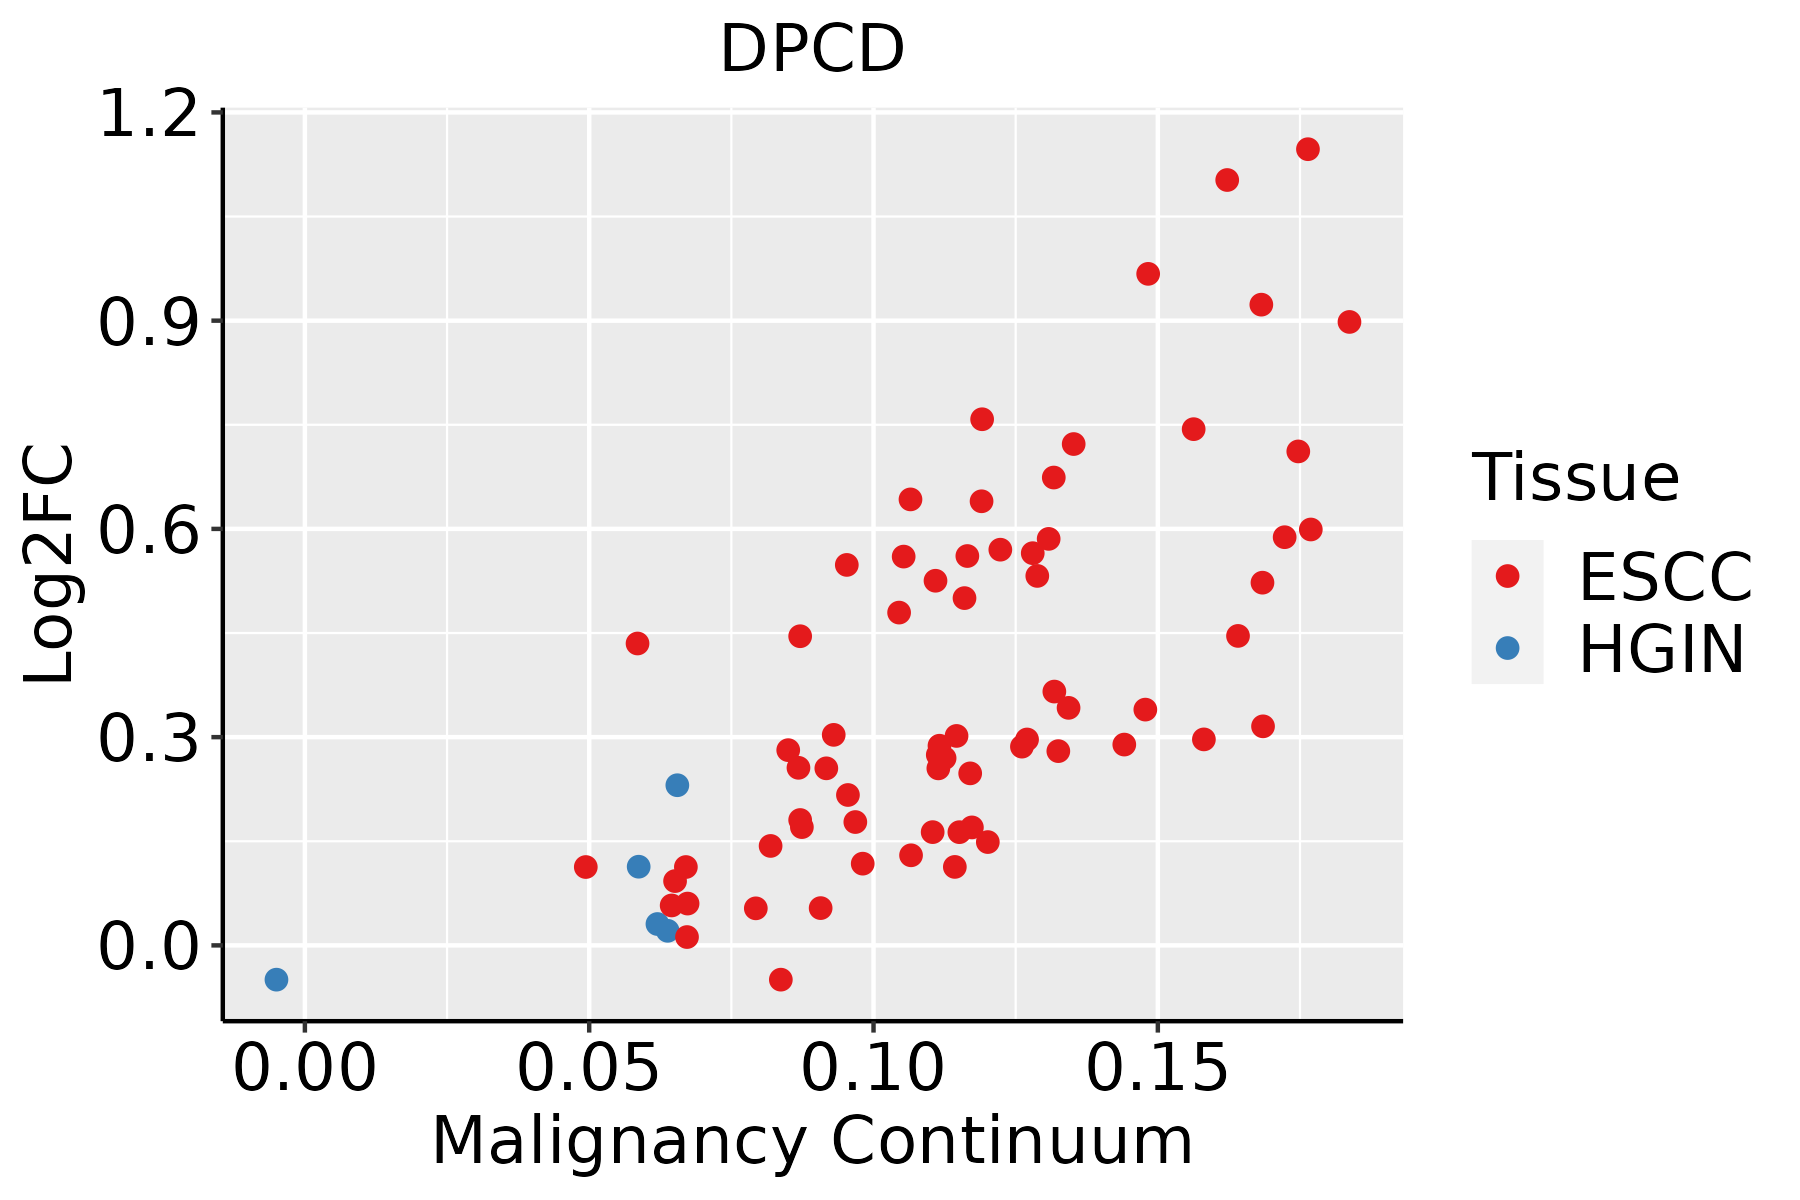 | ESCC: Esophageal squamous cell carcinoma |
| HGIN: High-grade intraepithelial neoplasias | ||
| LGIN: Low-grade intraepithelial neoplasias | ||
| Liver | 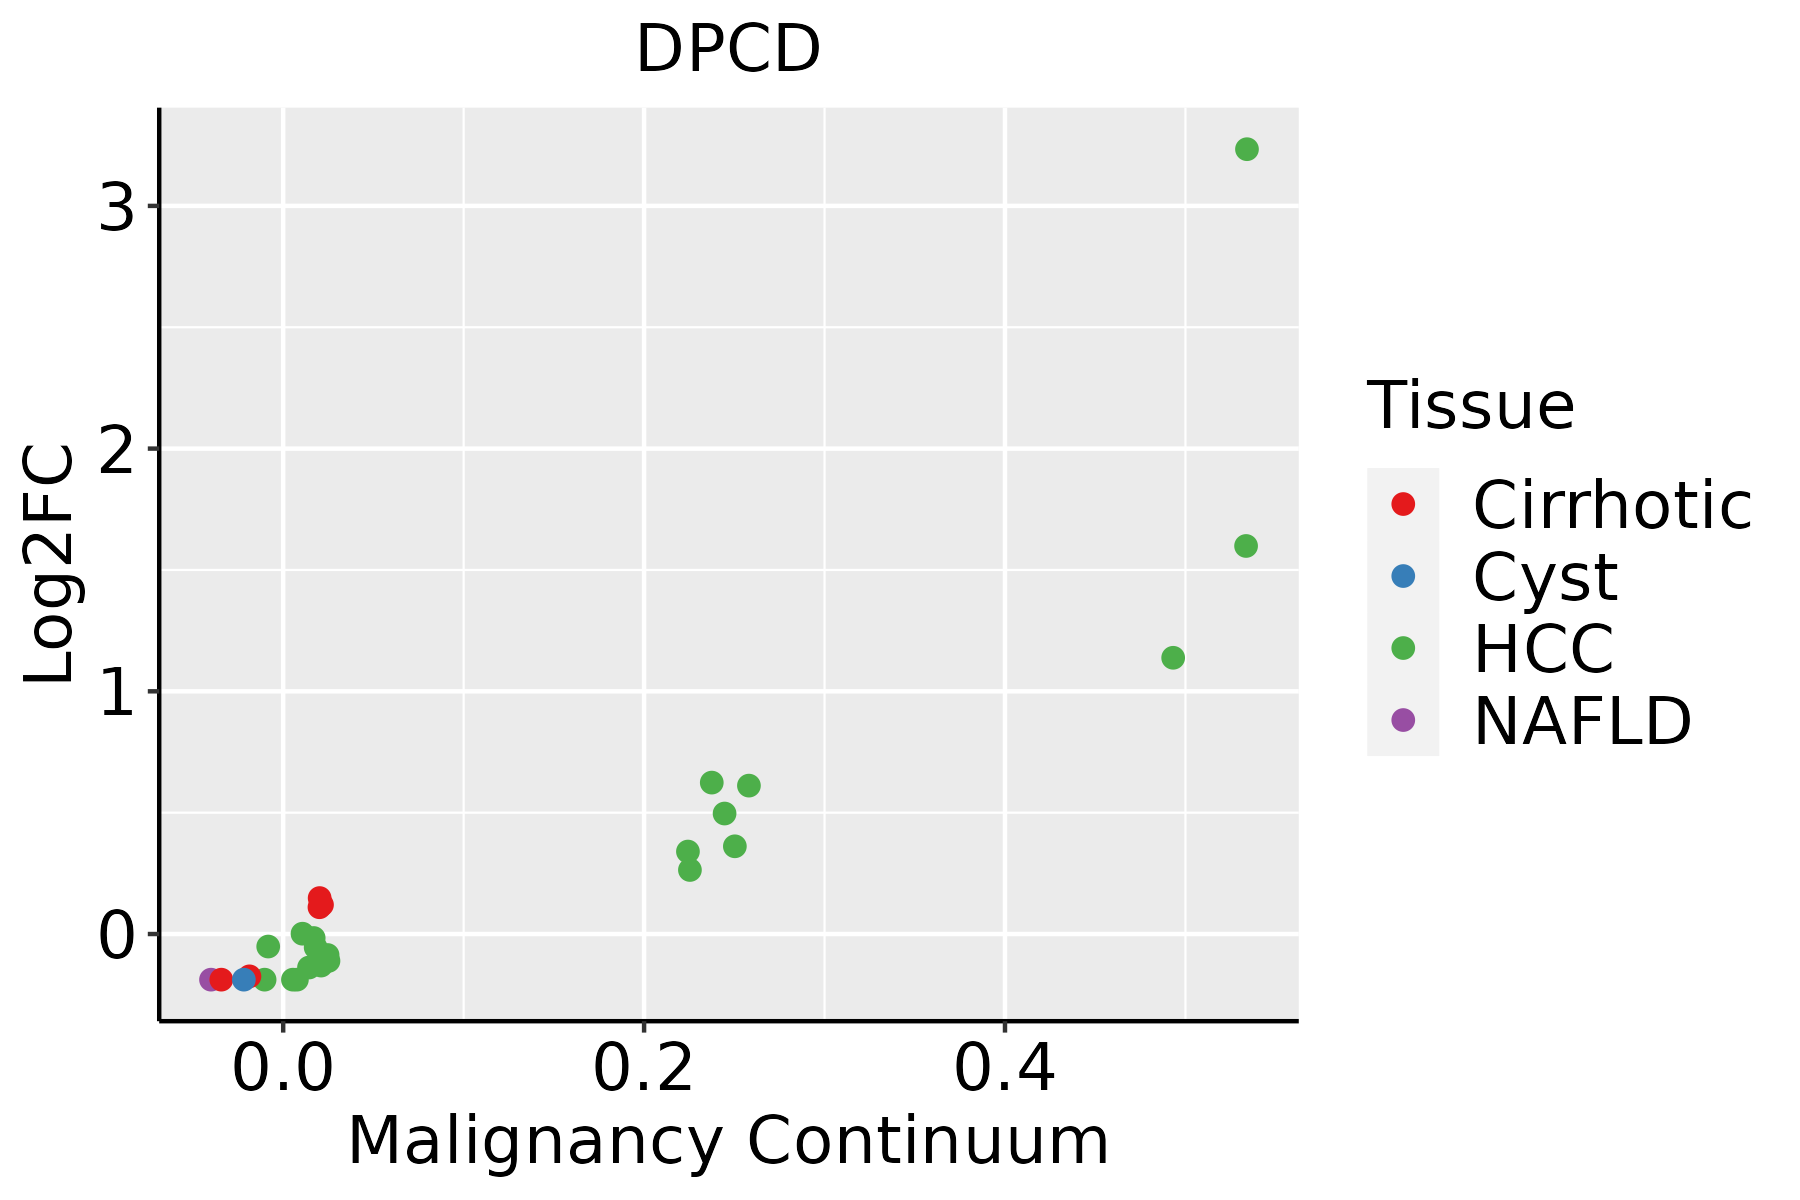 | HCC: Hepatocellular carcinoma |
| NAFLD: Non-alcoholic fatty liver disease | ||
| Oral Cavity | 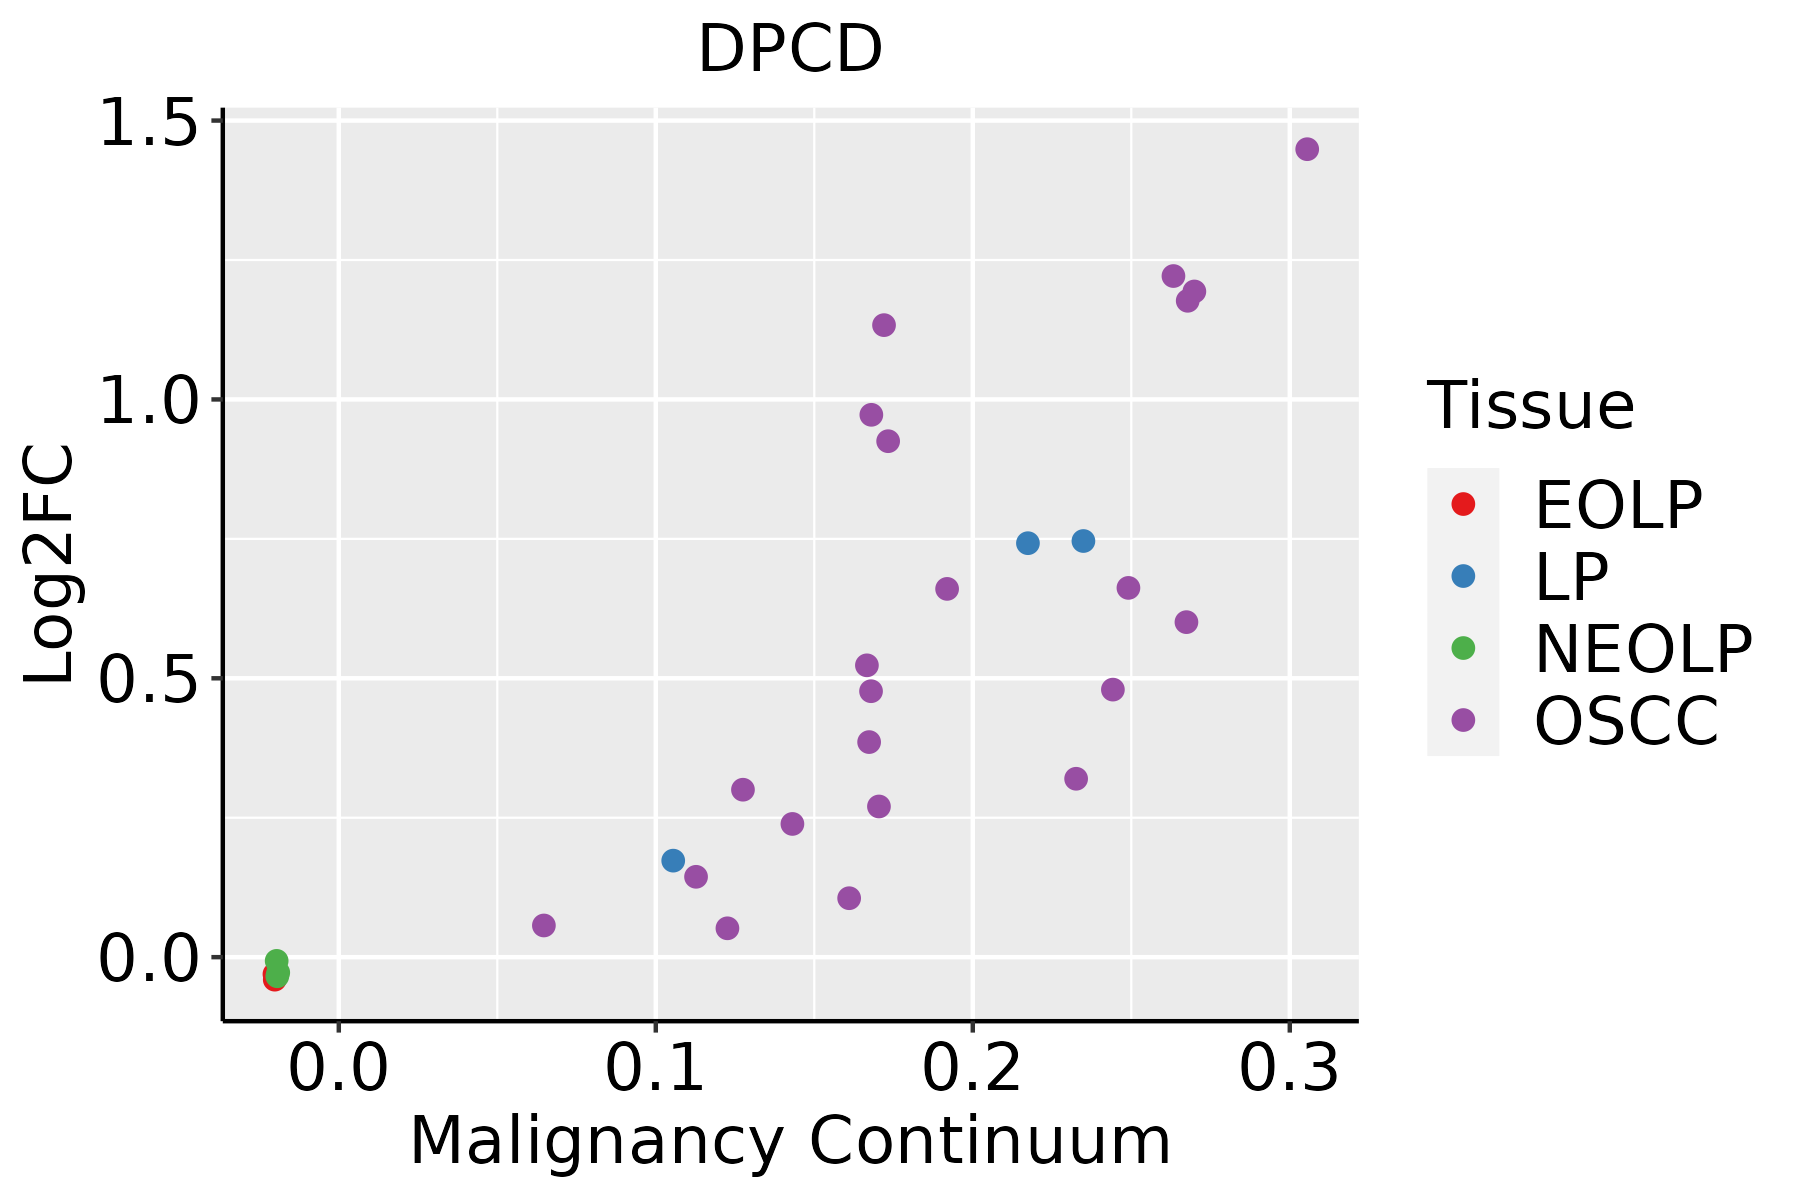 | EOLP: Erosive Oral lichen planus |
| LP: leukoplakia | ||
| NEOLP: Non-erosive oral lichen planus | ||
| OSCC: Oral squamous cell carcinoma | ||
| Prostate | 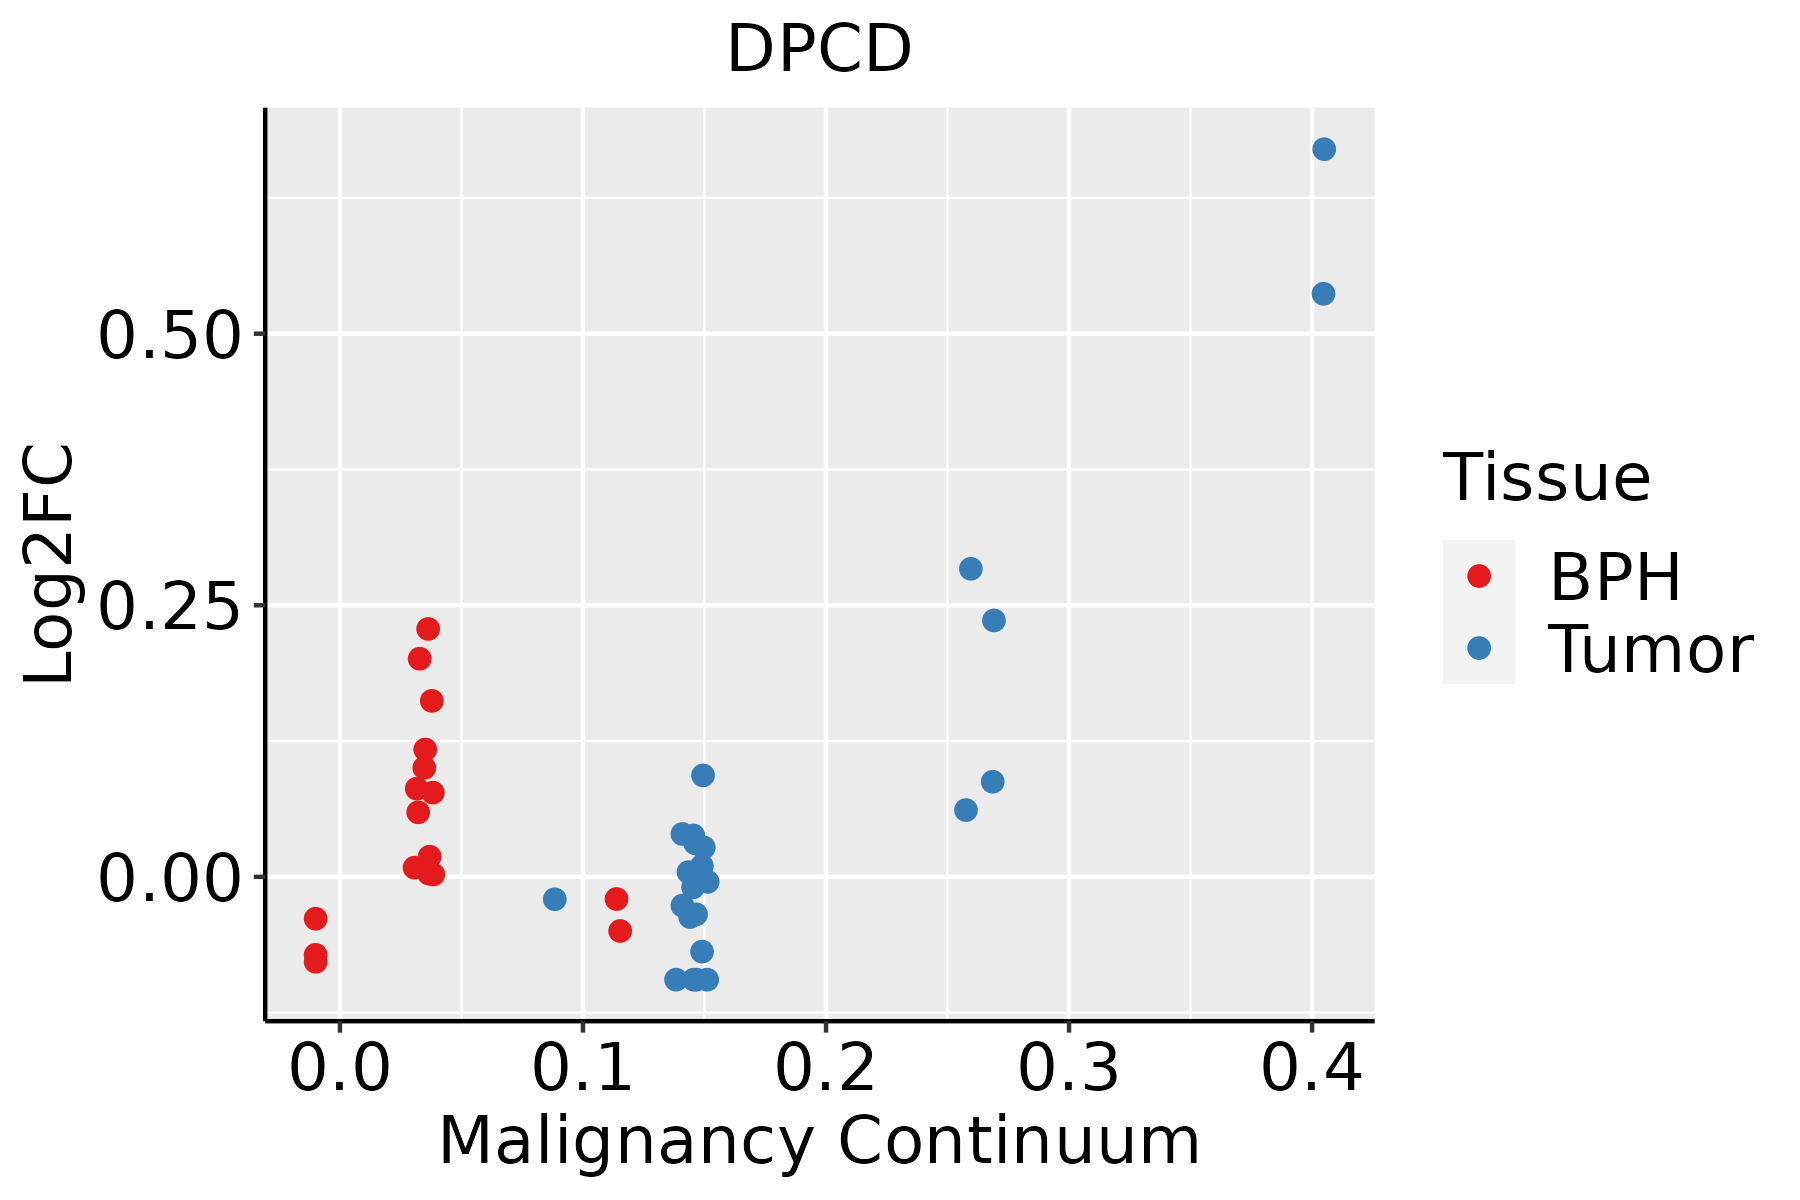 | BPH: Benign Prostatic Hyperplasia |
| Thyroid | 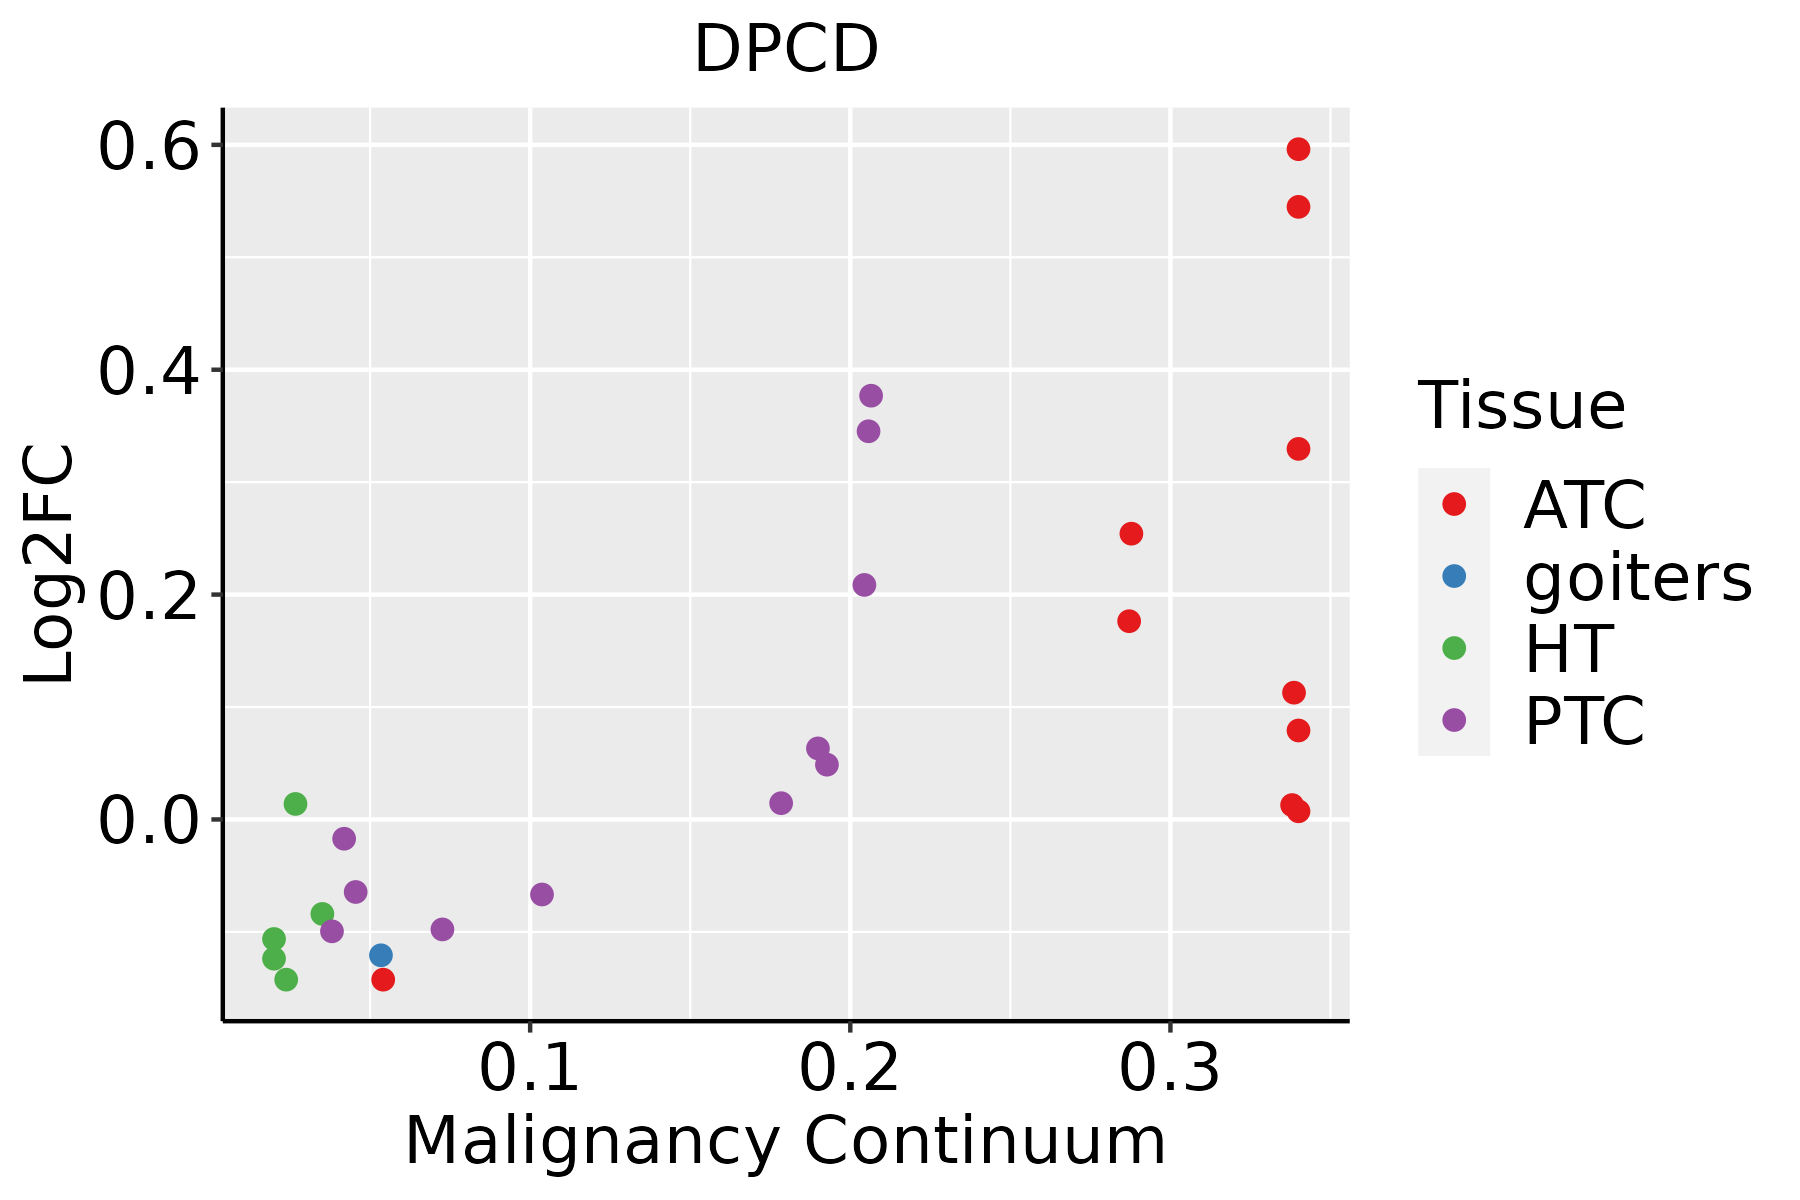 | ATC: Anaplastic thyroid cancer |
| HT: Hashimoto's thyroiditis | ||
| PTC: Papillary thyroid cancer |
| ∗log2FC in expression of this searched gene in stem-like cells from each diseased tissue sample relative to stem-like cells in normal samples in each tissue plotted against the malignancy continuum. Samples are colored based on if they are from different disease stage. |
Top |
Malignant transformation related pathway analysis |
| Find out the enriched GO biological processes and KEGG pathways involved in transition from healthy to precancer to cancer |
| Tissue | Disease Stage | Enriched GO biological Processes |
| Colorectum | AD |  |
| Colorectum | SER |  |
| Colorectum | MSS |  |
| Colorectum | MSI-H |  |
| Colorectum | FAP |  |
| ∗Top 15 enriched GO BP terms are showed in the bar plot of each disease state in each tissue. Each row represents a significant GO biological process which is colored according to the -log10(p.adjust). |
| Page: 1 2 3 4 5 6 7 8 9 |
| GO ID | Tissue | Disease Stage | Description | Gene Ratio | Bg Ratio | pvalue | p.adjust | Count |
| GO:00991114 | Esophagus | ESCC | microtubule-based transport | 115/8552 | 190/18723 | 2.54e-05 | 2.15e-04 | 115 |
| GO:00991113 | Oral cavity | OSCC | microtubule-based transport | 96/7305 | 190/18723 | 7.92e-04 | 4.27e-03 | 96 |
| GO:0021591 | Oral cavity | OSCC | ventricular system development | 18/7305 | 29/18723 | 1.00e-02 | 3.49e-02 | 18 |
| GO:00991112 | Prostate | BPH | microtubule-based transport | 49/3107 | 190/18723 | 8.05e-04 | 5.27e-03 | 49 |
| GO:00309004 | Prostate | BPH | forebrain development | 80/3107 | 379/18723 | 1.19e-02 | 4.82e-02 | 80 |
| GO:00991111 | Prostate | Tumor | microtubule-based transport | 51/3246 | 190/18723 | 6.62e-04 | 4.68e-03 | 51 |
| GO:003090012 | Prostate | Tumor | forebrain development | 86/3246 | 379/18723 | 4.22e-03 | 2.11e-02 | 86 |
| GO:00991115 | Thyroid | PTC | microtubule-based transport | 88/5968 | 190/18723 | 2.08e-05 | 2.08e-04 | 88 |
| GO:00215373 | Thyroid | PTC | telencephalon development | 100/5968 | 248/18723 | 2.90e-03 | 1.44e-02 | 100 |
| GO:00309007 | Thyroid | PTC | forebrain development | 143/5968 | 379/18723 | 8.47e-03 | 3.56e-02 | 143 |
| GO:009911112 | Thyroid | ATC | microtubule-based transport | 91/6293 | 190/18723 | 2.97e-05 | 2.48e-04 | 91 |
| GO:003090015 | Thyroid | ATC | forebrain development | 164/6293 | 379/18723 | 4.85e-05 | 3.87e-04 | 164 |
| GO:002153712 | Thyroid | ATC | telencephalon development | 113/6293 | 248/18723 | 5.61e-05 | 4.32e-04 | 113 |
| Page: 1 |
| Pathway ID | Tissue | Disease Stage | Description | Gene Ratio | Bg Ratio | pvalue | p.adjust | qvalue | Count |
| Page: 1 |
Top |
Cell-cell communication analysis |
| Identification of potential cell-cell interactions between two cell types and their ligand-receptor pairs for different disease states |
| Ligand | Receptor | LRpair | Pathway | Tissue | Disease Stage |
| Page: 1 |
Top |
Single-cell gene regulatory network inference analysis |
| Find out the significant the regulons (TFs) and the target genes of each regulon across cell types for different disease states |
| TF | Cell Type | Tissue | Disease Stage | Target Gene | RSS | Regulon Activity |
| ∗The dot plots of a searched regulon are shown for all cell subpopulations in each disease state of each tissue based on the regulon specific score inferred using pySCENIC and by calculating the average expression. |
| Page: 1 |
Top |
Somatic mutation of malignant transformation related genes |
| Annotation of somatic variants for genes involved in malignant transformation |
| Hugo Symbol | Variant Class | Variant Classification | dbSNP RS | HGVSc | HGVSp | HGVSp Short | SWISSPROT | BIOTYPE | SIFT | PolyPhen | Tumor Sample Barcode | Tissue | Histology | Sex | Age | Stage | Therapy Types | Drugs | Outcome |
| DPCD | SNV | Missense_Mutation | rs780393185 | c.283C>T | p.Arg95Cys | p.R95C | Q9BVM2 | protein_coding | deleterious(0) | probably_damaging(0.966) | TCGA-D8-A1Y3-01 | Breast | breast invasive carcinoma | Female | <65 | III/IV | Chemotherapy | doxorubicine+cyclophosphamide | SD |
| DPCD | insertion | In_Frame_Ins | novel | c.262_263insCCC | p.Asn88delinsThrHis | p.N88delinsTH | Q9BVM2 | protein_coding | TCGA-AO-A0J7-01 | Breast | breast invasive carcinoma | Female | >=65 | I/II | Chemotherapy | doxorubicin | SD | ||
| DPCD | insertion | Nonsense_Mutation | novel | c.263_264insCTTTCATCTTGTGCTAGTTACCTAG | p.Ala89PhefsTer8 | p.A89Ffs*8 | Q9BVM2 | protein_coding | TCGA-AO-A0J7-01 | Breast | breast invasive carcinoma | Female | >=65 | I/II | Chemotherapy | doxorubicin | SD | ||
| DPCD | SNV | Missense_Mutation | rs757346528 | c.374G>A | p.Arg125His | p.R125H | Q9BVM2 | protein_coding | deleterious(0.02) | possibly_damaging(0.59) | TCGA-A6-6781-01 | Colorectum | colon adenocarcinoma | Male | <65 | III/IV | Chemotherapy | oxaliplatin | SD |
| DPCD | SNV | Missense_Mutation | rs773833827 | c.484N>A | p.Ala162Thr | p.A162T | Q9BVM2 | protein_coding | deleterious(0.03) | benign(0.291) | TCGA-AA-A01R-01 | Colorectum | colon adenocarcinoma | Male | <65 | III/IV | Chemotherapy | 5-fluorouracil | PD |
| DPCD | SNV | Missense_Mutation | rs781093580 | c.97N>A | p.Gly33Ser | p.G33S | Q9BVM2 | protein_coding | deleterious(0.01) | probably_damaging(0.985) | TCGA-CK-4951-01 | Colorectum | colon adenocarcinoma | Female | >=65 | I/II | Unknown | Unknown | PD |
| DPCD | SNV | Missense_Mutation | rs780393185 | c.283C>T | p.Arg95Cys | p.R95C | Q9BVM2 | protein_coding | deleterious(0) | probably_damaging(0.966) | TCGA-F4-6570-01 | Colorectum | colon adenocarcinoma | Female | >=65 | I/II | Unknown | Unknown | SD |
| DPCD | SNV | Missense_Mutation | novel | c.75N>T | p.Lys25Asn | p.K25N | Q9BVM2 | protein_coding | deleterious(0) | possibly_damaging(0.875) | TCGA-AP-A059-01 | Endometrium | uterine corpus endometrioid carcinoma | Female | >=65 | I/II | Unknown | Unknown | SD |
| DPCD | SNV | Missense_Mutation | c.157N>T | p.Arg53Cys | p.R53C | Q9BVM2 | protein_coding | deleterious(0) | probably_damaging(0.992) | TCGA-AP-A059-01 | Endometrium | uterine corpus endometrioid carcinoma | Female | >=65 | I/II | Unknown | Unknown | SD | |
| DPCD | SNV | Missense_Mutation | rs375315178 | c.284G>A | p.Arg95His | p.R95H | Q9BVM2 | protein_coding | deleterious(0) | probably_damaging(0.966) | TCGA-AP-A1DV-01 | Endometrium | uterine corpus endometrioid carcinoma | Female | <65 | I/II | Unknown | Unknown | SD |
| Page: 1 2 |
Top |
Related drugs of malignant transformation related genes |
| Identification of chemicals and drugs interact with genes involved in malignant transfromation |
| (DGIdb 4.0) |
| Entrez ID | Symbol | Category | Interaction Types | Drug Claim Name | Drug Name | PMIDs |
| Page: 1 |

Copyright 2023-Present -The University of Texas Health Science Center at Houston |