
|
|||||
|
 | |
| |
| |
| |
| |
| |
|
Gene: DPAGT1 |
Gene summary for DPAGT1 |
| Gene information | Species | Human | Gene symbol | DPAGT1 | Gene ID | 1798 |
| Gene name | dolichyl-phosphate N-acetylglucosaminephosphotransferase 1 | |
| Gene Alias | ALG7 | |
| Cytomap | 11q23.3 | |
| Gene Type | protein-coding | GO ID | GO:0006040 | UniProtAcc | A0A024R3H8 |
Top |
Malignant transformation analysis |
| Identification of the aberrant gene expression in precancerous and cancerous lesions by comparing the gene expression of stem-like cells in diseased tissues with normal stem cells |
| Entrez ID | Symbol | Replicates | Species | Organ | Tissue | Adj P-value | Log2FC | Malignancy |
| 1798 | DPAGT1 | LZE4T | Human | Esophagus | ESCC | 1.38e-03 | 1.11e-01 | 0.0811 |
| 1798 | DPAGT1 | LZE20T | Human | Esophagus | ESCC | 7.58e-04 | 1.26e-01 | 0.0662 |
| 1798 | DPAGT1 | LZE22D1 | Human | Esophagus | HGIN | 8.14e-06 | 4.33e-01 | 0.0595 |
| 1798 | DPAGT1 | LZE22T | Human | Esophagus | ESCC | 2.24e-15 | 1.32e+00 | 0.068 |
| 1798 | DPAGT1 | LZE24T | Human | Esophagus | ESCC | 2.14e-18 | 5.73e-01 | 0.0596 |
| 1798 | DPAGT1 | LZE6T | Human | Esophagus | ESCC | 7.17e-04 | 1.49e-01 | 0.0845 |
| 1798 | DPAGT1 | P1T-E | Human | Esophagus | ESCC | 3.33e-02 | 1.32e-01 | 0.0875 |
| 1798 | DPAGT1 | P2T-E | Human | Esophagus | ESCC | 1.07e-14 | 2.35e-01 | 0.1177 |
| 1798 | DPAGT1 | P4T-E | Human | Esophagus | ESCC | 4.04e-36 | 7.53e-01 | 0.1323 |
| 1798 | DPAGT1 | P5T-E | Human | Esophagus | ESCC | 1.14e-19 | 3.46e-01 | 0.1327 |
| 1798 | DPAGT1 | P8T-E | Human | Esophagus | ESCC | 1.05e-17 | 3.97e-01 | 0.0889 |
| 1798 | DPAGT1 | P9T-E | Human | Esophagus | ESCC | 7.28e-09 | 1.88e-01 | 0.1131 |
| 1798 | DPAGT1 | P10T-E | Human | Esophagus | ESCC | 1.43e-09 | 1.91e-01 | 0.116 |
| 1798 | DPAGT1 | P11T-E | Human | Esophagus | ESCC | 3.67e-17 | 6.35e-01 | 0.1426 |
| 1798 | DPAGT1 | P12T-E | Human | Esophagus | ESCC | 1.41e-21 | 3.91e-01 | 0.1122 |
| 1798 | DPAGT1 | P15T-E | Human | Esophagus | ESCC | 1.97e-10 | 1.70e-01 | 0.1149 |
| 1798 | DPAGT1 | P16T-E | Human | Esophagus | ESCC | 2.17e-20 | 3.27e-01 | 0.1153 |
| 1798 | DPAGT1 | P17T-E | Human | Esophagus | ESCC | 4.78e-05 | 1.98e-01 | 0.1278 |
| 1798 | DPAGT1 | P19T-E | Human | Esophagus | ESCC | 3.79e-08 | 5.01e-01 | 0.1662 |
| 1798 | DPAGT1 | P20T-E | Human | Esophagus | ESCC | 3.94e-03 | 1.25e-01 | 0.1124 |
| Page: 1 2 3 4 5 |
| Tissue | Expression Dynamics | Abbreviation |
| Esophagus |  | ESCC: Esophageal squamous cell carcinoma |
| HGIN: High-grade intraepithelial neoplasias | ||
| LGIN: Low-grade intraepithelial neoplasias | ||
| Liver | 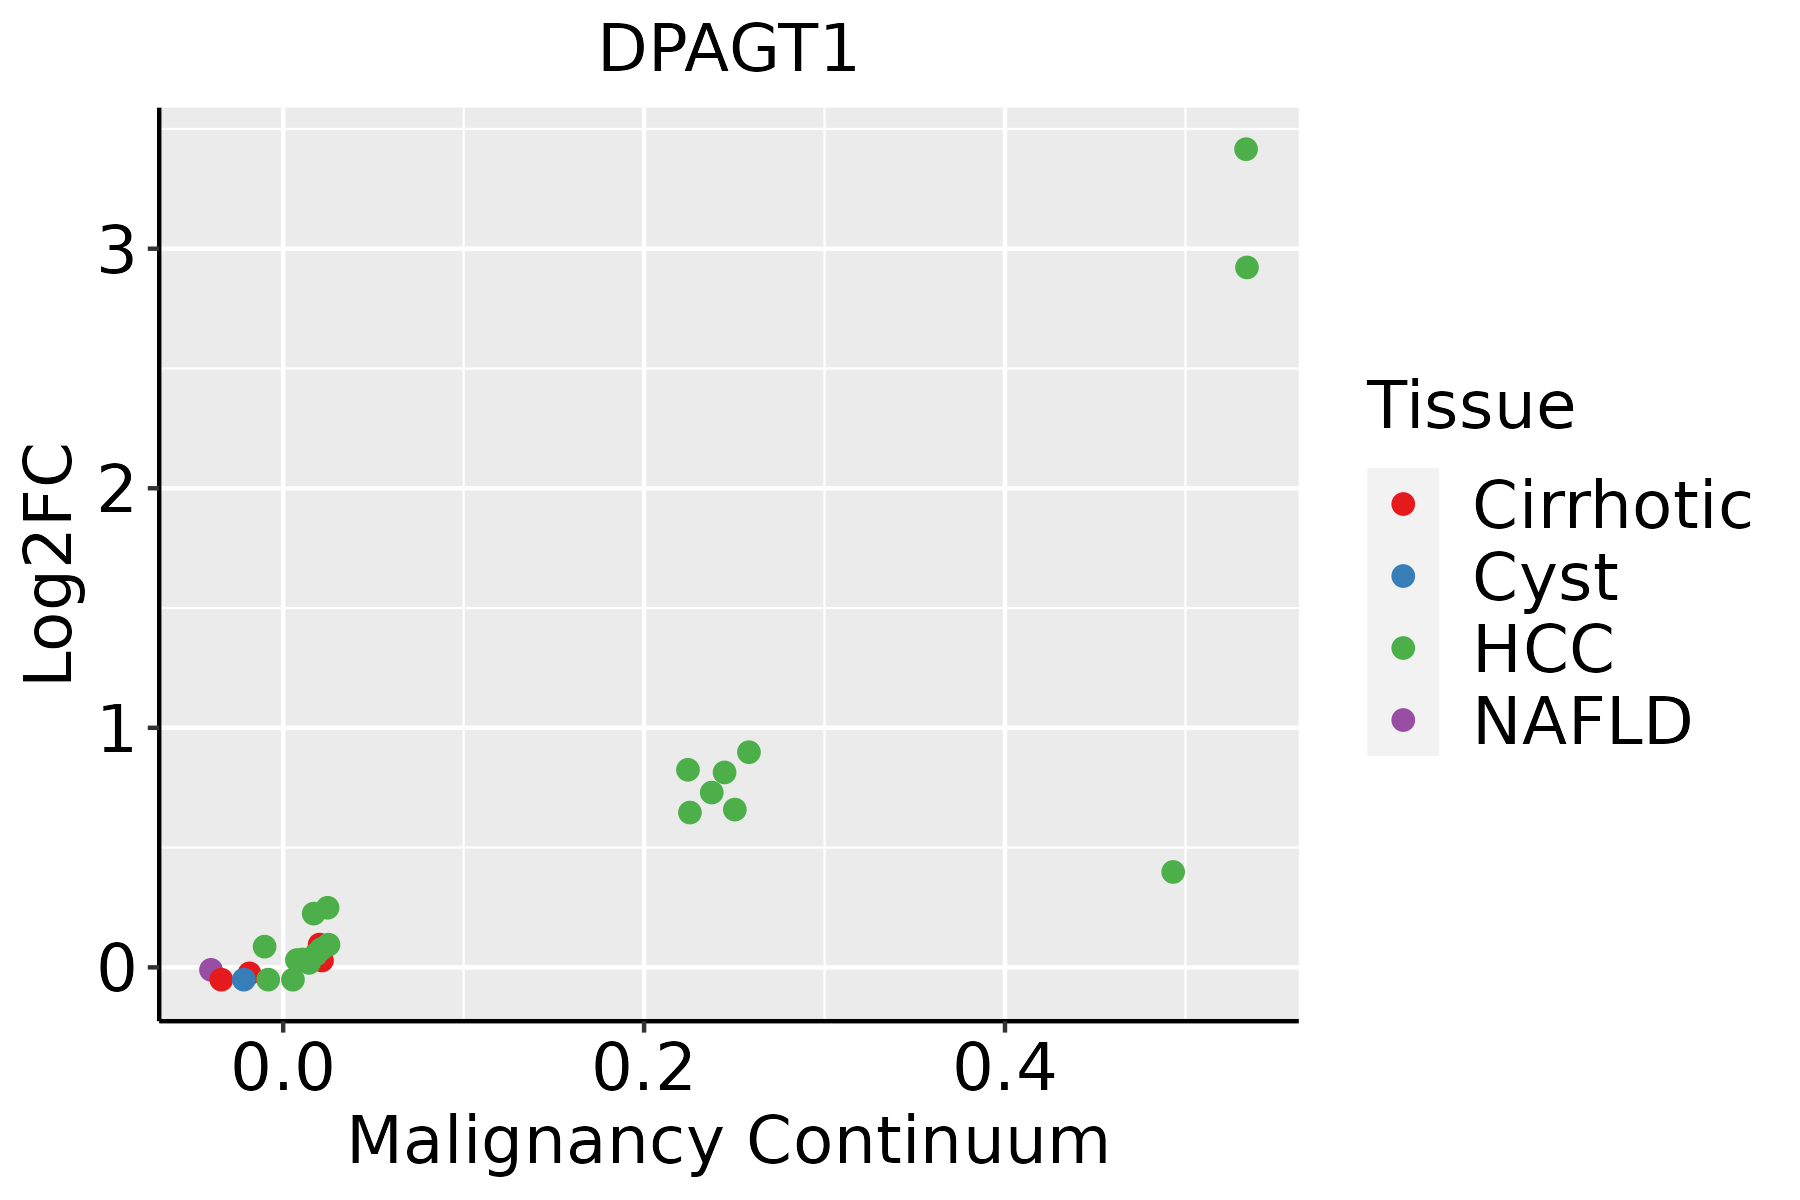 | HCC: Hepatocellular carcinoma |
| NAFLD: Non-alcoholic fatty liver disease | ||
| Oral Cavity | 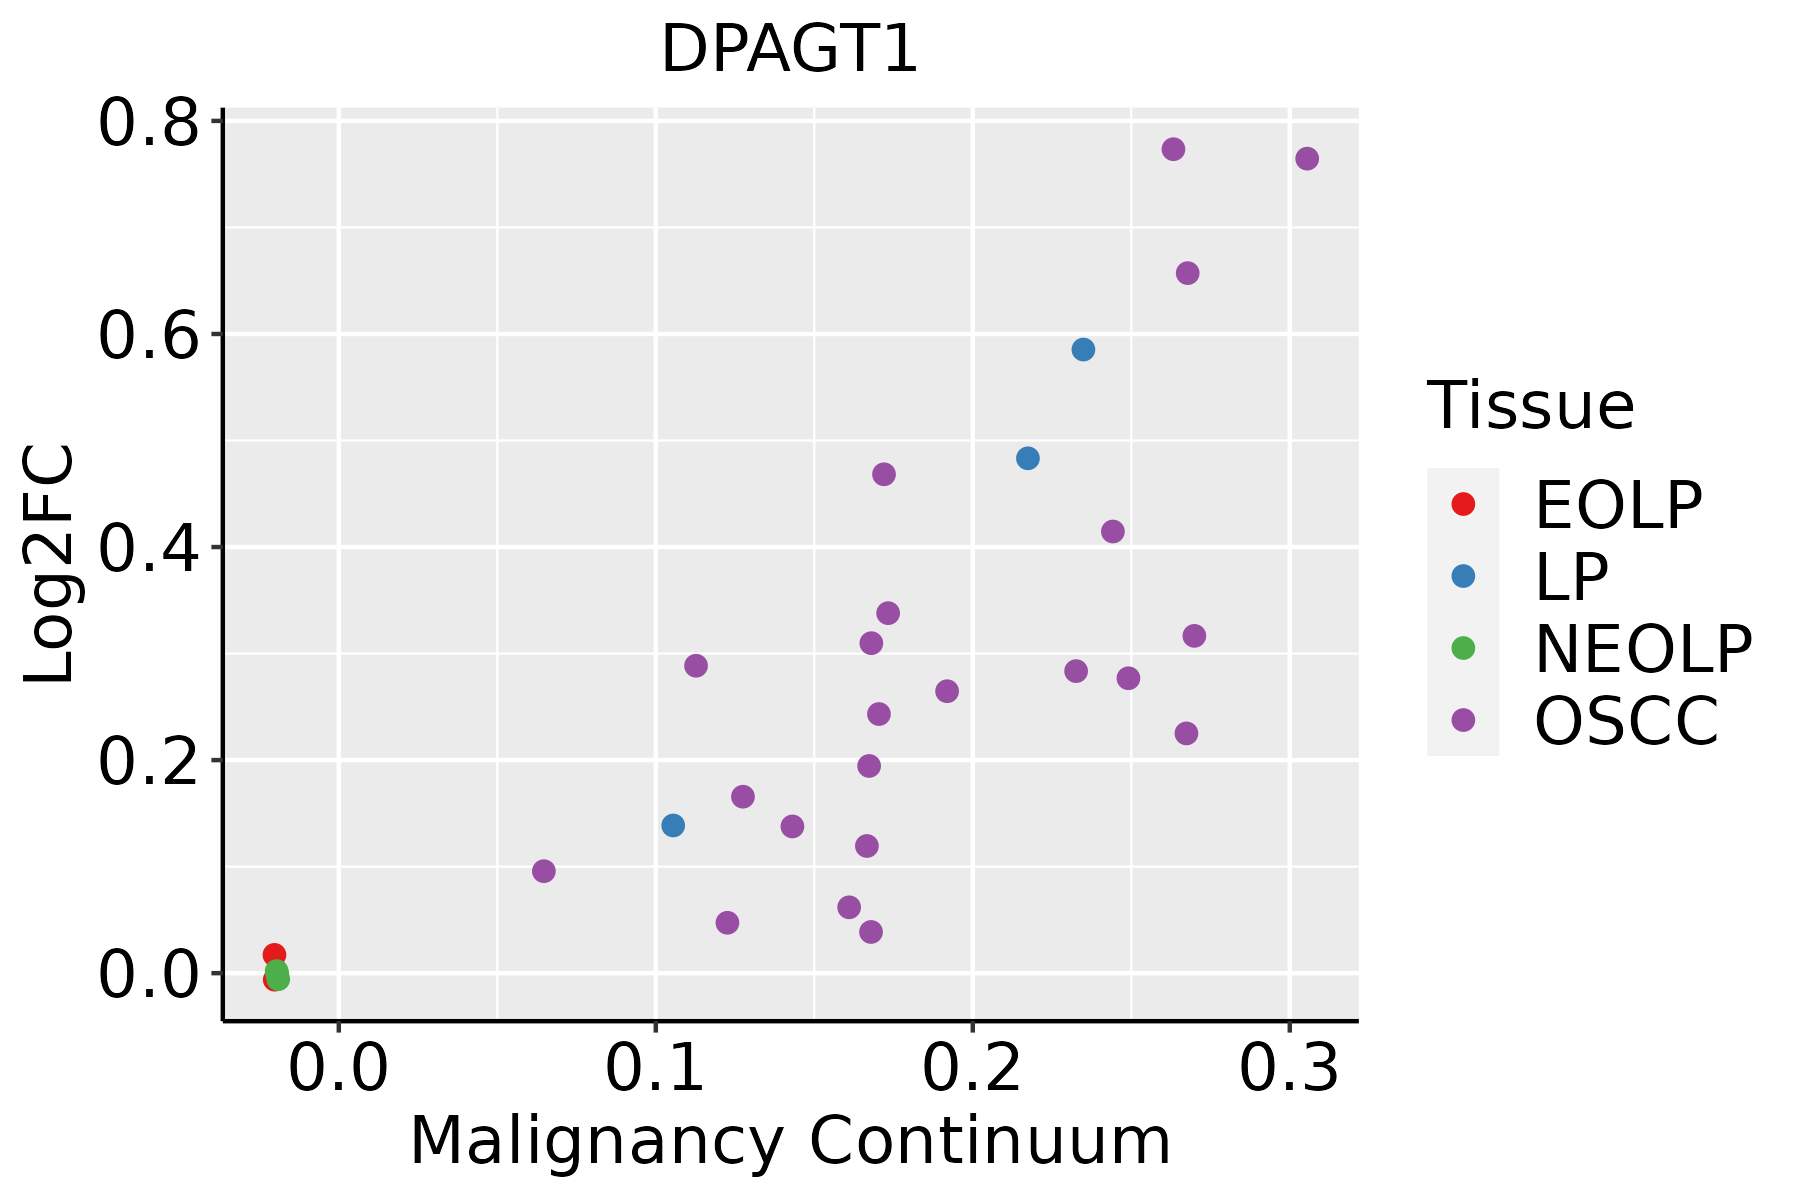 | EOLP: Erosive Oral lichen planus |
| LP: leukoplakia | ||
| NEOLP: Non-erosive oral lichen planus | ||
| OSCC: Oral squamous cell carcinoma | ||
| Thyroid | 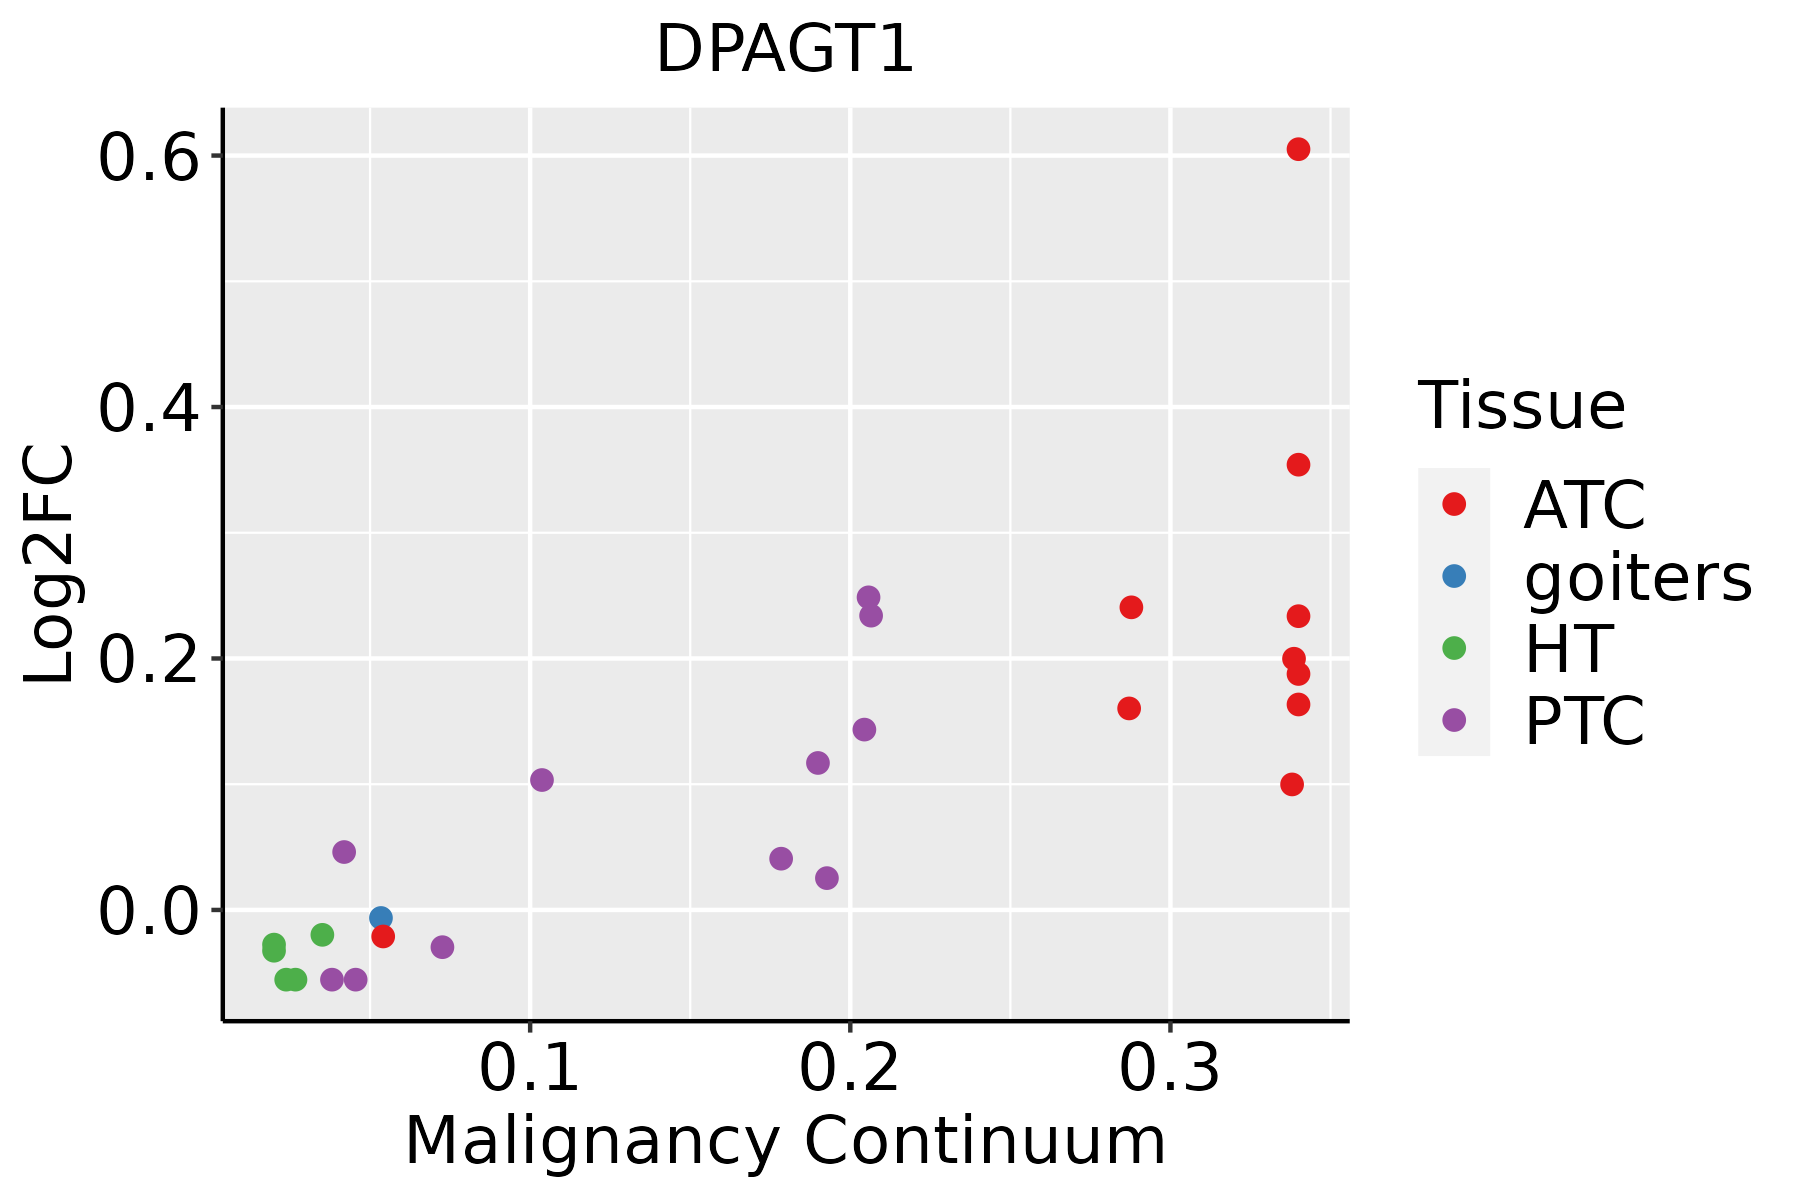 | ATC: Anaplastic thyroid cancer |
| HT: Hashimoto's thyroiditis | ||
| PTC: Papillary thyroid cancer |
| ∗log2FC in expression of this searched gene in stem-like cells from each diseased tissue sample relative to stem-like cells in normal samples in each tissue plotted against the malignancy continuum. Samples are colored based on if they are from different disease stage. |
Top |
Malignant transformation related pathway analysis |
| Find out the enriched GO biological processes and KEGG pathways involved in transition from healthy to precancer to cancer |
| Tissue | Disease Stage | Enriched GO biological Processes |
| Colorectum | AD |  |
| Colorectum | SER |  |
| Colorectum | MSS |  |
| Colorectum | MSI-H |  |
| Colorectum | FAP |  |
| ∗Top 15 enriched GO BP terms are showed in the bar plot of each disease state in each tissue. Each row represents a significant GO biological process which is colored according to the -log10(p.adjust). |
| Page: 1 2 3 4 5 6 7 8 9 |
| GO ID | Tissue | Disease Stage | Description | Gene Ratio | Bg Ratio | pvalue | p.adjust | Count |
| GO:00064876 | Esophagus | HGIN | protein N-linked glycosylation | 17/2587 | 65/18723 | 6.04e-03 | 4.87e-02 | 17 |
| GO:00086544 | Esophagus | ESCC | phospholipid biosynthetic process | 162/8552 | 253/18723 | 2.59e-09 | 5.73e-08 | 162 |
| GO:000648714 | Esophagus | ESCC | protein N-linked glycosylation | 51/8552 | 65/18723 | 6.41e-08 | 1.13e-06 | 51 |
| GO:00091002 | Esophagus | ESCC | glycoprotein metabolic process | 226/8552 | 387/18723 | 2.64e-07 | 3.94e-06 | 226 |
| GO:00700854 | Esophagus | ESCC | glycosylation | 144/8552 | 240/18723 | 5.12e-06 | 5.38e-05 | 144 |
| GO:00066446 | Esophagus | ESCC | phospholipid metabolic process | 218/8552 | 383/18723 | 5.37e-06 | 5.59e-05 | 218 |
| GO:00060668 | Esophagus | ESCC | alcohol metabolic process | 202/8552 | 353/18723 | 7.32e-06 | 7.26e-05 | 202 |
| GO:00064865 | Esophagus | ESCC | protein glycosylation | 135/8552 | 226/18723 | 1.36e-05 | 1.24e-04 | 135 |
| GO:00434135 | Esophagus | ESCC | macromolecule glycosylation | 135/8552 | 226/18723 | 1.36e-05 | 1.24e-04 | 135 |
| GO:00092256 | Esophagus | ESCC | nucleotide-sugar metabolic process | 29/8552 | 36/18723 | 1.91e-05 | 1.67e-04 | 29 |
| GO:00091012 | Esophagus | ESCC | glycoprotein biosynthetic process | 181/8552 | 317/18723 | 2.54e-05 | 2.15e-04 | 181 |
| GO:00064882 | Esophagus | ESCC | dolichol-linked oligosaccharide biosynthetic process | 14/8552 | 18/18723 | 5.77e-03 | 2.14e-02 | 14 |
| GO:00064902 | Esophagus | ESCC | oligosaccharide-lipid intermediate biosynthetic process | 14/8552 | 19/18723 | 1.27e-02 | 4.21e-02 | 14 |
| GO:000606612 | Liver | Cirrhotic | alcohol metabolic process | 141/4634 | 353/18723 | 1.57e-10 | 8.03e-09 | 141 |
| GO:00064873 | Liver | Cirrhotic | protein N-linked glycosylation | 30/4634 | 65/18723 | 1.40e-04 | 1.36e-03 | 30 |
| GO:00067202 | Liver | Cirrhotic | isoprenoid metabolic process | 46/4634 | 116/18723 | 2.71e-04 | 2.41e-03 | 46 |
| GO:000606621 | Liver | HCC | alcohol metabolic process | 208/7958 | 353/18723 | 2.80e-10 | 9.50e-09 | 208 |
| GO:00086542 | Liver | HCC | phospholipid biosynthetic process | 150/7958 | 253/18723 | 4.77e-08 | 1.03e-06 | 150 |
| GO:00066444 | Liver | HCC | phospholipid metabolic process | 214/7958 | 383/18723 | 7.25e-08 | 1.48e-06 | 214 |
| GO:000648711 | Liver | HCC | protein N-linked glycosylation | 48/7958 | 65/18723 | 2.85e-07 | 5.00e-06 | 48 |
| Page: 1 2 3 4 |
| Pathway ID | Tissue | Disease Stage | Description | Gene Ratio | Bg Ratio | pvalue | p.adjust | qvalue | Count |
| hsa005106 | Esophagus | HGIN | N-Glycan biosynthesis | 17/1383 | 53/8465 | 3.43e-03 | 2.54e-02 | 2.02e-02 | 17 |
| hsa0051013 | Esophagus | HGIN | N-Glycan biosynthesis | 17/1383 | 53/8465 | 3.43e-03 | 2.54e-02 | 2.02e-02 | 17 |
| hsa0051023 | Esophagus | ESCC | N-Glycan biosynthesis | 39/4205 | 53/8465 | 3.26e-04 | 1.15e-03 | 5.89e-04 | 39 |
| hsa0051033 | Esophagus | ESCC | N-Glycan biosynthesis | 39/4205 | 53/8465 | 3.26e-04 | 1.15e-03 | 5.89e-04 | 39 |
| hsa005104 | Liver | Cirrhotic | N-Glycan biosynthesis | 32/2530 | 53/8465 | 3.82e-06 | 4.10e-05 | 2.53e-05 | 32 |
| hsa0051011 | Liver | Cirrhotic | N-Glycan biosynthesis | 32/2530 | 53/8465 | 3.82e-06 | 4.10e-05 | 2.53e-05 | 32 |
| hsa0051021 | Liver | HCC | N-Glycan biosynthesis | 40/4020 | 53/8465 | 2.95e-05 | 1.87e-04 | 1.04e-04 | 40 |
| hsa0051031 | Liver | HCC | N-Glycan biosynthesis | 40/4020 | 53/8465 | 2.95e-05 | 1.87e-04 | 1.04e-04 | 40 |
| hsa005105 | Oral cavity | OSCC | N-Glycan biosynthesis | 39/3704 | 53/8465 | 9.77e-06 | 4.36e-05 | 2.22e-05 | 39 |
| hsa0051012 | Oral cavity | OSCC | N-Glycan biosynthesis | 39/3704 | 53/8465 | 9.77e-06 | 4.36e-05 | 2.22e-05 | 39 |
| hsa0051022 | Oral cavity | LP | N-Glycan biosynthesis | 31/2418 | 53/8465 | 4.86e-06 | 4.14e-05 | 2.67e-05 | 31 |
| hsa0051032 | Oral cavity | LP | N-Glycan biosynthesis | 31/2418 | 53/8465 | 4.86e-06 | 4.14e-05 | 2.67e-05 | 31 |
| Page: 1 |
Top |
Cell-cell communication analysis |
| Identification of potential cell-cell interactions between two cell types and their ligand-receptor pairs for different disease states |
| Ligand | Receptor | LRpair | Pathway | Tissue | Disease Stage |
| Page: 1 |
Top |
Single-cell gene regulatory network inference analysis |
| Find out the significant the regulons (TFs) and the target genes of each regulon across cell types for different disease states |
| TF | Cell Type | Tissue | Disease Stage | Target Gene | RSS | Regulon Activity |
| ∗The dot plots of a searched regulon are shown for all cell subpopulations in each disease state of each tissue based on the regulon specific score inferred using pySCENIC and by calculating the average expression. |
| Page: 1 |
Top |
Somatic mutation of malignant transformation related genes |
| Annotation of somatic variants for genes involved in malignant transformation |
| Hugo Symbol | Variant Class | Variant Classification | dbSNP RS | HGVSc | HGVSp | HGVSp Short | SWISSPROT | BIOTYPE | SIFT | PolyPhen | Tumor Sample Barcode | Tissue | Histology | Sex | Age | Stage | Therapy Types | Drugs | Outcome |
| DPAGT1 | SNV | Missense_Mutation | rs376996734 | c.1018N>T | p.Leu340Phe | p.L340F | Q9H3H5 | protein_coding | tolerated(0.46) | benign(0.028) | TCGA-BH-A0E0-01 | Breast | breast invasive carcinoma | Female | <65 | III/IV | Chemotherapy | docetaxel | SD |
| DPAGT1 | SNV | Missense_Mutation | c.673N>T | p.Leu225Phe | p.L225F | Q9H3H5 | protein_coding | deleterious(0.02) | possibly_damaging(0.604) | TCGA-BH-A0HF-01 | Breast | breast invasive carcinoma | Female | >=65 | I/II | Hormone Therapy | arimidex | SD | |
| DPAGT1 | SNV | Missense_Mutation | novel | c.1169G>A | p.Gly390Asp | p.G390D | Q9H3H5 | protein_coding | deleterious(0.03) | benign(0.048) | TCGA-LD-A7W5-01 | Breast | breast invasive carcinoma | Female | <65 | III/IV | Chemotherapy | taxotere | SD |
| DPAGT1 | SNV | Missense_Mutation | novel | c.825N>A | p.Met275Ile | p.M275I | Q9H3H5 | protein_coding | deleterious(0.03) | benign(0.046) | TCGA-2W-A8YY-01 | Cervix | cervical & endocervical cancer | Female | <65 | I/II | Chemotherapy | cisplatin | CR |
| DPAGT1 | SNV | Missense_Mutation | c.1012G>C | p.Glu338Gln | p.E338Q | Q9H3H5 | protein_coding | tolerated(0.41) | benign(0.018) | TCGA-EK-A2RJ-01 | Cervix | cervical & endocervical cancer | Female | <65 | I/II | Unknown | Unknown | SD | |
| DPAGT1 | SNV | Missense_Mutation | c.883C>T | p.His295Tyr | p.H295Y | Q9H3H5 | protein_coding | deleterious(0.04) | benign(0.281) | TCGA-AA-3710-01 | Colorectum | colon adenocarcinoma | Female | >=65 | I/II | Unknown | Unknown | SD | |
| DPAGT1 | SNV | Missense_Mutation | c.935N>A | p.Gly312Asp | p.G312D | Q9H3H5 | protein_coding | tolerated(0.44) | benign(0.076) | TCGA-G4-6588-01 | Colorectum | colon adenocarcinoma | Female | <65 | I/II | Unknown | Unknown | SD | |
| DPAGT1 | SNV | Missense_Mutation | c.548N>G | p.Ala183Gly | p.A183G | Q9H3H5 | protein_coding | deleterious(0.03) | possibly_damaging(0.617) | TCGA-AG-A00C-01 | Colorectum | rectum adenocarcinoma | Female | <65 | III/IV | Chemotherapy | 5-fluorouracil | CR | |
| DPAGT1 | SNV | Missense_Mutation | novel | c.143A>C | p.Lys48Thr | p.K48T | Q9H3H5 | protein_coding | deleterious(0) | probably_damaging(1) | TCGA-EI-6917-01 | Colorectum | rectum adenocarcinoma | Male | <65 | III/IV | Chemotherapy | 5fluorouracil+oxaciplatina+l-folinian | SD |
| DPAGT1 | insertion | Frame_Shift_Ins | novel | c.698_699insT | p.Thr234HisfsTer116 | p.T234Hfs*116 | Q9H3H5 | protein_coding | TCGA-AD-A5EJ-01 | Colorectum | colon adenocarcinoma | Female | >=65 | I/II | Unknown | Unknown | SD |
| Page: 1 2 3 4 |
Top |
Related drugs of malignant transformation related genes |
| Identification of chemicals and drugs interact with genes involved in malignant transfromation |
| (DGIdb 4.0) |
| Entrez ID | Symbol | Category | Interaction Types | Drug Claim Name | Drug Name | PMIDs |
| Page: 1 |

Copyright 2023-Present -The University of Texas Health Science Center at Houston |