
|
|||||
|
 | |
| |
| |
| |
| |
| |
|
Gene: DOLPP1 |
Gene summary for DOLPP1 |
| Gene information | Species | Human | Gene symbol | DOLPP1 | Gene ID | 57171 |
| Gene name | dolichyldiphosphatase 1 | |
| Gene Alias | LSFR2 | |
| Cytomap | 9q34.11 | |
| Gene Type | protein-coding | GO ID | GO:0006464 | UniProtAcc | Q86YN1 |
Top |
Malignant transformation analysis |
| Identification of the aberrant gene expression in precancerous and cancerous lesions by comparing the gene expression of stem-like cells in diseased tissues with normal stem cells |
| Entrez ID | Symbol | Replicates | Species | Organ | Tissue | Adj P-value | Log2FC | Malignancy |
| 57171 | DOLPP1 | LZE7T | Human | Esophagus | ESCC | 1.84e-02 | 1.60e-01 | 0.0667 |
| 57171 | DOLPP1 | LZE20T | Human | Esophagus | ESCC | 4.82e-03 | 2.36e-01 | 0.0662 |
| 57171 | DOLPP1 | LZE24T | Human | Esophagus | ESCC | 2.81e-03 | 1.57e-01 | 0.0596 |
| 57171 | DOLPP1 | P2T-E | Human | Esophagus | ESCC | 6.63e-24 | 4.22e-01 | 0.1177 |
| 57171 | DOLPP1 | P4T-E | Human | Esophagus | ESCC | 6.18e-12 | 2.75e-01 | 0.1323 |
| 57171 | DOLPP1 | P5T-E | Human | Esophagus | ESCC | 7.31e-08 | 9.82e-02 | 0.1327 |
| 57171 | DOLPP1 | P8T-E | Human | Esophagus | ESCC | 1.53e-20 | 4.15e-01 | 0.0889 |
| 57171 | DOLPP1 | P9T-E | Human | Esophagus | ESCC | 2.42e-03 | 1.07e-01 | 0.1131 |
| 57171 | DOLPP1 | P10T-E | Human | Esophagus | ESCC | 1.54e-14 | 2.36e-01 | 0.116 |
| 57171 | DOLPP1 | P11T-E | Human | Esophagus | ESCC | 2.92e-07 | 2.59e-01 | 0.1426 |
| 57171 | DOLPP1 | P12T-E | Human | Esophagus | ESCC | 3.52e-13 | 2.58e-01 | 0.1122 |
| 57171 | DOLPP1 | P15T-E | Human | Esophagus | ESCC | 6.15e-15 | 3.36e-01 | 0.1149 |
| 57171 | DOLPP1 | P16T-E | Human | Esophagus | ESCC | 1.29e-13 | 1.93e-01 | 0.1153 |
| 57171 | DOLPP1 | P21T-E | Human | Esophagus | ESCC | 3.92e-13 | 3.98e-01 | 0.1617 |
| 57171 | DOLPP1 | P22T-E | Human | Esophagus | ESCC | 1.24e-06 | 8.85e-02 | 0.1236 |
| 57171 | DOLPP1 | P23T-E | Human | Esophagus | ESCC | 3.68e-05 | 1.58e-01 | 0.108 |
| 57171 | DOLPP1 | P24T-E | Human | Esophagus | ESCC | 3.95e-07 | 2.35e-01 | 0.1287 |
| 57171 | DOLPP1 | P26T-E | Human | Esophagus | ESCC | 2.19e-09 | 1.88e-01 | 0.1276 |
| 57171 | DOLPP1 | P27T-E | Human | Esophagus | ESCC | 6.76e-13 | 2.14e-01 | 0.1055 |
| 57171 | DOLPP1 | P28T-E | Human | Esophagus | ESCC | 9.49e-11 | 1.09e-01 | 0.1149 |
| Page: 1 2 3 4 |
| Tissue | Expression Dynamics | Abbreviation |
| Esophagus | 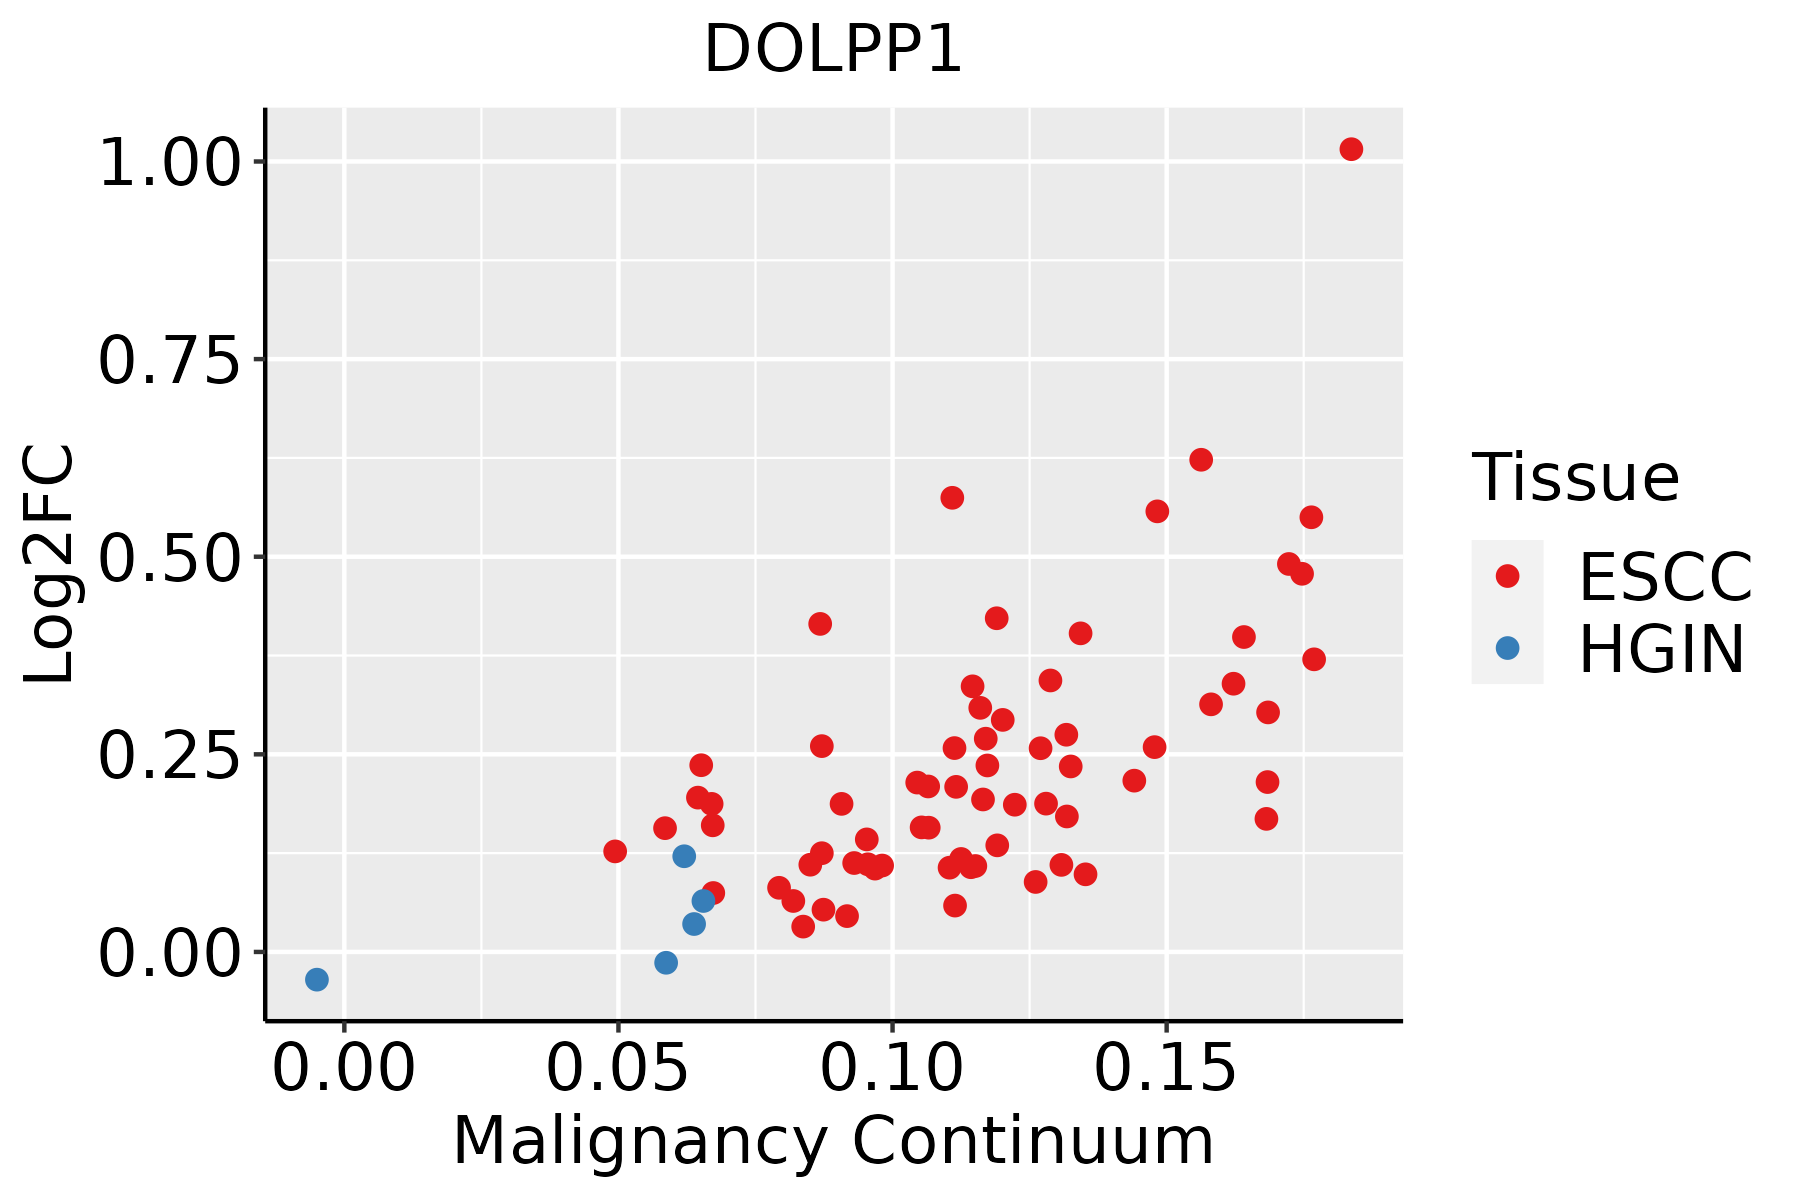 | ESCC: Esophageal squamous cell carcinoma |
| HGIN: High-grade intraepithelial neoplasias | ||
| LGIN: Low-grade intraepithelial neoplasias | ||
| Oral Cavity |  | EOLP: Erosive Oral lichen planus |
| LP: leukoplakia | ||
| NEOLP: Non-erosive oral lichen planus | ||
| OSCC: Oral squamous cell carcinoma |
| ∗log2FC in expression of this searched gene in stem-like cells from each diseased tissue sample relative to stem-like cells in normal samples in each tissue plotted against the malignancy continuum. Samples are colored based on if they are from different disease stage. |
Top |
Malignant transformation related pathway analysis |
| Find out the enriched GO biological processes and KEGG pathways involved in transition from healthy to precancer to cancer |
| Tissue | Disease Stage | Enriched GO biological Processes |
| Colorectum | AD |  |
| Colorectum | SER |  |
| Colorectum | MSS |  |
| Colorectum | MSI-H |  |
| Colorectum | FAP |  |
| ∗Top 15 enriched GO BP terms are showed in the bar plot of each disease state in each tissue. Each row represents a significant GO biological process which is colored according to the -log10(p.adjust). |
| Page: 1 2 3 4 5 6 7 8 9 |
| GO ID | Tissue | Disease Stage | Description | Gene Ratio | Bg Ratio | pvalue | p.adjust | Count |
| GO:00086544 | Esophagus | ESCC | phospholipid biosynthetic process | 162/8552 | 253/18723 | 2.59e-09 | 5.73e-08 | 162 |
| GO:000648714 | Esophagus | ESCC | protein N-linked glycosylation | 51/8552 | 65/18723 | 6.41e-08 | 1.13e-06 | 51 |
| GO:00091002 | Esophagus | ESCC | glycoprotein metabolic process | 226/8552 | 387/18723 | 2.64e-07 | 3.94e-06 | 226 |
| GO:00700854 | Esophagus | ESCC | glycosylation | 144/8552 | 240/18723 | 5.12e-06 | 5.38e-05 | 144 |
| GO:00066446 | Esophagus | ESCC | phospholipid metabolic process | 218/8552 | 383/18723 | 5.37e-06 | 5.59e-05 | 218 |
| GO:00064865 | Esophagus | ESCC | protein glycosylation | 135/8552 | 226/18723 | 1.36e-05 | 1.24e-04 | 135 |
| GO:00434135 | Esophagus | ESCC | macromolecule glycosylation | 135/8552 | 226/18723 | 1.36e-05 | 1.24e-04 | 135 |
| GO:00091012 | Esophagus | ESCC | glycoprotein biosynthetic process | 181/8552 | 317/18723 | 2.54e-05 | 2.15e-04 | 181 |
| GO:00064882 | Esophagus | ESCC | dolichol-linked oligosaccharide biosynthetic process | 14/8552 | 18/18723 | 5.77e-03 | 2.14e-02 | 14 |
| GO:00064902 | Esophagus | ESCC | oligosaccharide-lipid intermediate biosynthetic process | 14/8552 | 19/18723 | 1.27e-02 | 4.21e-02 | 14 |
| GO:00064875 | Oral cavity | OSCC | protein N-linked glycosylation | 44/7305 | 65/18723 | 2.63e-06 | 3.26e-05 | 44 |
| GO:00086543 | Oral cavity | OSCC | phospholipid biosynthetic process | 130/7305 | 253/18723 | 3.96e-05 | 3.46e-04 | 130 |
| GO:0006488 | Oral cavity | OSCC | dolichol-linked oligosaccharide biosynthetic process | 15/7305 | 18/18723 | 1.53e-04 | 1.07e-03 | 15 |
| GO:00091001 | Oral cavity | OSCC | glycoprotein metabolic process | 185/7305 | 387/18723 | 2.37e-04 | 1.54e-03 | 185 |
| GO:0006490 | Oral cavity | OSCC | oligosaccharide-lipid intermediate biosynthetic process | 15/7305 | 19/18723 | 4.64e-04 | 2.76e-03 | 15 |
| GO:00091011 | Oral cavity | OSCC | glycoprotein biosynthetic process | 151/7305 | 317/18723 | 1.01e-03 | 5.26e-03 | 151 |
| GO:00064864 | Oral cavity | OSCC | protein glycosylation | 111/7305 | 226/18723 | 1.22e-03 | 6.10e-03 | 111 |
| GO:00434134 | Oral cavity | OSCC | macromolecule glycosylation | 111/7305 | 226/18723 | 1.22e-03 | 6.10e-03 | 111 |
| GO:00700853 | Oral cavity | OSCC | glycosylation | 117/7305 | 240/18723 | 1.29e-03 | 6.42e-03 | 117 |
| GO:00066445 | Oral cavity | OSCC | phospholipid metabolic process | 175/7305 | 383/18723 | 4.21e-03 | 1.71e-02 | 175 |
| Page: 1 |
| Pathway ID | Tissue | Disease Stage | Description | Gene Ratio | Bg Ratio | pvalue | p.adjust | qvalue | Count |
| hsa0051023 | Esophagus | ESCC | N-Glycan biosynthesis | 39/4205 | 53/8465 | 3.26e-04 | 1.15e-03 | 5.89e-04 | 39 |
| hsa0051033 | Esophagus | ESCC | N-Glycan biosynthesis | 39/4205 | 53/8465 | 3.26e-04 | 1.15e-03 | 5.89e-04 | 39 |
| hsa005105 | Oral cavity | OSCC | N-Glycan biosynthesis | 39/3704 | 53/8465 | 9.77e-06 | 4.36e-05 | 2.22e-05 | 39 |
| hsa0051012 | Oral cavity | OSCC | N-Glycan biosynthesis | 39/3704 | 53/8465 | 9.77e-06 | 4.36e-05 | 2.22e-05 | 39 |
| Page: 1 |
Top |
Cell-cell communication analysis |
| Identification of potential cell-cell interactions between two cell types and their ligand-receptor pairs for different disease states |
| Ligand | Receptor | LRpair | Pathway | Tissue | Disease Stage |
| Page: 1 |
Top |
Single-cell gene regulatory network inference analysis |
| Find out the significant the regulons (TFs) and the target genes of each regulon across cell types for different disease states |
| TF | Cell Type | Tissue | Disease Stage | Target Gene | RSS | Regulon Activity |
| ∗The dot plots of a searched regulon are shown for all cell subpopulations in each disease state of each tissue based on the regulon specific score inferred using pySCENIC and by calculating the average expression. |
| Page: 1 |
Top |
Somatic mutation of malignant transformation related genes |
| Annotation of somatic variants for genes involved in malignant transformation |
| Hugo Symbol | Variant Class | Variant Classification | dbSNP RS | HGVSc | HGVSp | HGVSp Short | SWISSPROT | BIOTYPE | SIFT | PolyPhen | Tumor Sample Barcode | Tissue | Histology | Sex | Age | Stage | Therapy Types | Drugs | Outcome |
| DOLPP1 | SNV | Missense_Mutation | c.593N>A | p.Pro198His | p.P198H | Q86YN1 | protein_coding | tolerated(0.13) | benign(0.04) | TCGA-D8-A1XK-01 | Breast | breast invasive carcinoma | Female | <65 | I/II | Chemotherapy | doxorubicine+cyclophosphamide | SD | |
| DOLPP1 | SNV | Missense_Mutation | c.572N>G | p.Phe191Cys | p.F191C | Q86YN1 | protein_coding | deleterious(0) | probably_damaging(0.998) | TCGA-E9-A22D-01 | Breast | breast invasive carcinoma | Female | <65 | I/II | Chemotherapy | 5-fluorouracil | SD | |
| DOLPP1 | SNV | Missense_Mutation | novel | c.526N>A | p.Ala176Thr | p.A176T | Q86YN1 | protein_coding | deleterious(0) | probably_damaging(0.909) | TCGA-A5-A1OF-01 | Endometrium | uterine corpus endometrioid carcinoma | Female | <65 | I/II | Unknown | Unknown | SD |
| DOLPP1 | SNV | Missense_Mutation | novel | c.250N>T | p.Arg84Trp | p.R84W | Q86YN1 | protein_coding | deleterious(0) | probably_damaging(1) | TCGA-AP-A059-01 | Endometrium | uterine corpus endometrioid carcinoma | Female | >=65 | I/II | Unknown | Unknown | SD |
| DOLPP1 | SNV | Missense_Mutation | rs745414713 | c.640N>A | p.Val214Ile | p.V214I | Q86YN1 | protein_coding | tolerated(0.76) | benign(0.001) | TCGA-BS-A0U8-01 | Endometrium | uterine corpus endometrioid carcinoma | Female | <65 | III/IV | Chemotherapy | doxorubicin | SD |
| DOLPP1 | SNV | Missense_Mutation | rs370550987 | c.433N>A | p.Ala145Thr | p.A145T | Q86YN1 | protein_coding | tolerated(0.76) | benign(0.003) | TCGA-D1-A17M-01 | Endometrium | uterine corpus endometrioid carcinoma | Female | <65 | I/II | Unknown | Unknown | SD |
| DOLPP1 | SNV | Missense_Mutation | rs770551586 | c.136G>A | p.Gly46Ser | p.G46S | Q86YN1 | protein_coding | tolerated(0.35) | benign(0.028) | TCGA-EO-A3AZ-01 | Endometrium | uterine corpus endometrioid carcinoma | Female | >=65 | I/II | Unknown | Unknown | SD |
| DOLPP1 | SNV | Missense_Mutation | novel | c.280N>T | p.Gly94Cys | p.G94C | Q86YN1 | protein_coding | tolerated(0.18) | benign(0.421) | TCGA-34-2604-01 | Lung | lung squamous cell carcinoma | Female | >=65 | I/II | Unknown | Unknown | SD |
| DOLPP1 | SNV | Missense_Mutation | c.692G>A | p.Arg231His | p.R231H | Q86YN1 | protein_coding | deleterious(0) | probably_damaging(0.988) | TCGA-BR-8078-01 | Stomach | stomach adenocarcinoma | Female | >=65 | I/II | Unknown | Unknown | SD | |
| DOLPP1 | SNV | Missense_Mutation | novel | c.448N>T | p.Val150Phe | p.V150F | Q86YN1 | protein_coding | deleterious(0) | probably_damaging(0.998) | TCGA-VQ-A91E-01 | Stomach | stomach adenocarcinoma | Female | >=65 | III/IV | Chemotherapy | fluorouracil | CR |
| Page: 1 |
Top |
Related drugs of malignant transformation related genes |
| Identification of chemicals and drugs interact with genes involved in malignant transfromation |
| (DGIdb 4.0) |
| Entrez ID | Symbol | Category | Interaction Types | Drug Claim Name | Drug Name | PMIDs |
| Page: 1 |

Copyright 2023-Present -The University of Texas Health Science Center at Houston |