| Tissue | Expression Dynamics | Abbreviation |
| Cervix | 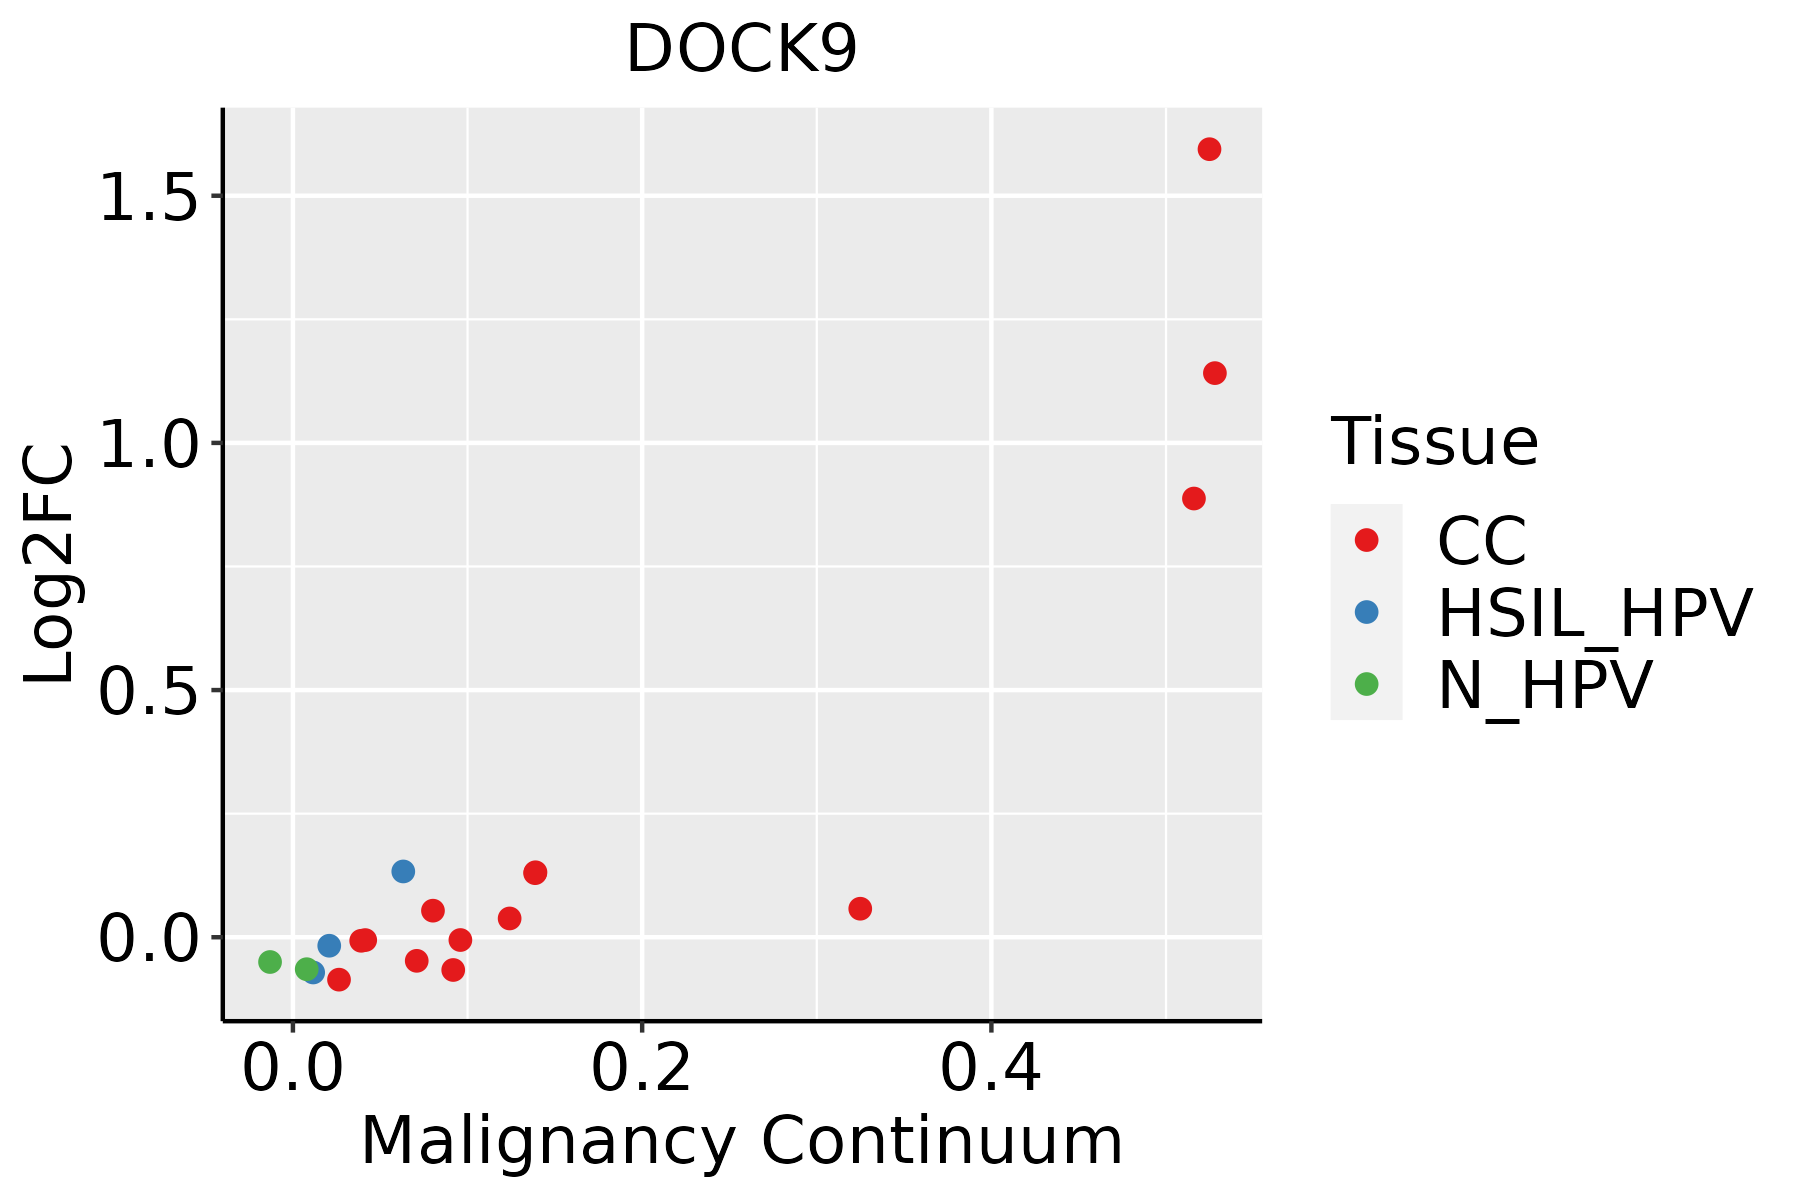 | CC: Cervix cancer |
| HSIL_HPV: HPV-infected high-grade squamous intraepithelial lesions |
| N_HPV: HPV-infected normal cervix |
| Colorectum (GSE201348) |  | FAP: Familial adenomatous polyposis |
| CRC: Colorectal cancer |
| Colorectum (HTA11) |  | AD: Adenomas |
| SER: Sessile serrated lesions |
| MSI-H: Microsatellite-high colorectal cancer |
| MSS: Microsatellite stable colorectal cancer |
| Esophagus |  | ESCC: Esophageal squamous cell carcinoma |
| HGIN: High-grade intraepithelial neoplasias |
| LGIN: Low-grade intraepithelial neoplasias |
| Lung | 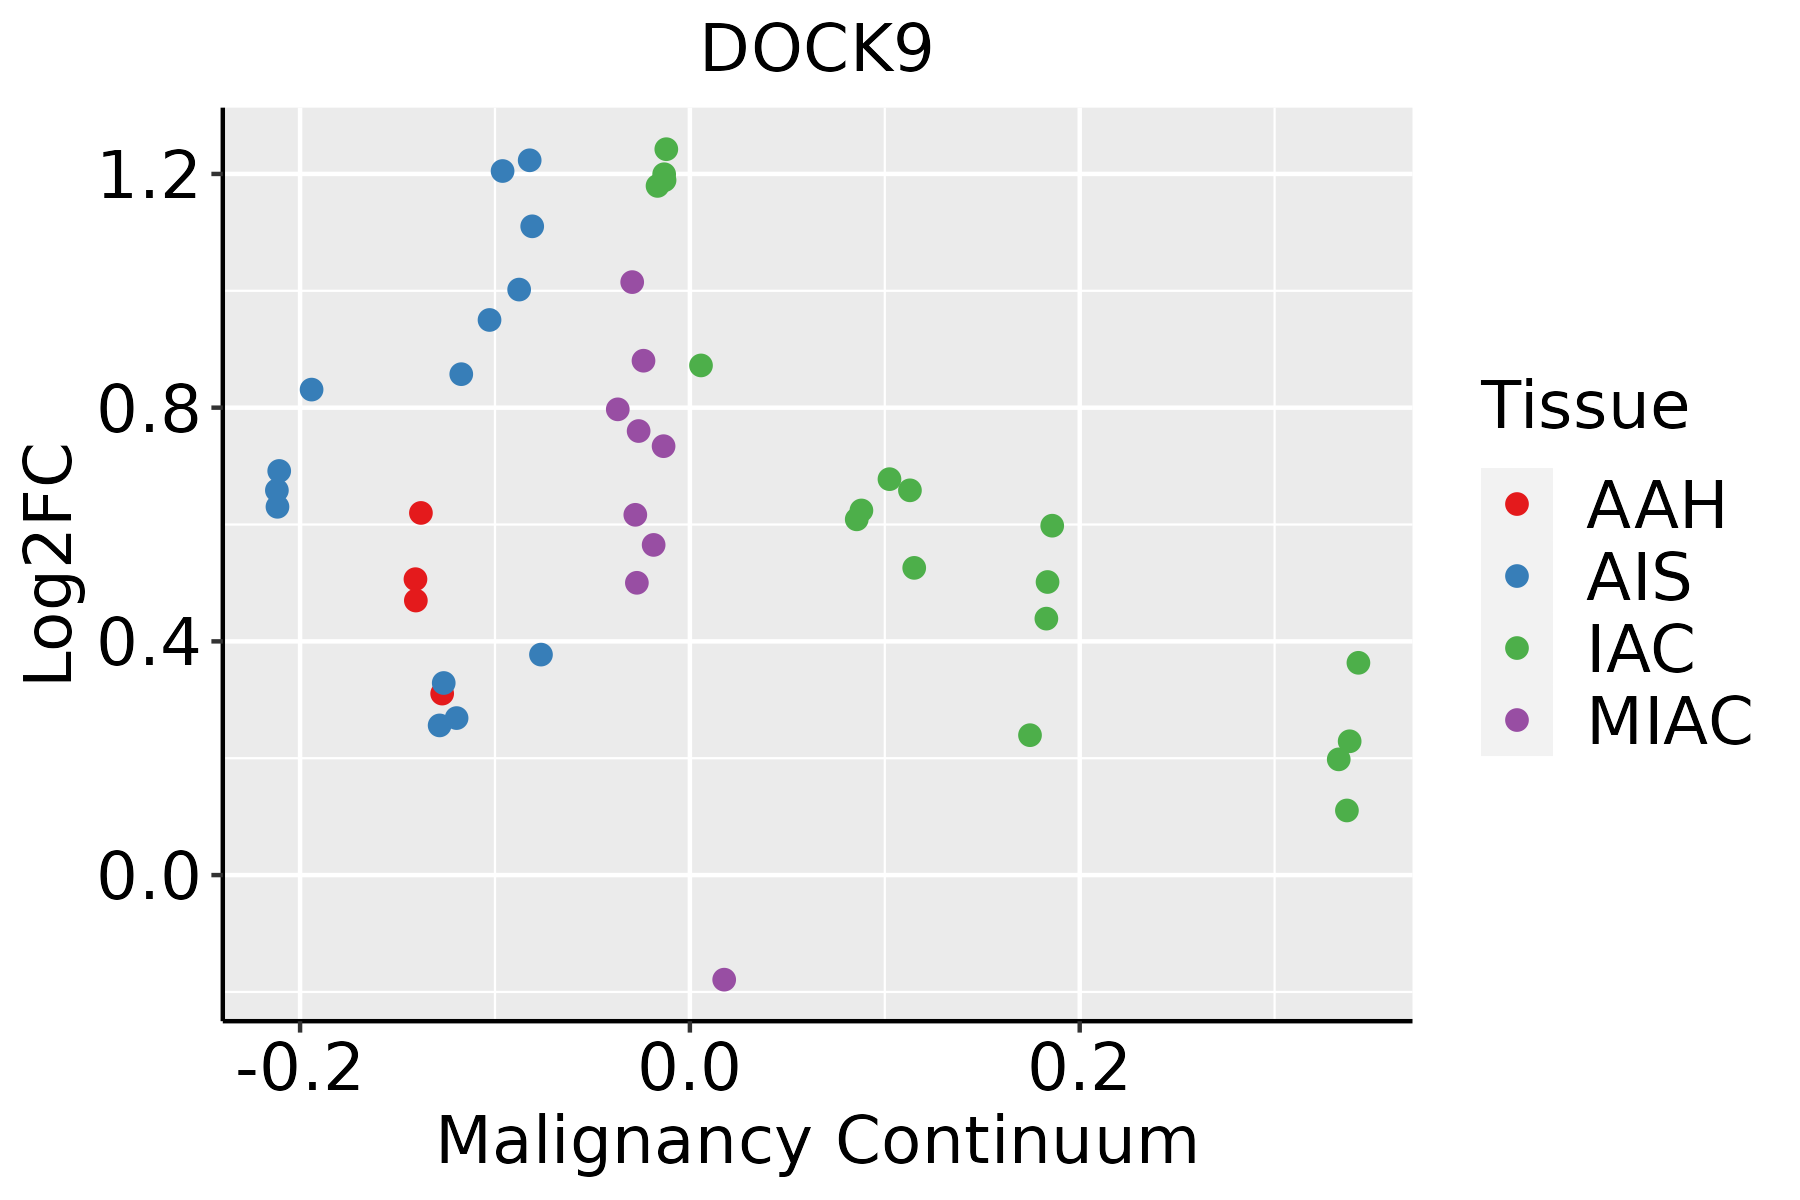 | AAH: Atypical adenomatous hyperplasia |
| AIS: Adenocarcinoma in situ |
| IAC: Invasive lung adenocarcinoma |
| MIA: Minimally invasive adenocarcinoma |
| Oral Cavity | 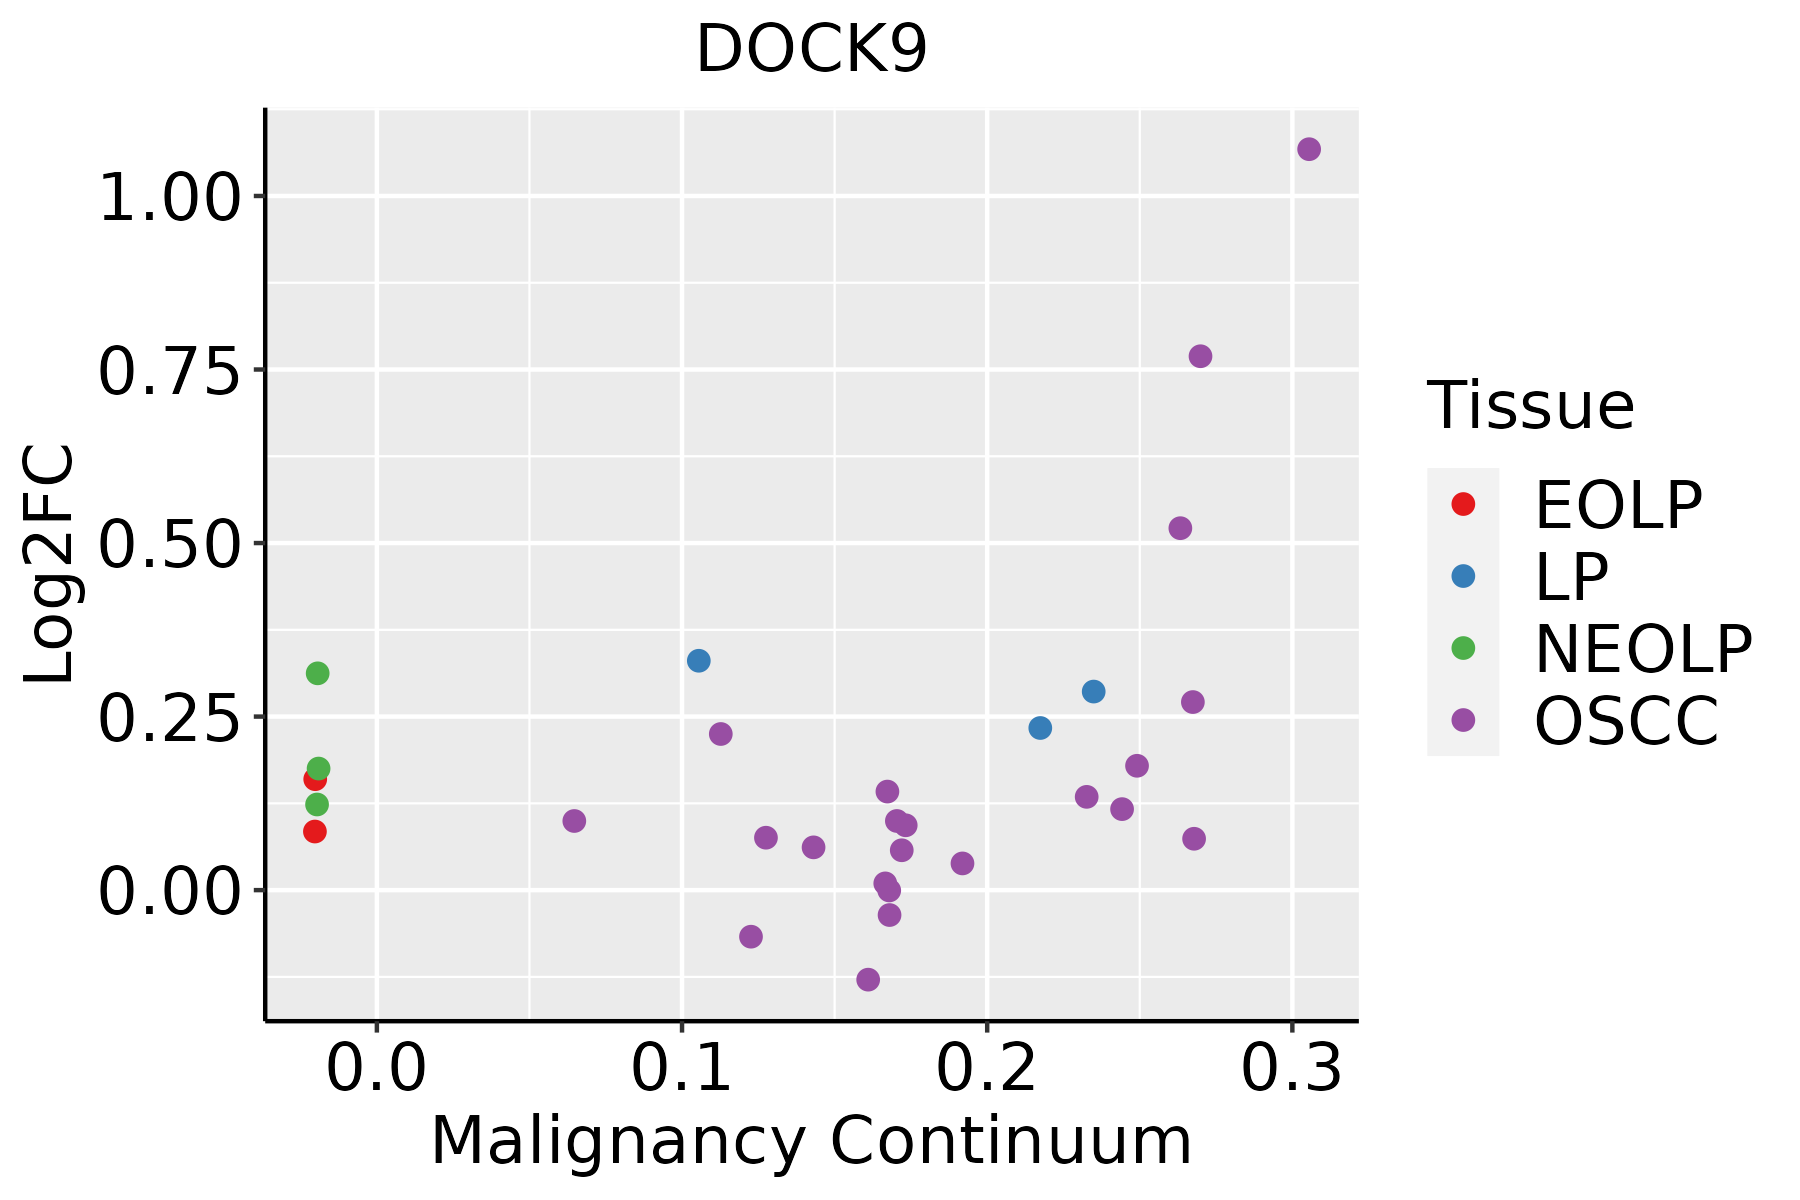 | EOLP: Erosive Oral lichen planus |
| LP: leukoplakia |
| NEOLP: Non-erosive oral lichen planus |
| OSCC: Oral squamous cell carcinoma |
| Prostate | 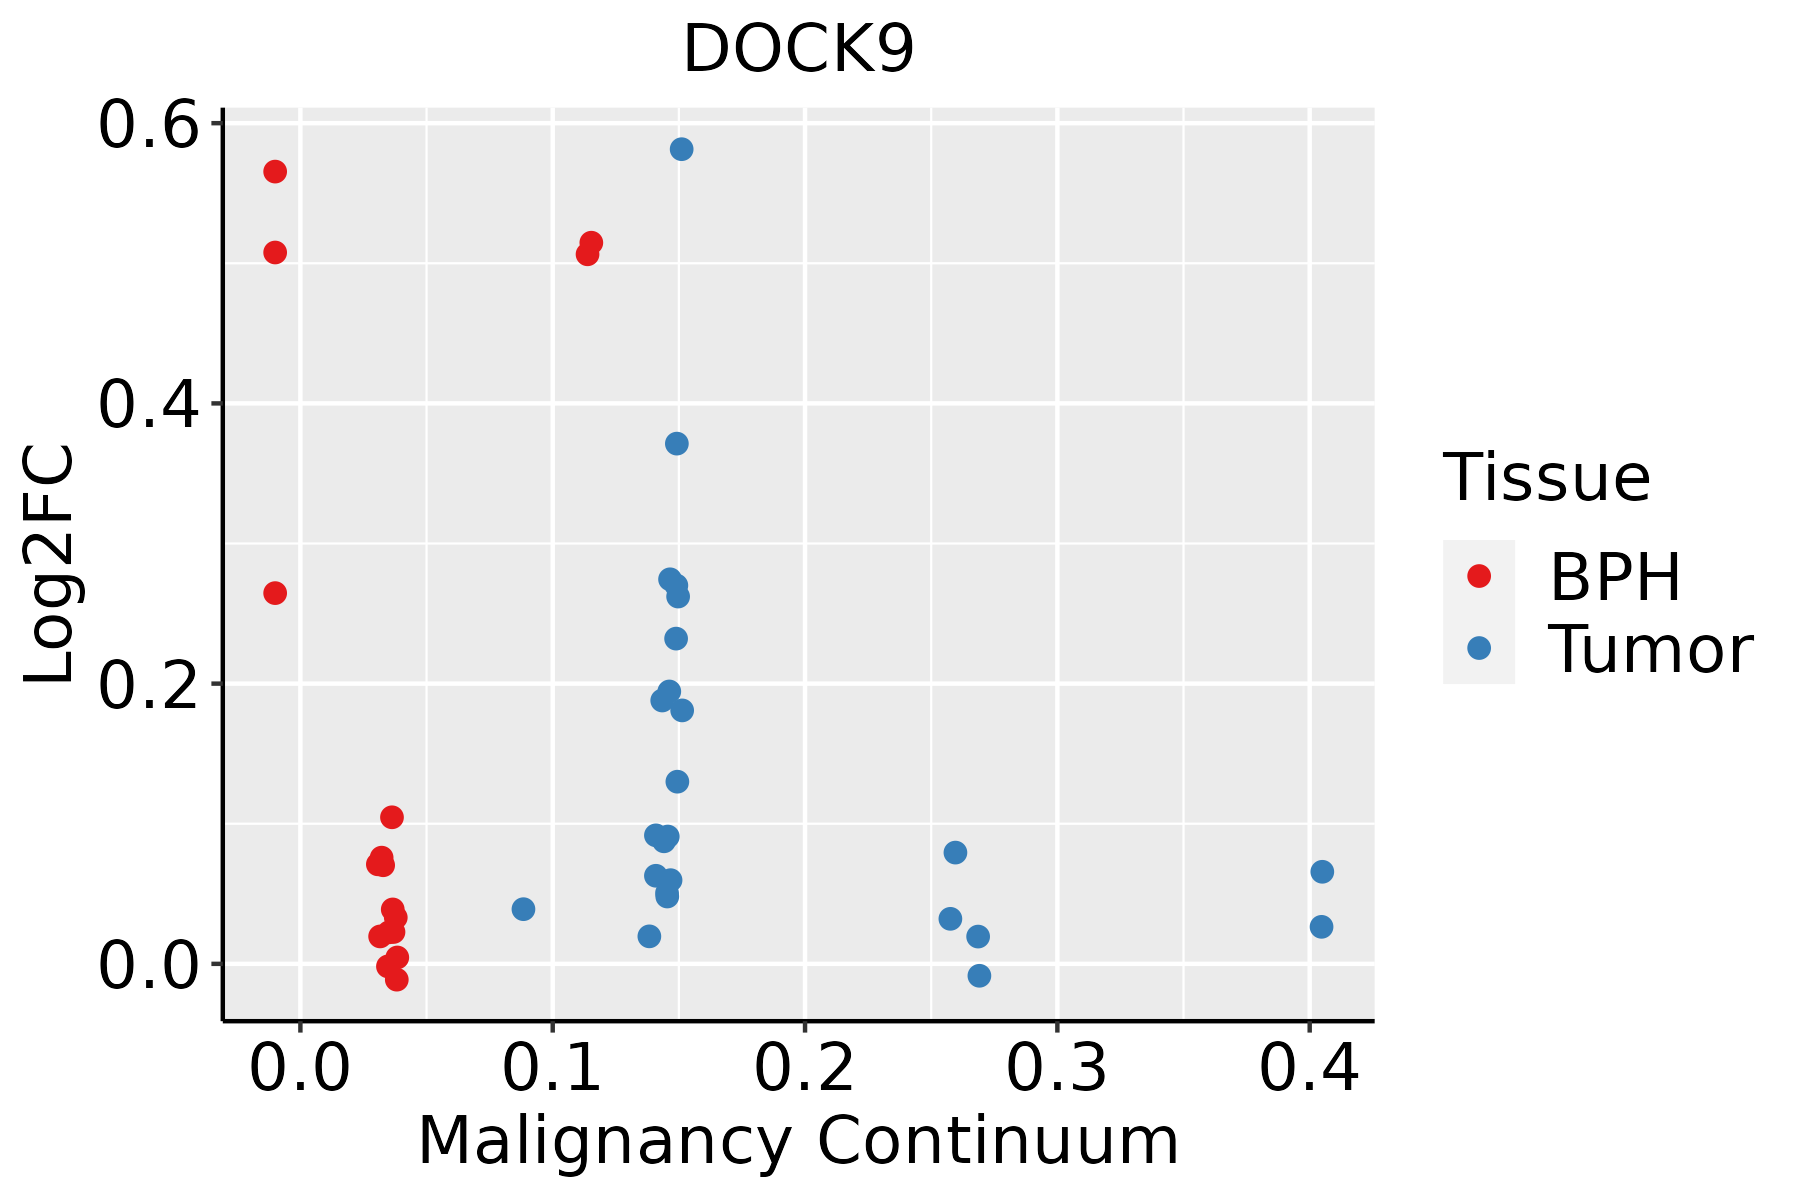 | BPH: Benign Prostatic Hyperplasia |
| Thyroid |  | ATC: Anaplastic thyroid cancer |
| HT: Hashimoto's thyroiditis |
| PTC: Papillary thyroid cancer |
| GO ID | Tissue | Disease Stage | Description | Gene Ratio | Bg Ratio | pvalue | p.adjust | Count |
| GO:00430877 | Cervix | CC | regulation of GTPase activity | 79/2311 | 348/18723 | 4.21e-08 | 2.60e-06 | 79 |
| GO:00435476 | Cervix | CC | positive regulation of GTPase activity | 53/2311 | 255/18723 | 8.72e-05 | 1.16e-03 | 53 |
| GO:0043087 | Colorectum | AD | regulation of GTPase activity | 110/3918 | 348/18723 | 1.64e-06 | 5.03e-05 | 110 |
| GO:0043547 | Colorectum | AD | positive regulation of GTPase activity | 75/3918 | 255/18723 | 7.95e-04 | 7.91e-03 | 75 |
| GO:00430872 | Colorectum | MSS | regulation of GTPase activity | 101/3467 | 348/18723 | 1.00e-06 | 3.46e-05 | 101 |
| GO:00435471 | Colorectum | MSS | positive regulation of GTPase activity | 68/3467 | 255/18723 | 7.97e-04 | 8.38e-03 | 68 |
| GO:00430873 | Colorectum | FAP | regulation of GTPase activity | 85/2622 | 348/18723 | 1.20e-07 | 7.68e-06 | 85 |
| GO:00435472 | Colorectum | FAP | positive regulation of GTPase activity | 61/2622 | 255/18723 | 1.39e-05 | 3.73e-04 | 61 |
| GO:00430874 | Colorectum | CRC | regulation of GTPase activity | 69/2078 | 348/18723 | 1.11e-06 | 6.69e-05 | 69 |
| GO:00435473 | Colorectum | CRC | positive regulation of GTPase activity | 49/2078 | 255/18723 | 8.67e-05 | 1.77e-03 | 49 |
| GO:004308715 | Esophagus | ESCC | regulation of GTPase activity | 183/8552 | 348/18723 | 5.34e-03 | 2.00e-02 | 183 |
| GO:00430876 | Lung | IAC | regulation of GTPase activity | 67/2061 | 348/18723 | 3.43e-06 | 1.44e-04 | 67 |
| GO:00435475 | Lung | IAC | positive regulation of GTPase activity | 48/2061 | 255/18723 | 1.40e-04 | 2.60e-03 | 48 |
| GO:004308711 | Lung | AIS | regulation of GTPase activity | 65/1849 | 348/18723 | 3.35e-07 | 2.83e-05 | 65 |
| GO:004354711 | Lung | AIS | positive regulation of GTPase activity | 44/1849 | 255/18723 | 1.74e-04 | 3.64e-03 | 44 |
| GO:004308721 | Lung | MIAC | regulation of GTPase activity | 41/967 | 348/18723 | 7.39e-07 | 1.08e-04 | 41 |
| GO:004354721 | Lung | MIAC | positive regulation of GTPase activity | 31/967 | 255/18723 | 8.63e-06 | 7.38e-04 | 31 |
| GO:004308710 | Oral cavity | OSCC | regulation of GTPase activity | 165/7305 | 348/18723 | 7.94e-04 | 4.27e-03 | 165 |
| GO:004308722 | Oral cavity | NEOLP | regulation of GTPase activity | 54/2005 | 348/18723 | 3.36e-03 | 2.00e-02 | 54 |
| GO:00430879 | Prostate | BPH | regulation of GTPase activity | 88/3107 | 348/18723 | 2.04e-05 | 2.49e-04 | 88 |
| Hugo Symbol | Variant Class | Variant Classification | dbSNP RS | HGVSc | HGVSp | HGVSp Short | SWISSPROT | BIOTYPE | SIFT | PolyPhen | Tumor Sample Barcode | Tissue | Histology | Sex | Age | Stage | Therapy Types | Drugs | Outcome |
| DOCK9 | SNV | Missense_Mutation | rs752448425 | c.3494A>C | p.Tyr1165Ser | p.Y1165S | Q9BZ29 | protein_coding | deleterious(0) | probably_damaging(0.999) | TCGA-A2-A04Q-01 | Breast | breast invasive carcinoma | Female | <65 | I/II | Chemotherapy | adriamycin | SD |
| DOCK9 | SNV | Missense_Mutation | | c.1778N>T | p.Ser593Leu | p.S593L | Q9BZ29 | protein_coding | tolerated(0.33) | benign(0) | TCGA-AC-A23H-01 | Breast | breast invasive carcinoma | Female | >=65 | I/II | Unknown | Unknown | PD |
| DOCK9 | SNV | Missense_Mutation | rs758650602 | c.3701N>A | p.Ser1234Tyr | p.S1234Y | Q9BZ29 | protein_coding | deleterious(0.01) | benign(0.272) | TCGA-AN-A046-01 | Breast | breast invasive carcinoma | Female | >=65 | I/II | Unknown | Unknown | SD |
| DOCK9 | SNV | Missense_Mutation | novel | c.6057C>A | p.Phe2019Leu | p.F2019L | Q9BZ29 | protein_coding | deleterious(0) | probably_damaging(0.994) | TCGA-AN-A049-01 | Breast | breast invasive carcinoma | Female | <65 | I/II | Unknown | Unknown | SD |
| DOCK9 | SNV | Missense_Mutation | | c.2406G>T | p.Trp802Cys | p.W802C | Q9BZ29 | protein_coding | deleterious(0) | probably_damaging(0.999) | TCGA-AN-A0FW-01 | Breast | breast invasive carcinoma | Female | >=65 | III/IV | Unknown | Unknown | SD |
| DOCK9 | SNV | Missense_Mutation | | c.5637N>T | p.Leu1879Phe | p.L1879F | Q9BZ29 | protein_coding | deleterious(0.02) | possibly_damaging(0.622) | TCGA-BH-A0B4-01 | Breast | breast invasive carcinoma | Male | >=65 | III/IV | Hormone Therapy | tamoxiphen | SD |
| DOCK9 | SNV | Missense_Mutation | novel | c.6052G>A | p.Val2018Ile | p.V2018I | Q9BZ29 | protein_coding | tolerated(1) | benign(0.042) | TCGA-BH-A0BR-01 | Breast | breast invasive carcinoma | Female | <65 | I/II | Unknown | Unknown | SD |
| DOCK9 | SNV | Missense_Mutation | rs752448425 | c.3494N>C | p.Tyr1165Ser | p.Y1165S | Q9BZ29 | protein_coding | deleterious(0) | probably_damaging(0.999) | TCGA-BH-A1EX-01 | Breast | breast invasive carcinoma | Female | >=65 | I/II | Unknown | Unknown | PD |
| DOCK9 | SNV | Missense_Mutation | rs761997091 | c.451G>A | p.Val151Ile | p.V151I | Q9BZ29 | protein_coding | tolerated(0.31) | benign(0.012) | TCGA-C8-A131-01 | Breast | breast invasive carcinoma | Female | >=65 | III/IV | Chemotherapy | 5-fluorouracil | CR |
| DOCK9 | SNV | Missense_Mutation | | c.3826G>T | p.Asp1276Tyr | p.D1276Y | Q9BZ29 | protein_coding | deleterious(0) | benign(0.041) | TCGA-D8-A1J8-01 | Breast | breast invasive carcinoma | Female | >=65 | I/II | Hormone Therapy | nolvadex | SD |


