
|
|||||
|
 | |
| |
| |
| |
| |
| |
|
Gene: DOCK8 |
Gene summary for DOCK8 |
| Gene information | Species | Human | Gene symbol | DOCK8 | Gene ID | 81704 |
| Gene name | dedicator of cytokinesis 8 | |
| Gene Alias | HEL-205 | |
| Cytomap | 9p24.3 | |
| Gene Type | protein-coding | GO ID | GO:0001767 | UniProtAcc | Q8NF50 |
Top |
Malignant transformation analysis |
| Identification of the aberrant gene expression in precancerous and cancerous lesions by comparing the gene expression of stem-like cells in diseased tissues with normal stem cells |
| Entrez ID | Symbol | Replicates | Species | Organ | Tissue | Adj P-value | Log2FC | Malignancy |
| 81704 | DOCK8 | RNA-P6T1-P6T1-1 | Human | Lung | MIAC | 4.84e-04 | 8.73e-01 | -0.0238 |
| 81704 | DOCK8 | RNA-P6T1-P6T1-2 | Human | Lung | MIAC | 5.60e-04 | 7.99e-01 | -0.0186 |
| 81704 | DOCK8 | RNA-P6T1-P6T1-3 | Human | Lung | MIAC | 5.90e-04 | 8.42e-01 | -0.0296 |
| 81704 | DOCK8 | RNA-P6T1-P6T1-4 | Human | Lung | MIAC | 3.99e-07 | 7.93e-01 | -0.0263 |
| Page: 1 |
| Tissue | Expression Dynamics | Abbreviation |
| Lung | 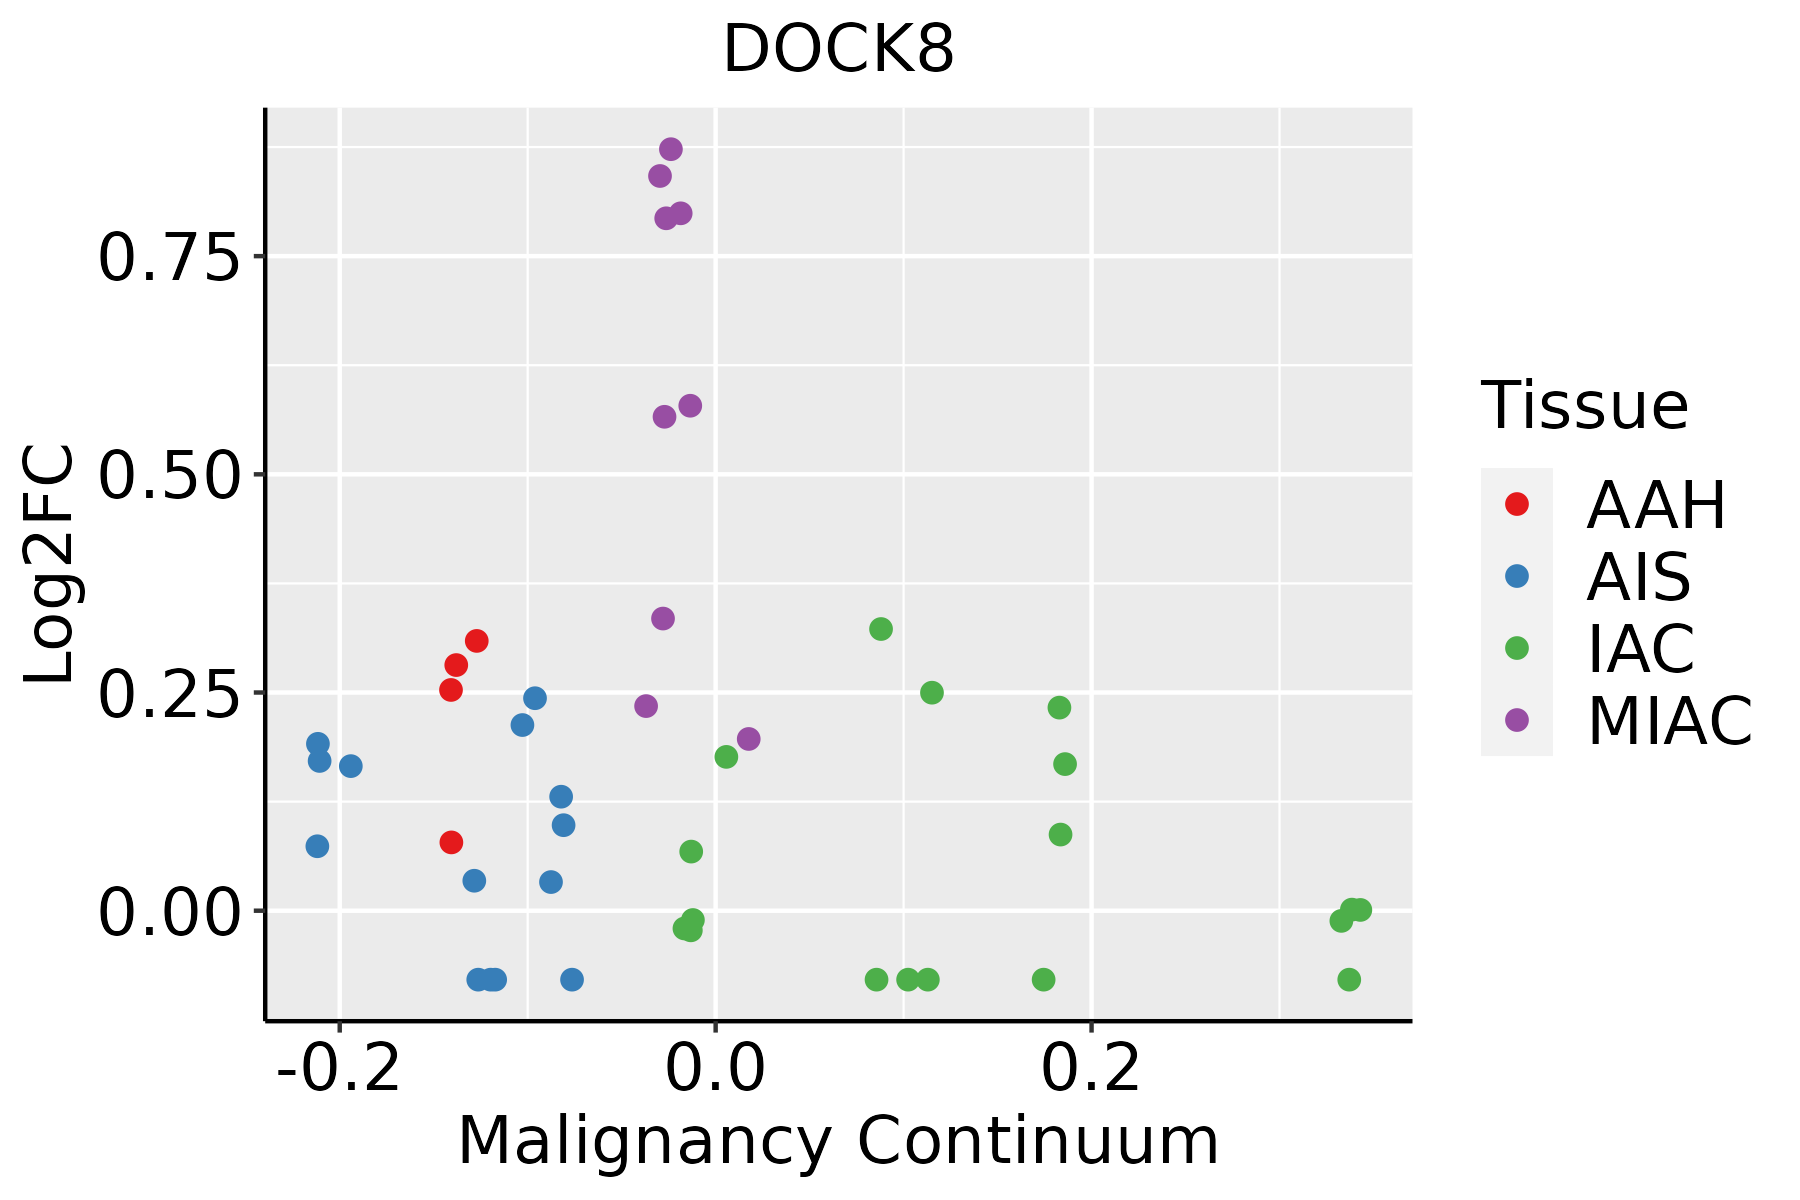 | AAH: Atypical adenomatous hyperplasia |
| AIS: Adenocarcinoma in situ | ||
| IAC: Invasive lung adenocarcinoma | ||
| MIA: Minimally invasive adenocarcinoma |
| ∗log2FC in expression of this searched gene in stem-like cells from each diseased tissue sample relative to stem-like cells in normal samples in each tissue plotted against the malignancy continuum. Samples are colored based on if they are from different disease stage. |
Top |
Malignant transformation related pathway analysis |
| Find out the enriched GO biological processes and KEGG pathways involved in transition from healthy to precancer to cancer |
| Tissue | Disease Stage | Enriched GO biological Processes |
| Colorectum | AD |  |
| Colorectum | SER |  |
| Colorectum | MSS |  |
| Colorectum | MSI-H |  |
| Colorectum | FAP |  |
| ∗Top 15 enriched GO BP terms are showed in the bar plot of each disease state in each tissue. Each row represents a significant GO biological process which is colored according to the -log10(p.adjust). |
| Page: 1 2 3 4 5 6 7 8 9 |
| GO ID | Tissue | Disease Stage | Description | Gene Ratio | Bg Ratio | pvalue | p.adjust | Count |
| GO:003001031 | Lung | MIAC | establishment of cell polarity | 27/967 | 143/18723 | 4.16e-09 | 4.27e-06 | 27 |
| GO:000716332 | Lung | MIAC | establishment or maintenance of cell polarity | 34/967 | 218/18723 | 7.70e-09 | 4.94e-06 | 34 |
| GO:004308721 | Lung | MIAC | regulation of GTPase activity | 41/967 | 348/18723 | 7.39e-07 | 1.08e-04 | 41 |
| GO:004578523 | Lung | MIAC | positive regulation of cell adhesion | 47/967 | 437/18723 | 1.62e-06 | 2.10e-04 | 47 |
| GO:005105621 | Lung | MIAC | regulation of small GTPase mediated signal transduction | 35/967 | 302/18723 | 6.81e-06 | 6.35e-04 | 35 |
| GO:004354721 | Lung | MIAC | positive regulation of GTPase activity | 31/967 | 255/18723 | 8.63e-06 | 7.38e-04 | 31 |
| GO:003287831 | Lung | MIAC | regulation of establishment or maintenance of cell polarity | 8/967 | 25/18723 | 2.42e-05 | 1.53e-03 | 8 |
| GO:200011431 | Lung | MIAC | regulation of establishment of cell polarity | 7/967 | 22/18723 | 8.25e-05 | 3.75e-03 | 7 |
| GO:004209811 | Lung | MIAC | T cell proliferation | 23/967 | 199/18723 | 2.57e-04 | 8.45e-03 | 23 |
| GO:004211011 | Lung | MIAC | T cell activation | 43/967 | 487/18723 | 4.40e-04 | 1.25e-02 | 43 |
| GO:002240721 | Lung | MIAC | regulation of cell-cell adhesion | 39/967 | 448/18723 | 1.04e-03 | 2.11e-02 | 39 |
| GO:002240911 | Lung | MIAC | positive regulation of cell-cell adhesion | 27/967 | 284/18723 | 1.71e-03 | 2.87e-02 | 27 |
| GO:000715911 | Lung | MIAC | leukocyte cell-cell adhesion | 32/967 | 371/18723 | 3.24e-03 | 4.27e-02 | 32 |
| Page: 1 |
| Pathway ID | Tissue | Disease Stage | Description | Gene Ratio | Bg Ratio | pvalue | p.adjust | qvalue | Count |
| Page: 1 |
Top |
Cell-cell communication analysis |
| Identification of potential cell-cell interactions between two cell types and their ligand-receptor pairs for different disease states |
| Ligand | Receptor | LRpair | Pathway | Tissue | Disease Stage |
| Page: 1 |
Top |
Single-cell gene regulatory network inference analysis |
| Find out the significant the regulons (TFs) and the target genes of each regulon across cell types for different disease states |
| TF | Cell Type | Tissue | Disease Stage | Target Gene | RSS | Regulon Activity |
| ∗The dot plots of a searched regulon are shown for all cell subpopulations in each disease state of each tissue based on the regulon specific score inferred using pySCENIC and by calculating the average expression. |
| Page: 1 |
Top |
Somatic mutation of malignant transformation related genes |
| Annotation of somatic variants for genes involved in malignant transformation |
| Hugo Symbol | Variant Class | Variant Classification | dbSNP RS | HGVSc | HGVSp | HGVSp Short | SWISSPROT | BIOTYPE | SIFT | PolyPhen | Tumor Sample Barcode | Tissue | Histology | Sex | Age | Stage | Therapy Types | Drugs | Outcome |
| DOCK8 | SNV | Missense_Mutation | rs765303604 | c.897N>G | p.Ile299Met | p.I299M | Q8NF50 | protein_coding | deleterious(0) | probably_damaging(0.935) | TCGA-AC-A23H-01 | Breast | breast invasive carcinoma | Female | >=65 | I/II | Unknown | Unknown | PD |
| DOCK8 | SNV | Missense_Mutation | novel | c.2351G>A | p.Arg784His | p.R784H | Q8NF50 | protein_coding | deleterious(0.02) | possibly_damaging(0.511) | TCGA-AC-A2BK-01 | Breast | breast invasive carcinoma | Female | >=65 | III/IV | Chemotherapy | cytoxan | CR |
| DOCK8 | SNV | Missense_Mutation | c.2048C>G | p.Ser683Cys | p.S683C | Q8NF50 | protein_coding | deleterious(0) | possibly_damaging(0.762) | TCGA-AC-A5XS-01 | Breast | breast invasive carcinoma | Female | >=65 | I/II | Hormone Therapy | femara | SD | |
| DOCK8 | SNV | Missense_Mutation | rs138519226 | c.2482G>A | p.Ala828Thr | p.A828T | Q8NF50 | protein_coding | deleterious(0.03) | benign(0.003) | TCGA-AC-A7VB-01 | Breast | breast invasive carcinoma | Female | <65 | I/II | Unknown | Unknown | SD |
| DOCK8 | SNV | Missense_Mutation | novel | c.3914N>C | p.Lys1305Thr | p.K1305T | Q8NF50 | protein_coding | deleterious(0) | probably_damaging(0.994) | TCGA-AN-A046-01 | Breast | breast invasive carcinoma | Female | >=65 | I/II | Unknown | Unknown | SD |
| DOCK8 | SNV | Missense_Mutation | novel | c.6005N>T | p.Ala2002Val | p.A2002V | Q8NF50 | protein_coding | tolerated(0.27) | benign(0.071) | TCGA-AN-A046-01 | Breast | breast invasive carcinoma | Female | >=65 | I/II | Unknown | Unknown | SD |
| DOCK8 | SNV | Missense_Mutation | c.2365G>T | p.Val789Leu | p.V789L | Q8NF50 | protein_coding | deleterious(0.02) | probably_damaging(0.971) | TCGA-AO-A0JD-01 | Breast | breast invasive carcinoma | Female | <65 | III/IV | Chemotherapy | cyclophosphamide | SD | |
| DOCK8 | SNV | Missense_Mutation | c.2428N>T | p.Ala810Ser | p.A810S | Q8NF50 | protein_coding | tolerated(0.34) | benign(0.044) | TCGA-B6-A0RP-01 | Breast | breast invasive carcinoma | Female | >=65 | I/II | Unknown | Unknown | PD | |
| DOCK8 | SNV | Missense_Mutation | c.5009C>G | p.Ala1670Gly | p.A1670G | Q8NF50 | protein_coding | deleterious(0.04) | possibly_damaging(0.888) | TCGA-BH-A0AW-01 | Breast | breast invasive carcinoma | Female | <65 | I/II | Chemotherapy | carboplatin | SD | |
| DOCK8 | SNV | Missense_Mutation | rs748909379 | c.761N>A | p.Arg254His | p.R254H | Q8NF50 | protein_coding | tolerated(0.18) | benign(0.072) | TCGA-D8-A1X7-01 | Breast | breast invasive carcinoma | Female | <65 | I/II | ChemotherapyHormone Therapy | doxorubicine+cyclophosphamide+tamoxifen | SD |
| Page: 1 2 3 4 5 6 7 8 9 10 11 12 13 14 15 16 17 18 19 20 21 22 23 24 25 26 |
Top |
Related drugs of malignant transformation related genes |
| Identification of chemicals and drugs interact with genes involved in malignant transfromation |
| (DGIdb 4.0) |
| Entrez ID | Symbol | Category | Interaction Types | Drug Claim Name | Drug Name | PMIDs |
| 81704 | DOCK8 | NA | carboplatin | CARBOPLATIN | 31616045 | |
| 81704 | DOCK8 | NA | gemcitabine | GEMCITABINE | 31616045 |
| Page: 1 |

Copyright 2023-Present -The University of Texas Health Science Center at Houston |