
|
|||||
|
 | |
| |
| |
| |
| |
| |
|
Gene: DOCK7 |
Gene summary for DOCK7 |
| Gene information | Species | Human | Gene symbol | DOCK7 | Gene ID | 85440 |
| Gene name | dedicator of cytokinesis 7 | |
| Gene Alias | DEE23 | |
| Cytomap | 1p31.3 | |
| Gene Type | protein-coding | GO ID | GO:0000226 | UniProtAcc | Q96N67 |
Top |
Malignant transformation analysis |
| Identification of the aberrant gene expression in precancerous and cancerous lesions by comparing the gene expression of stem-like cells in diseased tissues with normal stem cells |
| Entrez ID | Symbol | Replicates | Species | Organ | Tissue | Adj P-value | Log2FC | Malignancy |
| 85440 | DOCK7 | HTA11_3410_2000001011 | Human | Colorectum | AD | 1.34e-08 | -4.34e-01 | 0.0155 |
| 85440 | DOCK7 | HTA11_2487_2000001011 | Human | Colorectum | SER | 9.39e-03 | -3.67e-01 | -0.1808 |
| 85440 | DOCK7 | HTA11_3361_2000001011 | Human | Colorectum | AD | 1.23e-02 | -4.37e-01 | -0.1207 |
| 85440 | DOCK7 | HTA11_696_2000001011 | Human | Colorectum | AD | 4.35e-04 | -3.49e-01 | -0.1464 |
| 85440 | DOCK7 | HTA11_866_3004761011 | Human | Colorectum | AD | 8.70e-05 | -4.52e-01 | 0.096 |
| 85440 | DOCK7 | HTA11_7696_3000711011 | Human | Colorectum | AD | 2.01e-11 | -4.62e-01 | 0.0674 |
| 85440 | DOCK7 | HTA11_99999974143_84620 | Human | Colorectum | MSS | 4.50e-14 | -5.18e-01 | 0.3005 |
| 85440 | DOCK7 | A001-C-207 | Human | Colorectum | FAP | 9.14e-04 | -1.97e-01 | 0.1278 |
| 85440 | DOCK7 | A015-C-203 | Human | Colorectum | FAP | 1.32e-29 | -4.26e-01 | -0.1294 |
| 85440 | DOCK7 | A015-C-204 | Human | Colorectum | FAP | 6.35e-05 | -2.80e-01 | -0.0228 |
| 85440 | DOCK7 | A014-C-040 | Human | Colorectum | FAP | 4.51e-05 | -4.02e-01 | -0.1184 |
| 85440 | DOCK7 | A002-C-201 | Human | Colorectum | FAP | 5.28e-17 | -4.07e-01 | 0.0324 |
| 85440 | DOCK7 | A002-C-203 | Human | Colorectum | FAP | 5.40e-05 | -1.05e-01 | 0.2786 |
| 85440 | DOCK7 | A001-C-119 | Human | Colorectum | FAP | 5.78e-07 | -3.83e-01 | -0.1557 |
| 85440 | DOCK7 | A001-C-108 | Human | Colorectum | FAP | 4.13e-17 | -2.78e-01 | -0.0272 |
| 85440 | DOCK7 | A002-C-205 | Human | Colorectum | FAP | 7.00e-22 | -3.06e-01 | -0.1236 |
| 85440 | DOCK7 | A001-C-104 | Human | Colorectum | FAP | 1.39e-03 | -1.41e-01 | 0.0184 |
| 85440 | DOCK7 | A015-C-005 | Human | Colorectum | FAP | 6.85e-07 | -3.17e-01 | -0.0336 |
| 85440 | DOCK7 | A015-C-006 | Human | Colorectum | FAP | 3.23e-19 | -5.02e-01 | -0.0994 |
| 85440 | DOCK7 | A015-C-106 | Human | Colorectum | FAP | 4.80e-13 | -2.17e-01 | -0.0511 |
| Page: 1 2 3 4 5 6 7 |
| Tissue | Expression Dynamics | Abbreviation |
| Colorectum (GSE201348) |  | FAP: Familial adenomatous polyposis |
| CRC: Colorectal cancer | ||
| Colorectum (HTA11) |  | AD: Adenomas |
| SER: Sessile serrated lesions | ||
| MSI-H: Microsatellite-high colorectal cancer | ||
| MSS: Microsatellite stable colorectal cancer | ||
| Esophagus | 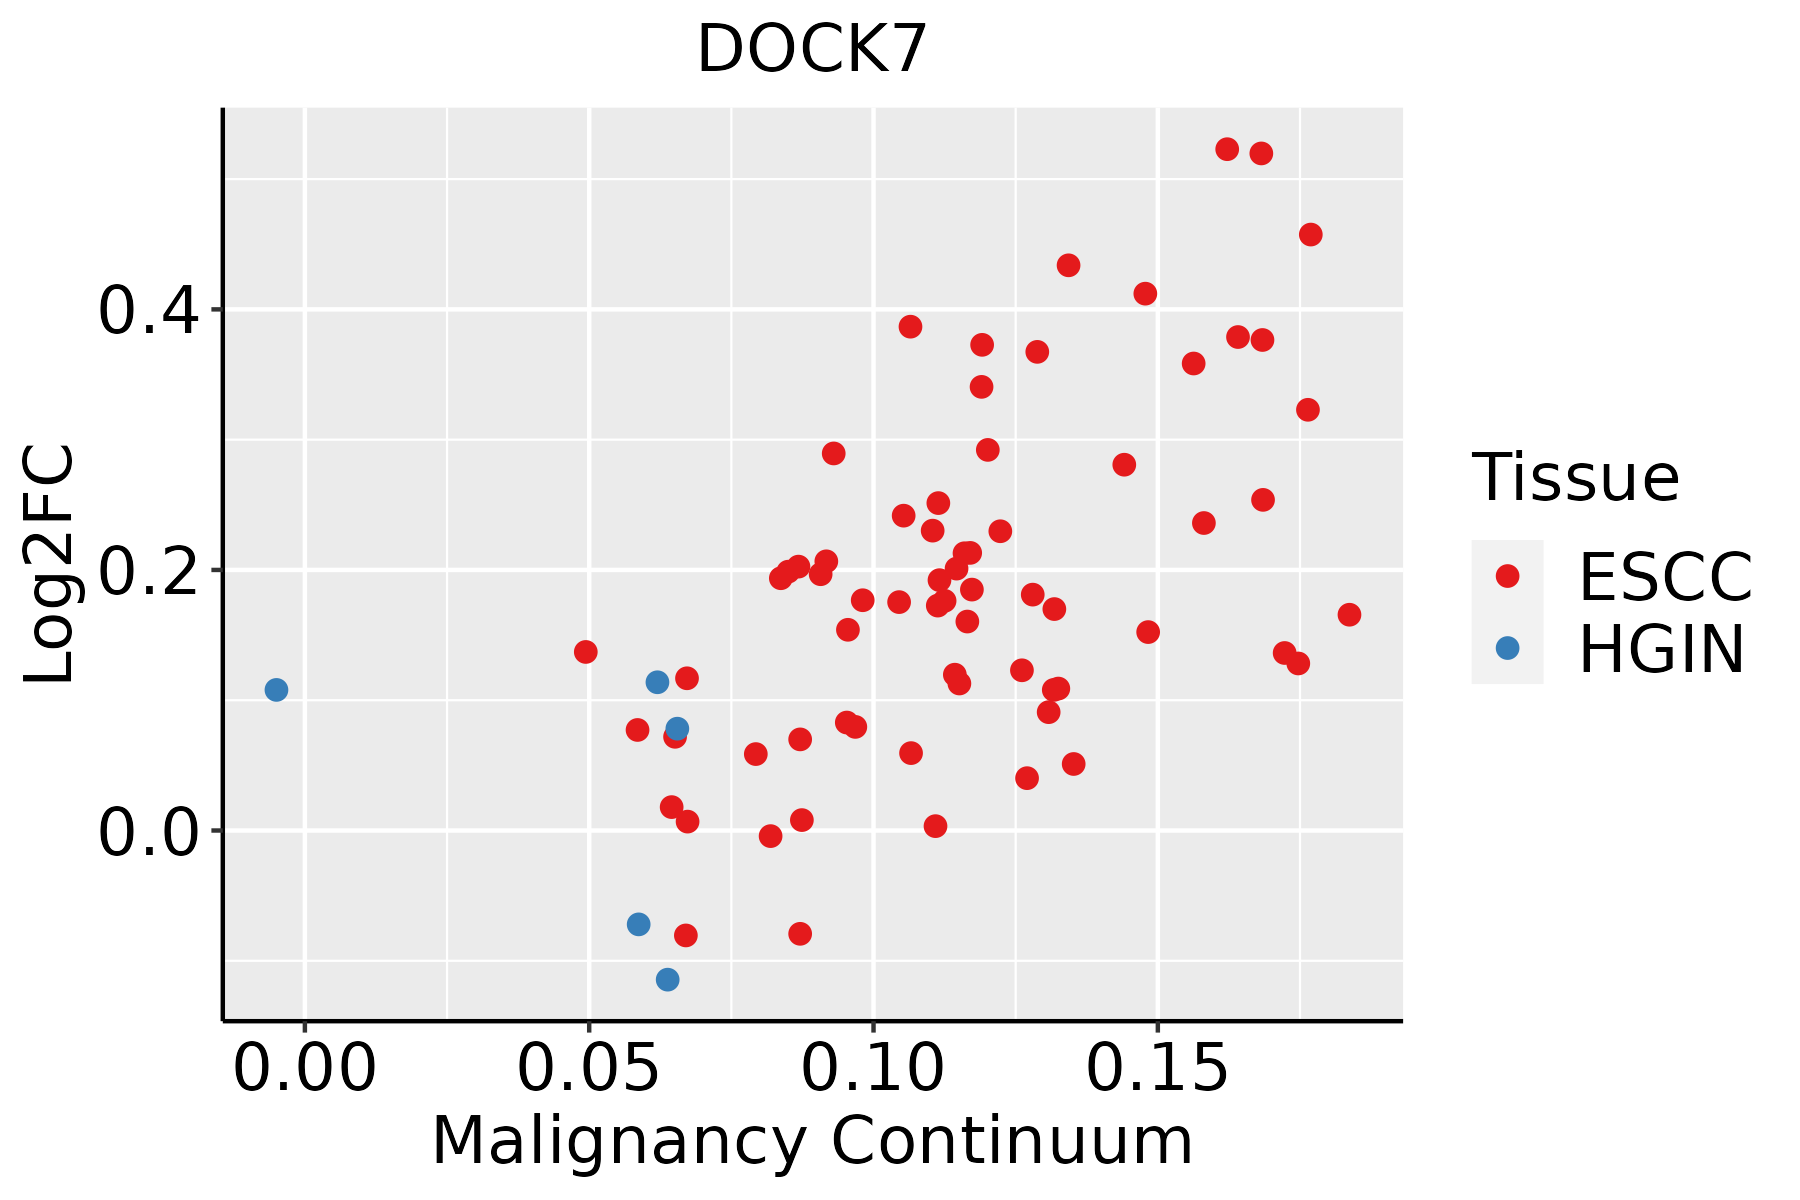 | ESCC: Esophageal squamous cell carcinoma |
| HGIN: High-grade intraepithelial neoplasias | ||
| LGIN: Low-grade intraepithelial neoplasias | ||
| Liver | 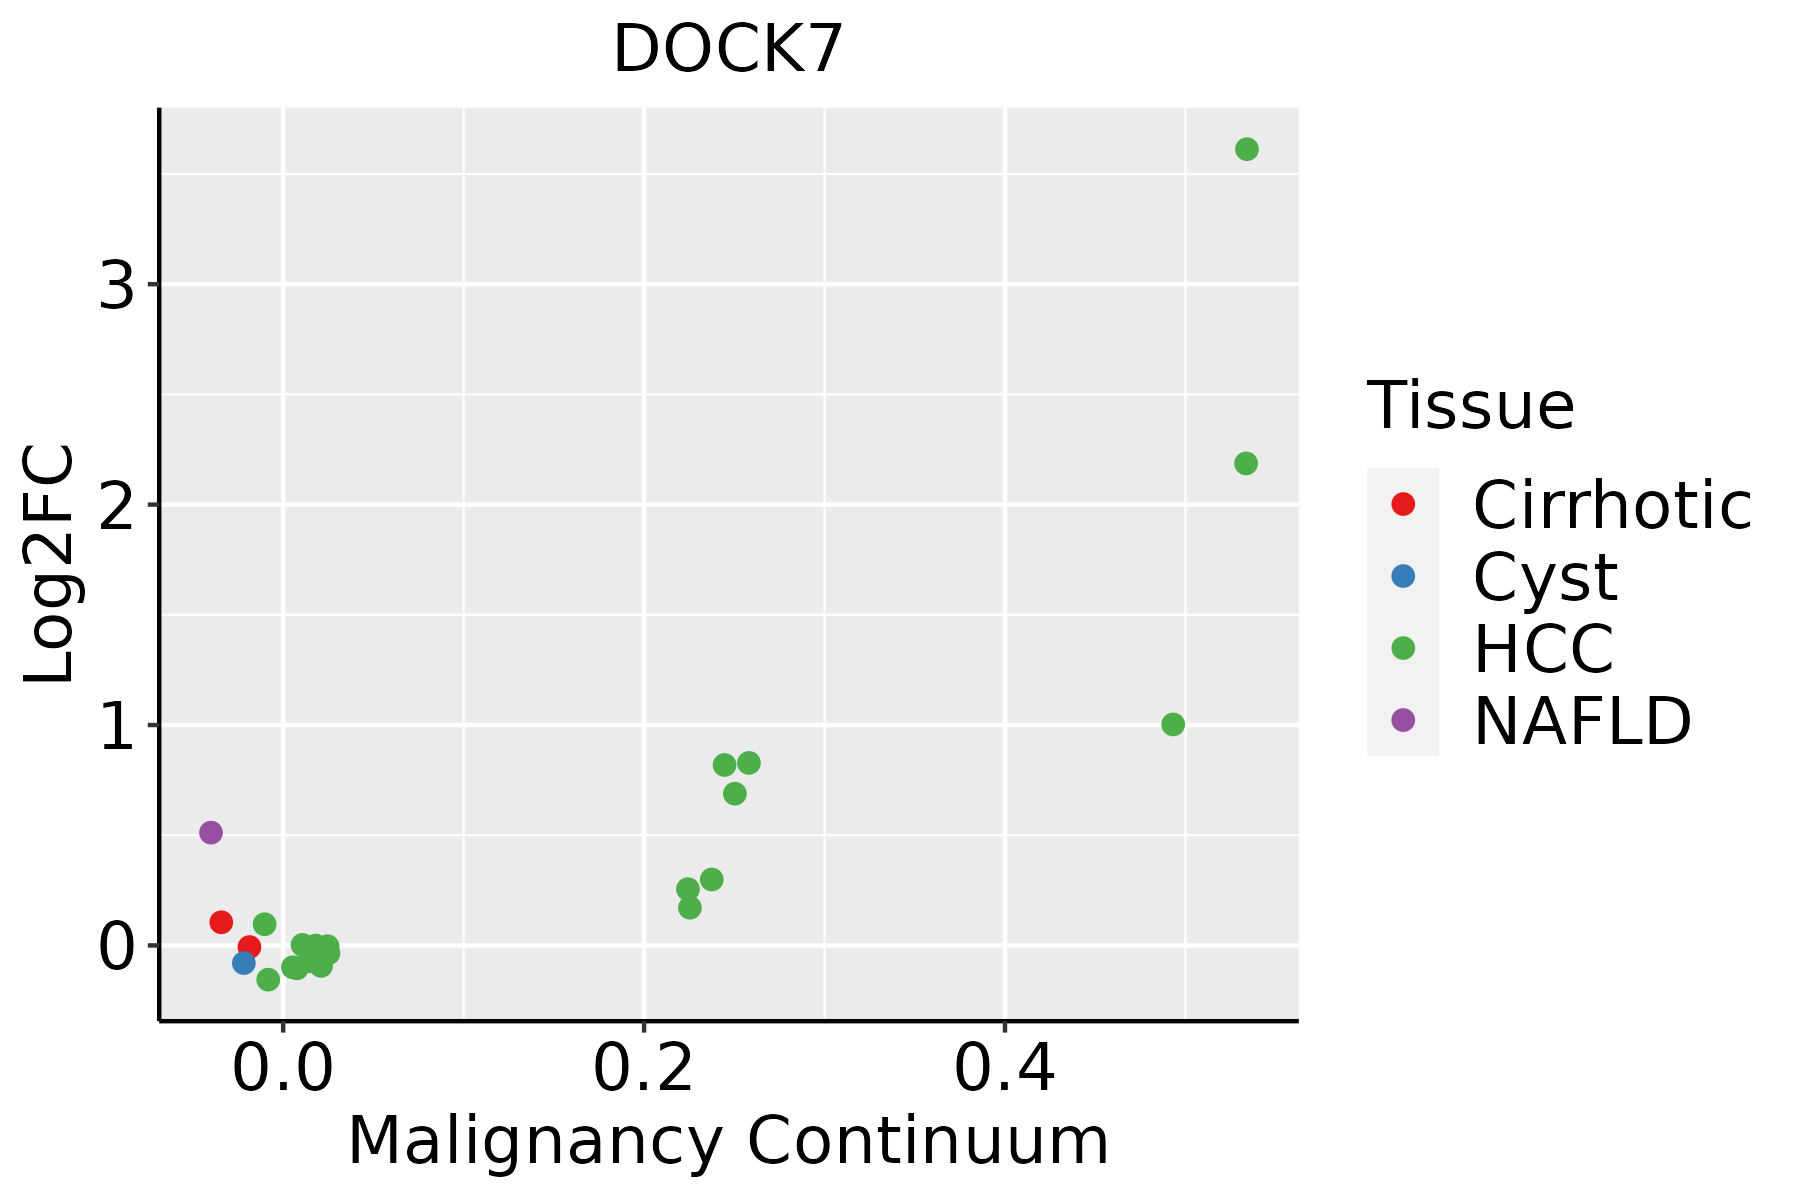 | HCC: Hepatocellular carcinoma |
| NAFLD: Non-alcoholic fatty liver disease | ||
| Oral Cavity |  | EOLP: Erosive Oral lichen planus |
| LP: leukoplakia | ||
| NEOLP: Non-erosive oral lichen planus | ||
| OSCC: Oral squamous cell carcinoma | ||
| Thyroid |  | ATC: Anaplastic thyroid cancer |
| HT: Hashimoto's thyroiditis | ||
| PTC: Papillary thyroid cancer |
| ∗log2FC in expression of this searched gene in stem-like cells from each diseased tissue sample relative to stem-like cells in normal samples in each tissue plotted against the malignancy continuum. Samples are colored based on if they are from different disease stage. |
Top |
Malignant transformation related pathway analysis |
| Find out the enriched GO biological processes and KEGG pathways involved in transition from healthy to precancer to cancer |
| Tissue | Disease Stage | Enriched GO biological Processes |
| Colorectum | AD |  |
| Colorectum | SER |  |
| Colorectum | MSS |  |
| Colorectum | MSI-H |  |
| Colorectum | FAP |  |
| ∗Top 15 enriched GO BP terms are showed in the bar plot of each disease state in each tissue. Each row represents a significant GO biological process which is colored according to the -log10(p.adjust). |
| Page: 1 2 3 4 5 6 7 8 9 |
| GO ID | Tissue | Disease Stage | Description | Gene Ratio | Bg Ratio | pvalue | p.adjust | Count |
| GO:0051656 | Colorectum | AD | establishment of organelle localization | 131/3918 | 390/18723 | 3.00e-09 | 2.06e-07 | 131 |
| GO:0007163 | Colorectum | AD | establishment or maintenance of cell polarity | 77/3918 | 218/18723 | 5.72e-07 | 2.08e-05 | 77 |
| GO:0043087 | Colorectum | AD | regulation of GTPase activity | 110/3918 | 348/18723 | 1.64e-06 | 5.03e-05 | 110 |
| GO:0007409 | Colorectum | AD | axonogenesis | 122/3918 | 418/18723 | 3.36e-05 | 6.15e-04 | 122 |
| GO:0030010 | Colorectum | AD | establishment of cell polarity | 50/3918 | 143/18723 | 6.90e-05 | 1.11e-03 | 50 |
| GO:0061564 | Colorectum | AD | axon development | 132/3918 | 467/18723 | 8.40e-05 | 1.31e-03 | 132 |
| GO:0043547 | Colorectum | AD | positive regulation of GTPase activity | 75/3918 | 255/18723 | 7.95e-04 | 7.91e-03 | 75 |
| GO:0018105 | Colorectum | AD | peptidyl-serine phosphorylation | 88/3918 | 315/18723 | 1.73e-03 | 1.43e-02 | 88 |
| GO:0050767 | Colorectum | AD | regulation of neurogenesis | 99/3918 | 364/18723 | 2.35e-03 | 1.82e-02 | 99 |
| GO:0018209 | Colorectum | AD | peptidyl-serine modification | 92/3918 | 338/18723 | 3.19e-03 | 2.36e-02 | 92 |
| GO:0007097 | Colorectum | AD | nuclear migration | 10/3918 | 20/18723 | 3.67e-03 | 2.60e-02 | 10 |
| GO:0051647 | Colorectum | AD | nucleus localization | 11/3918 | 24/18723 | 5.43e-03 | 3.55e-02 | 11 |
| GO:0106106 | Colorectum | AD | cold-induced thermogenesis | 43/3918 | 144/18723 | 7.05e-03 | 4.31e-02 | 43 |
| GO:0120161 | Colorectum | AD | regulation of cold-induced thermogenesis | 43/3918 | 144/18723 | 7.05e-03 | 4.31e-02 | 43 |
| GO:1990845 | Colorectum | AD | adaptive thermogenesis | 46/3918 | 157/18723 | 7.97e-03 | 4.73e-02 | 46 |
| GO:00516561 | Colorectum | SER | establishment of organelle localization | 100/2897 | 390/18723 | 1.11e-07 | 6.79e-06 | 100 |
| GO:00071631 | Colorectum | SER | establishment or maintenance of cell polarity | 60/2897 | 218/18723 | 3.45e-06 | 1.33e-04 | 60 |
| GO:00430871 | Colorectum | SER | regulation of GTPase activity | 77/2897 | 348/18723 | 5.90e-04 | 8.07e-03 | 77 |
| GO:00300101 | Colorectum | SER | establishment of cell polarity | 37/2897 | 143/18723 | 8.72e-04 | 1.06e-02 | 37 |
| GO:00615641 | Colorectum | SER | axon development | 94/2897 | 467/18723 | 3.78e-03 | 3.13e-02 | 94 |
| Page: 1 2 3 4 5 6 7 8 9 10 |
| Pathway ID | Tissue | Disease Stage | Description | Gene Ratio | Bg Ratio | pvalue | p.adjust | qvalue | Count |
| Page: 1 |
Top |
Cell-cell communication analysis |
| Identification of potential cell-cell interactions between two cell types and their ligand-receptor pairs for different disease states |
| Ligand | Receptor | LRpair | Pathway | Tissue | Disease Stage |
| Page: 1 |
Top |
Single-cell gene regulatory network inference analysis |
| Find out the significant the regulons (TFs) and the target genes of each regulon across cell types for different disease states |
| TF | Cell Type | Tissue | Disease Stage | Target Gene | RSS | Regulon Activity |
| ∗The dot plots of a searched regulon are shown for all cell subpopulations in each disease state of each tissue based on the regulon specific score inferred using pySCENIC and by calculating the average expression. |
| Page: 1 |
Top |
Somatic mutation of malignant transformation related genes |
| Annotation of somatic variants for genes involved in malignant transformation |
| Hugo Symbol | Variant Class | Variant Classification | dbSNP RS | HGVSc | HGVSp | HGVSp Short | SWISSPROT | BIOTYPE | SIFT | PolyPhen | Tumor Sample Barcode | Tissue | Histology | Sex | Age | Stage | Therapy Types | Drugs | Outcome |
| DOCK7 | SNV | Missense_Mutation | c.1635C>G | p.Ile545Met | p.I545M | Q96N67 | protein_coding | deleterious(0.02) | possibly_damaging(0.582) | TCGA-A2-A0EU-01 | Breast | breast invasive carcinoma | Female | >=65 | I/II | Unknown | Unknown | SD | |
| DOCK7 | SNV | Missense_Mutation | c.1793C>A | p.Ala598Asp | p.A598D | Q96N67 | protein_coding | deleterious(0) | possibly_damaging(0.883) | TCGA-A2-A3XY-01 | Breast | breast invasive carcinoma | Female | <65 | I/II | Chemotherapy | adriamycin | PD | |
| DOCK7 | SNV | Missense_Mutation | c.1450G>T | p.Asp484Tyr | p.D484Y | Q96N67 | protein_coding | deleterious(0) | probably_damaging(0.999) | TCGA-AC-A23H-01 | Breast | breast invasive carcinoma | Female | >=65 | I/II | Unknown | Unknown | PD | |
| DOCK7 | SNV | Missense_Mutation | c.4728N>C | p.Glu1576Asp | p.E1576D | Q96N67 | protein_coding | tolerated(0.05) | possibly_damaging(0.666) | TCGA-AN-A0FJ-01 | Breast | breast invasive carcinoma | Female | <65 | III/IV | Unknown | Unknown | SD | |
| DOCK7 | SNV | Missense_Mutation | rs780945471 | c.2927C>T | p.Thr976Met | p.T976M | Q96N67 | protein_coding | tolerated(0.11) | benign(0.073) | TCGA-AO-A0J5-01 | Breast | breast invasive carcinoma | Female | <65 | III/IV | Other, specify in notesBisphosphonate | zoledronic | PD |
| DOCK7 | SNV | Missense_Mutation | c.4148G>T | p.Ser1383Ile | p.S1383I | Q96N67 | protein_coding | tolerated(0.08) | possibly_damaging(0.755) | TCGA-AO-A0JM-01 | Breast | breast invasive carcinoma | Female | <65 | I/II | Chemotherapy | doxorubicin | SD | |
| DOCK7 | SNV | Missense_Mutation | c.4054N>G | p.Ser1352Ala | p.S1352A | Q96N67 | protein_coding | tolerated(0.21) | benign(0.03) | TCGA-AR-A0TW-01 | Breast | breast invasive carcinoma | Female | <65 | III/IV | Chemotherapy | doxorubicin | PD | |
| DOCK7 | SNV | Missense_Mutation | c.3043N>G | p.Met1015Val | p.M1015V | Q96N67 | protein_coding | deleterious(0.01) | benign(0.036) | TCGA-AR-A1AX-01 | Breast | breast invasive carcinoma | Female | <65 | I/II | Chemotherapy | cytoxan | SD | |
| DOCK7 | SNV | Missense_Mutation | novel | c.5660N>G | p.Ser1887Cys | p.S1887C | Q96N67 | protein_coding | deleterious(0) | probably_damaging(0.997) | TCGA-C8-A274-01 | Breast | breast invasive carcinoma | Female | <65 | I/II | Hormone Therapy | tamoxiphen | SD |
| DOCK7 | SNV | Missense_Mutation | novel | c.6305N>A | p.Arg2102Lys | p.R2102K | Q96N67 | protein_coding | tolerated(0.09) | benign(0.281) | TCGA-C8-A275-01 | Breast | breast invasive carcinoma | Female | <65 | I/II | Unknown | Unknown | SD |
| Page: 1 2 3 4 5 6 7 8 9 10 11 12 13 14 15 16 17 18 19 20 21 22 23 |
Top |
Related drugs of malignant transformation related genes |
| Identification of chemicals and drugs interact with genes involved in malignant transfromation |
| (DGIdb 4.0) |
| Entrez ID | Symbol | Category | Interaction Types | Drug Claim Name | Drug Name | PMIDs |
| Page: 1 |

Copyright 2023-Present -The University of Texas Health Science Center at Houston |