
|
|||||
|
 | |
| |
| |
| |
| |
| |
|
Gene: DOCK4 |
Gene summary for DOCK4 |
| Gene information | Species | Human | Gene symbol | DOCK4 | Gene ID | 9732 |
| Gene name | dedicator of cytokinesis 4 | |
| Gene Alias | DOCK4 | |
| Cytomap | 7q31.1 | |
| Gene Type | protein-coding | GO ID | GO:0003008 | UniProtAcc | Q8N1I0 |
Top |
Malignant transformation analysis |
| Identification of the aberrant gene expression in precancerous and cancerous lesions by comparing the gene expression of stem-like cells in diseased tissues with normal stem cells |
| Entrez ID | Symbol | Replicates | Species | Organ | Tissue | Adj P-value | Log2FC | Malignancy |
| 9732 | DOCK4 | AEH-subject1 | Human | Endometrium | AEH | 1.20e-12 | 3.53e-01 | -0.3059 |
| 9732 | DOCK4 | AEH-subject2 | Human | Endometrium | AEH | 8.74e-04 | 2.57e-01 | -0.2525 |
| 9732 | DOCK4 | AEH-subject3 | Human | Endometrium | AEH | 3.64e-03 | 1.47e-01 | -0.2576 |
| 9732 | DOCK4 | AEH-subject4 | Human | Endometrium | AEH | 6.14e-20 | 6.83e-01 | -0.2657 |
| 9732 | DOCK4 | AEH-subject5 | Human | Endometrium | AEH | 2.86e-02 | 1.46e-01 | -0.2953 |
| 9732 | DOCK4 | EEC-subject1 | Human | Endometrium | EEC | 3.09e-04 | 1.85e-01 | -0.2682 |
| 9732 | DOCK4 | EEC-subject2 | Human | Endometrium | EEC | 6.77e-13 | 3.84e-01 | -0.2607 |
| 9732 | DOCK4 | NAFLD1 | Human | Liver | NAFLD | 3.26e-14 | 1.09e+00 | -0.04 |
| 9732 | DOCK4 | S41 | Human | Liver | Cirrhotic | 9.37e-05 | 6.70e-01 | -0.0343 |
| 9732 | DOCK4 | HCC1_Meng | Human | Liver | HCC | 7.75e-52 | -1.26e-01 | 0.0246 |
| 9732 | DOCK4 | HCC2_Meng | Human | Liver | HCC | 1.52e-07 | -2.66e-01 | 0.0107 |
| 9732 | DOCK4 | cirrhotic1 | Human | Liver | Cirrhotic | 3.31e-07 | -2.54e-01 | 0.0202 |
| 9732 | DOCK4 | cirrhotic2 | Human | Liver | Cirrhotic | 3.35e-04 | -2.31e-01 | 0.0201 |
| 9732 | DOCK4 | HCC2 | Human | Liver | HCC | 1.39e-04 | 2.79e+00 | 0.5341 |
| 9732 | DOCK4 | S014 | Human | Liver | HCC | 6.65e-08 | 5.59e-01 | 0.2254 |
| 9732 | DOCK4 | S015 | Human | Liver | HCC | 5.28e-08 | 5.90e-01 | 0.2375 |
| 9732 | DOCK4 | S016 | Human | Liver | HCC | 4.00e-15 | 6.31e-01 | 0.2243 |
| 9732 | DOCK4 | S027 | Human | Liver | HCC | 3.30e-13 | 1.09e+00 | 0.2446 |
| 9732 | DOCK4 | S028 | Human | Liver | HCC | 1.12e-18 | 1.04e+00 | 0.2503 |
| 9732 | DOCK4 | S029 | Human | Liver | HCC | 3.89e-19 | 1.36e+00 | 0.2581 |
| Page: 1 2 3 |
| Tissue | Expression Dynamics | Abbreviation |
| Endometrium | 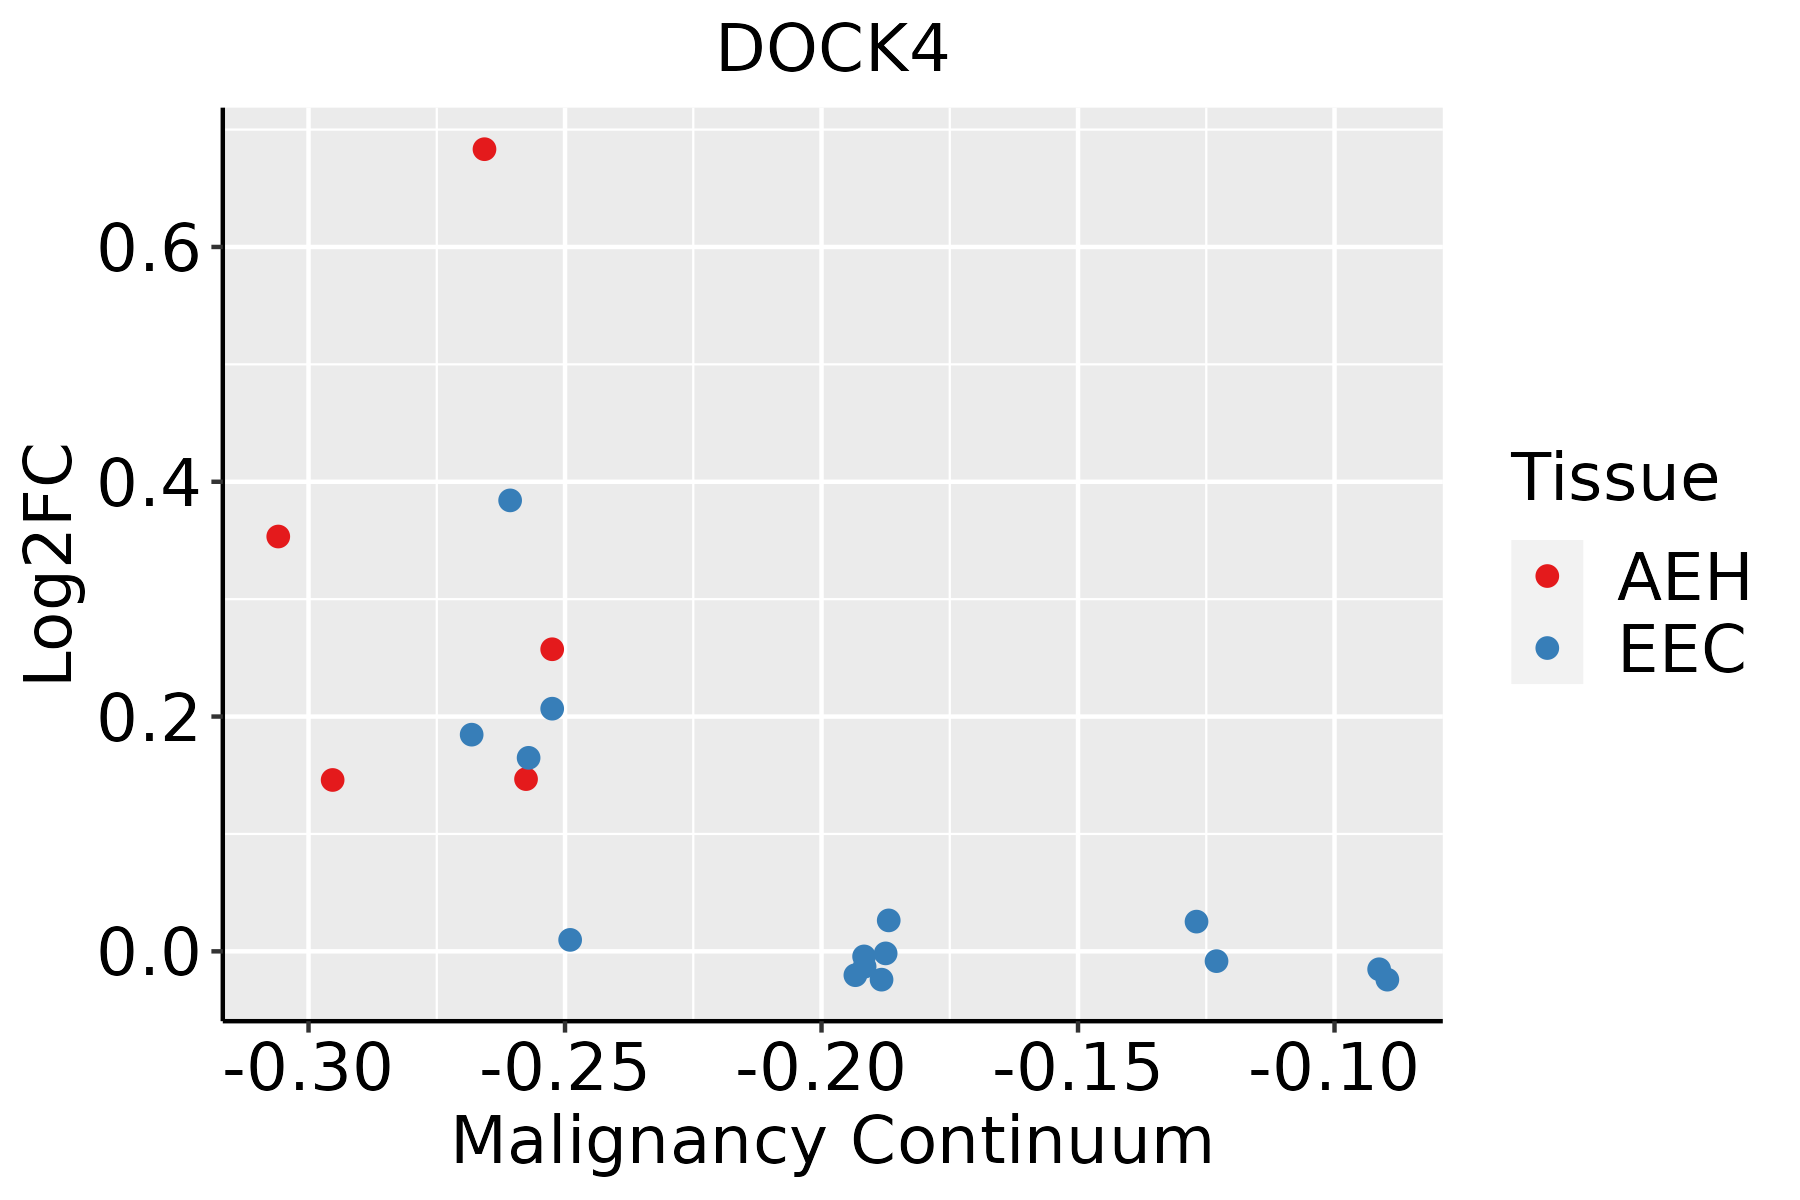 | AEH: Atypical endometrial hyperplasia |
| EEC: Endometrioid Cancer | ||
| Liver | 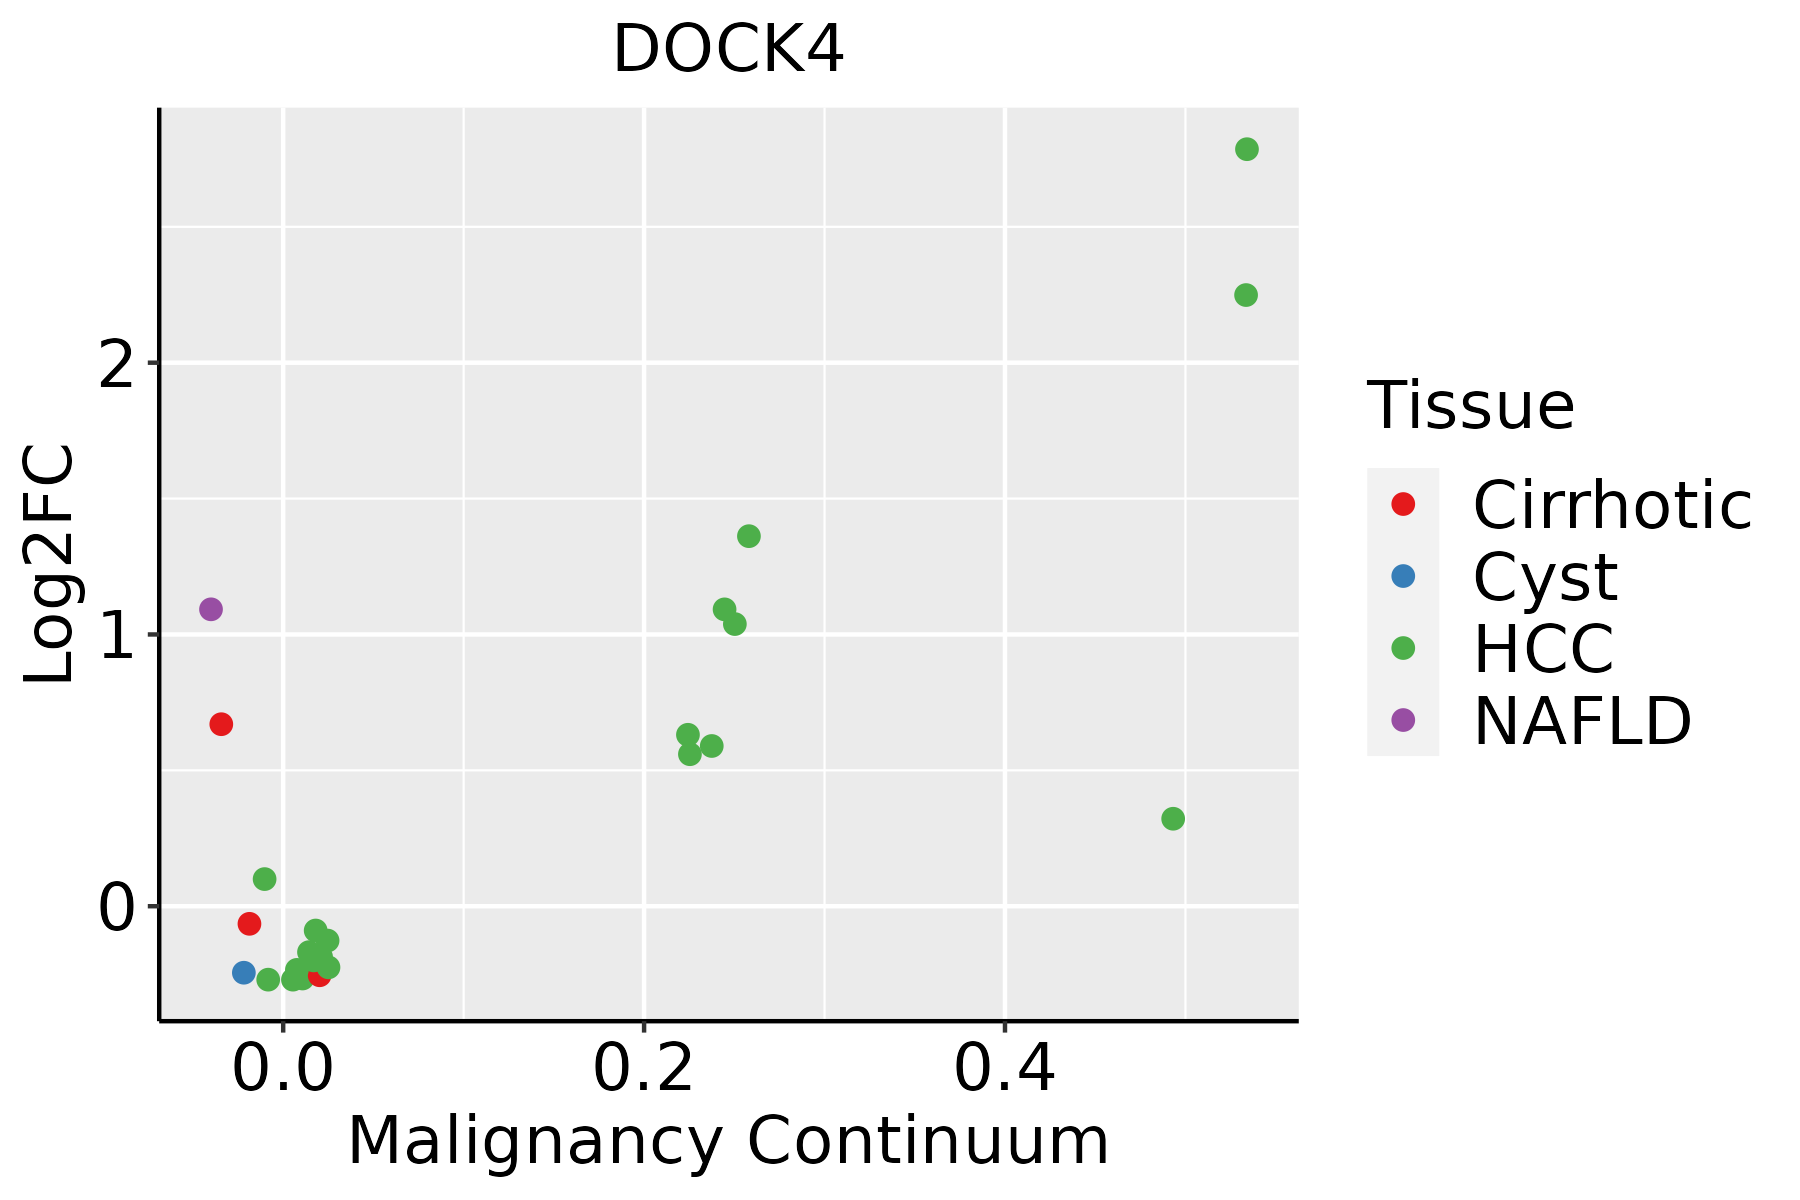 | HCC: Hepatocellular carcinoma |
| NAFLD: Non-alcoholic fatty liver disease | ||
| Lung |  | AAH: Atypical adenomatous hyperplasia |
| AIS: Adenocarcinoma in situ | ||
| IAC: Invasive lung adenocarcinoma | ||
| MIA: Minimally invasive adenocarcinoma | ||
| Prostate | 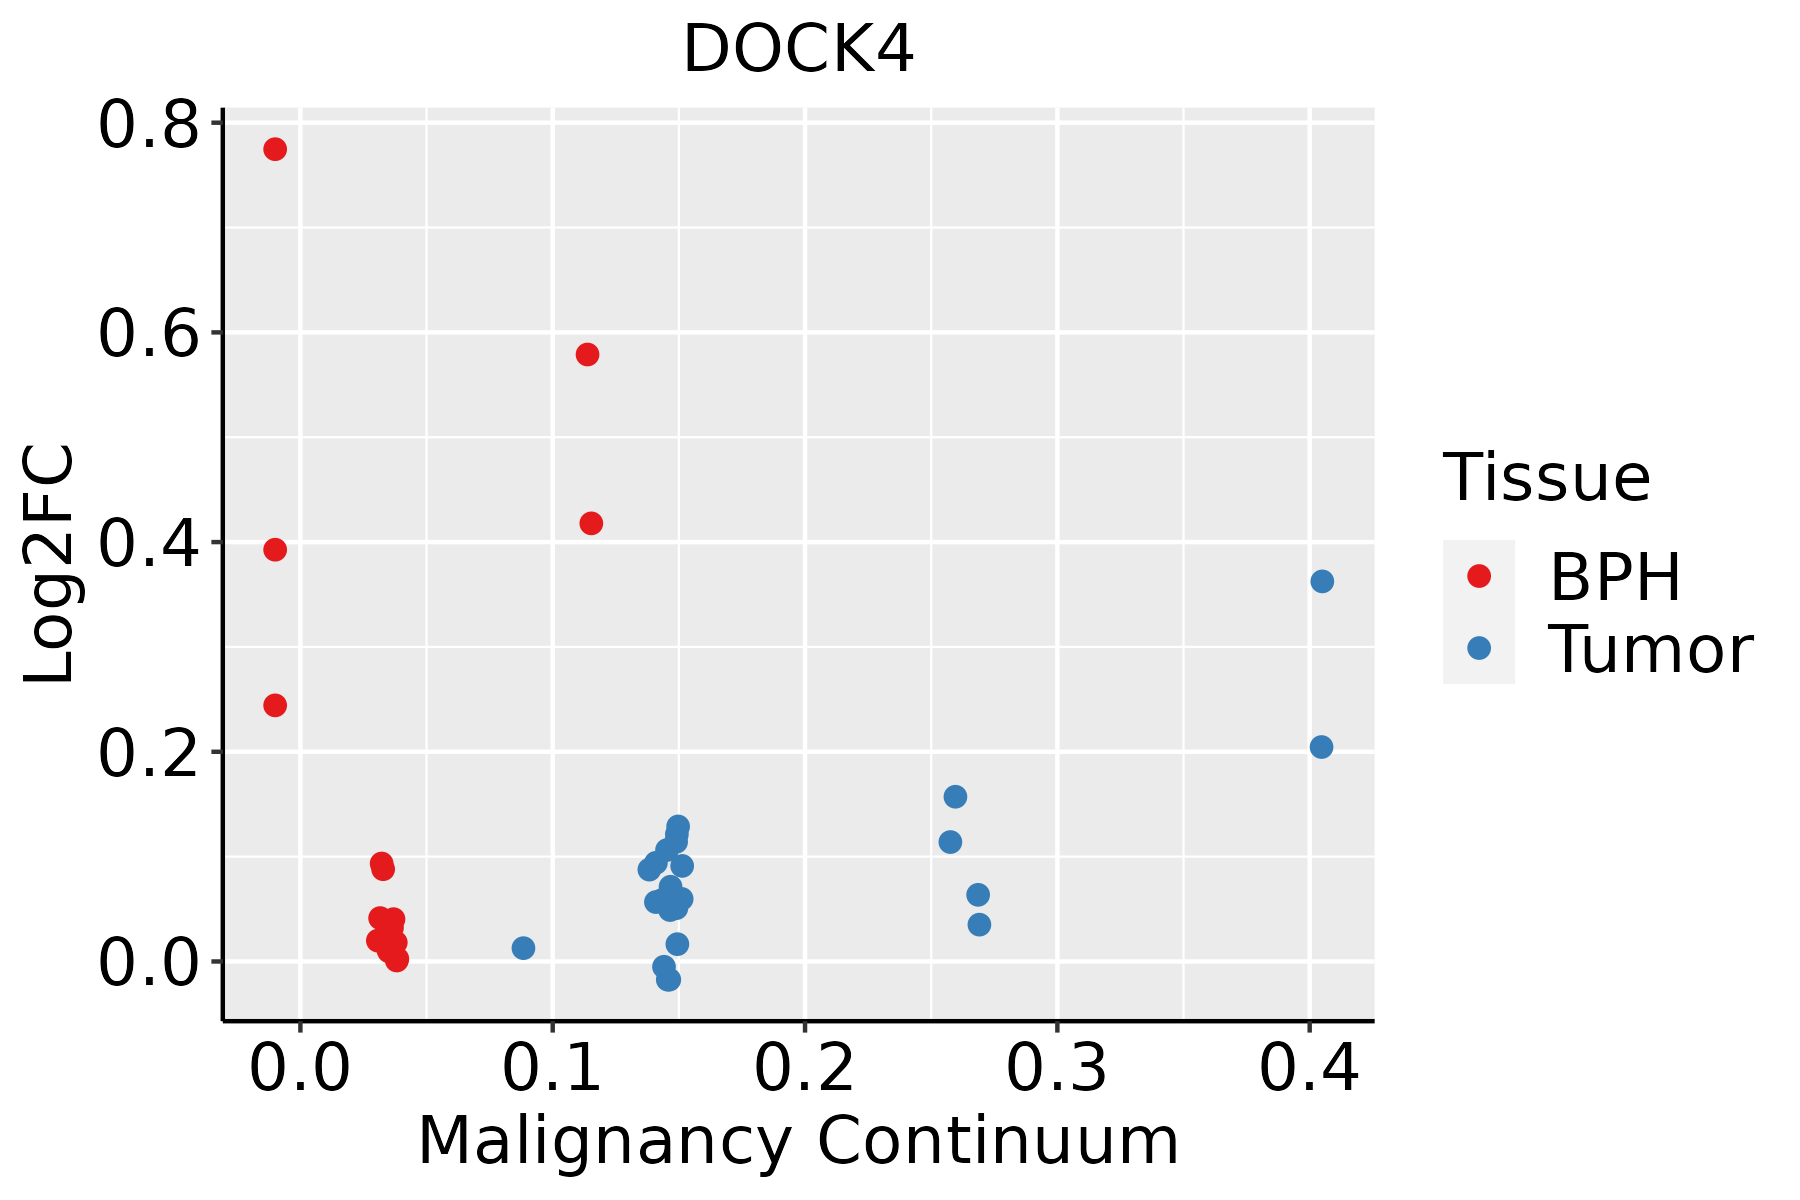 | BPH: Benign Prostatic Hyperplasia |
| ∗log2FC in expression of this searched gene in stem-like cells from each diseased tissue sample relative to stem-like cells in normal samples in each tissue plotted against the malignancy continuum. Samples are colored based on if they are from different disease stage. |
Top |
Malignant transformation related pathway analysis |
| Find out the enriched GO biological processes and KEGG pathways involved in transition from healthy to precancer to cancer |
| Tissue | Disease Stage | Enriched GO biological Processes |
| Colorectum | AD |  |
| Colorectum | SER |  |
| Colorectum | MSS |  |
| Colorectum | MSI-H |  |
| Colorectum | FAP |  |
| ∗Top 15 enriched GO BP terms are showed in the bar plot of each disease state in each tissue. Each row represents a significant GO biological process which is colored according to the -log10(p.adjust). |
| Page: 1 2 3 4 5 6 7 8 9 |
| GO ID | Tissue | Disease Stage | Description | Gene Ratio | Bg Ratio | pvalue | p.adjust | Count |
| GO:00030126 | Endometrium | AEH | muscle system process | 78/2100 | 452/18723 | 6.89e-05 | 1.06e-03 | 78 |
| GO:0006936 | Endometrium | AEH | muscle contraction | 59/2100 | 347/18723 | 7.32e-04 | 6.99e-03 | 59 |
| GO:00603268 | Endometrium | AEH | cell chemotaxis | 53/2100 | 310/18723 | 1.16e-03 | 1.01e-02 | 53 |
| GO:00902579 | Endometrium | AEH | regulation of muscle system process | 44/2100 | 252/18723 | 1.92e-03 | 1.51e-02 | 44 |
| GO:00069374 | Endometrium | AEH | regulation of muscle contraction | 32/2100 | 169/18723 | 2.06e-03 | 1.60e-02 | 32 |
| GO:0045986 | Endometrium | AEH | negative regulation of smooth muscle contraction | 6/2100 | 15/18723 | 4.03e-03 | 2.69e-02 | 6 |
| GO:00149103 | Endometrium | AEH | regulation of smooth muscle cell migration | 19/2100 | 89/18723 | 4.12e-03 | 2.73e-02 | 19 |
| GO:00149092 | Endometrium | AEH | smooth muscle cell migration | 20/2100 | 97/18723 | 5.00e-03 | 3.14e-02 | 20 |
| GO:000301213 | Endometrium | EEC | muscle system process | 79/2168 | 452/18723 | 1.16e-04 | 1.55e-03 | 79 |
| GO:006032613 | Endometrium | EEC | cell chemotaxis | 55/2168 | 310/18723 | 8.22e-04 | 7.63e-03 | 55 |
| GO:00069361 | Endometrium | EEC | muscle contraction | 59/2168 | 347/18723 | 1.57e-03 | 1.26e-02 | 59 |
| GO:009025712 | Endometrium | EEC | regulation of muscle system process | 44/2168 | 252/18723 | 3.51e-03 | 2.36e-02 | 44 |
| GO:001491011 | Endometrium | EEC | regulation of smooth muscle cell migration | 19/2168 | 89/18723 | 5.83e-03 | 3.49e-02 | 19 |
| GO:000693711 | Endometrium | EEC | regulation of muscle contraction | 31/2168 | 169/18723 | 6.29e-03 | 3.71e-02 | 31 |
| GO:001490911 | Endometrium | EEC | smooth muscle cell migration | 20/2168 | 97/18723 | 7.11e-03 | 4.07e-02 | 20 |
| GO:00030182 | Liver | NAFLD | vascular process in circulatory system | 46/1882 | 263/18723 | 1.36e-04 | 2.58e-03 | 46 |
| GO:0014911 | Liver | NAFLD | positive regulation of smooth muscle cell migration | 11/1882 | 47/18723 | 5.92e-03 | 4.47e-02 | 11 |
| GO:0014910 | Liver | NAFLD | regulation of smooth muscle cell migration | 17/1882 | 89/18723 | 6.91e-03 | 4.87e-02 | 17 |
| GO:0035296 | Liver | NAFLD | regulation of tube diameter | 24/1882 | 141/18723 | 7.04e-03 | 4.91e-02 | 24 |
| GO:0097746 | Liver | NAFLD | blood vessel diameter maintenance | 24/1882 | 141/18723 | 7.04e-03 | 4.91e-02 | 24 |
| Page: 1 2 3 |
| Pathway ID | Tissue | Disease Stage | Description | Gene Ratio | Bg Ratio | pvalue | p.adjust | qvalue | Count |
| hsa0401514 | Endometrium | AEH | Rap1 signaling pathway | 49/1197 | 210/8465 | 2.03e-04 | 1.78e-03 | 1.30e-03 | 49 |
| hsa0401515 | Endometrium | AEH | Rap1 signaling pathway | 49/1197 | 210/8465 | 2.03e-04 | 1.78e-03 | 1.30e-03 | 49 |
| hsa0401522 | Endometrium | EEC | Rap1 signaling pathway | 49/1237 | 210/8465 | 4.45e-04 | 3.47e-03 | 2.59e-03 | 49 |
| hsa0401532 | Endometrium | EEC | Rap1 signaling pathway | 49/1237 | 210/8465 | 4.45e-04 | 3.47e-03 | 2.59e-03 | 49 |
| hsa0401510 | Lung | IAC | Rap1 signaling pathway | 41/1053 | 210/8465 | 2.01e-03 | 1.07e-02 | 7.10e-03 | 41 |
| hsa0401511 | Lung | IAC | Rap1 signaling pathway | 41/1053 | 210/8465 | 2.01e-03 | 1.07e-02 | 7.10e-03 | 41 |
| hsa0401521 | Lung | AIS | Rap1 signaling pathway | 41/961 | 210/8465 | 3.23e-04 | 3.38e-03 | 2.16e-03 | 41 |
| hsa0401531 | Lung | AIS | Rap1 signaling pathway | 41/961 | 210/8465 | 3.23e-04 | 3.38e-03 | 2.16e-03 | 41 |
| hsa0401541 | Lung | AAH | Rap1 signaling pathway | 20/348 | 210/8465 | 3.89e-04 | 1.35e-02 | 1.09e-02 | 20 |
| hsa0401551 | Lung | AAH | Rap1 signaling pathway | 20/348 | 210/8465 | 3.89e-04 | 1.35e-02 | 1.09e-02 | 20 |
| hsa0401561 | Lung | MIAC | Rap1 signaling pathway | 29/507 | 210/8465 | 1.94e-05 | 9.40e-04 | 6.80e-04 | 29 |
| hsa0401571 | Lung | MIAC | Rap1 signaling pathway | 29/507 | 210/8465 | 1.94e-05 | 9.40e-04 | 6.80e-04 | 29 |
| hsa0401516 | Prostate | BPH | Rap1 signaling pathway | 61/1718 | 210/8465 | 1.40e-03 | 5.85e-03 | 3.62e-03 | 61 |
| hsa0401517 | Prostate | BPH | Rap1 signaling pathway | 61/1718 | 210/8465 | 1.40e-03 | 5.85e-03 | 3.62e-03 | 61 |
| hsa0401523 | Prostate | Tumor | Rap1 signaling pathway | 60/1791 | 210/8465 | 6.16e-03 | 2.12e-02 | 1.32e-02 | 60 |
| hsa0401533 | Prostate | Tumor | Rap1 signaling pathway | 60/1791 | 210/8465 | 6.16e-03 | 2.12e-02 | 1.32e-02 | 60 |
| Page: 1 |
Top |
Cell-cell communication analysis |
| Identification of potential cell-cell interactions between two cell types and their ligand-receptor pairs for different disease states |
| Ligand | Receptor | LRpair | Pathway | Tissue | Disease Stage |
| Page: 1 |
Top |
Single-cell gene regulatory network inference analysis |
| Find out the significant the regulons (TFs) and the target genes of each regulon across cell types for different disease states |
| TF | Cell Type | Tissue | Disease Stage | Target Gene | RSS | Regulon Activity |
| ∗The dot plots of a searched regulon are shown for all cell subpopulations in each disease state of each tissue based on the regulon specific score inferred using pySCENIC and by calculating the average expression. |
| Page: 1 |
Top |
Somatic mutation of malignant transformation related genes |
| Annotation of somatic variants for genes involved in malignant transformation |
| Hugo Symbol | Variant Class | Variant Classification | dbSNP RS | HGVSc | HGVSp | HGVSp Short | SWISSPROT | BIOTYPE | SIFT | PolyPhen | Tumor Sample Barcode | Tissue | Histology | Sex | Age | Stage | Therapy Types | Drugs | Outcome |
| DOCK4 | SNV | Missense_Mutation | c.13N>G | p.Thr5Ala | p.T5A | Q8N1I0 | protein_coding | deleterious(0.01) | benign(0.053) | TCGA-A2-A0D2-01 | Breast | breast invasive carcinoma | Female | <65 | I/II | Chemotherapy | adriamycin | SD | |
| DOCK4 | SNV | Missense_Mutation | c.398N>T | p.His133Leu | p.H133L | Q8N1I0 | protein_coding | deleterious(0.03) | benign(0.146) | TCGA-A2-A0T1-01 | Breast | breast invasive carcinoma | Female | <65 | III/IV | Targeted Molecular therapy | herceptin | SD | |
| DOCK4 | SNV | Missense_Mutation | rs762166507 | c.1147N>T | p.Val383Leu | p.V383L | Q8N1I0 | protein_coding | tolerated(0.27) | benign(0.024) | TCGA-A8-A06R-01 | Breast | breast invasive carcinoma | Female | >=65 | I/II | Chemotherapy | 5-fluorouracil | CR |
| DOCK4 | SNV | Missense_Mutation | c.4255N>A | p.Asp1419Asn | p.D1419N | Q8N1I0 | protein_coding | deleterious(0) | probably_damaging(0.919) | TCGA-AC-A23C-01 | Breast | breast invasive carcinoma | Female | <65 | I/II | Chemotherapy | chemo | CR | |
| DOCK4 | SNV | Missense_Mutation | c.1672N>G | p.Gln558Glu | p.Q558E | Q8N1I0 | protein_coding | tolerated(1) | benign(0.181) | TCGA-AC-A23H-01 | Breast | breast invasive carcinoma | Female | >=65 | I/II | Unknown | Unknown | PD | |
| DOCK4 | SNV | Missense_Mutation | rs771255631 | c.5201C>T | p.Ser1734Leu | p.S1734L | Q8N1I0 | protein_coding | tolerated(0.14) | benign(0.026) | TCGA-AC-A2QI-01 | Breast | breast invasive carcinoma | Female | >=65 | III/IV | Chemotherapy | cytoxan | CR |
| DOCK4 | SNV | Missense_Mutation | rs768229900 | c.2147G>A | p.Arg716Gln | p.R716Q | Q8N1I0 | protein_coding | deleterious(0.03) | probably_damaging(0.995) | TCGA-AN-A046-01 | Breast | breast invasive carcinoma | Female | >=65 | I/II | Unknown | Unknown | SD |
| DOCK4 | SNV | Missense_Mutation | c.707G>T | p.Arg236Ile | p.R236I | Q8N1I0 | protein_coding | deleterious(0) | probably_damaging(0.961) | TCGA-AN-A046-01 | Breast | breast invasive carcinoma | Female | >=65 | I/II | Unknown | Unknown | SD | |
| DOCK4 | SNV | Missense_Mutation | c.216N>T | p.Lys72Asn | p.K72N | Q8N1I0 | protein_coding | tolerated(0.14) | benign(0.015) | TCGA-AR-A1AO-01 | Breast | breast invasive carcinoma | Female | <65 | I/II | Chemotherapy | doxorubicin | SD | |
| DOCK4 | SNV | Missense_Mutation | novel | c.5093N>C | p.Arg1698Thr | p.R1698T | Q8N1I0 | protein_coding | deleterious(0) | probably_damaging(0.991) | TCGA-BH-A0B6-01 | Breast | breast invasive carcinoma | Female | <65 | I/II | Unknown | Unknown | SD |
| Page: 1 2 3 4 5 6 7 8 9 10 11 12 13 14 15 16 17 18 19 20 21 22 23 24 25 26 |
Top |
Related drugs of malignant transformation related genes |
| Identification of chemicals and drugs interact with genes involved in malignant transfromation |
| (DGIdb 4.0) |
| Entrez ID | Symbol | Category | Interaction Types | Drug Claim Name | Drug Name | PMIDs |
| Page: 1 |

Copyright 2023-Present -The University of Texas Health Science Center at Houston |