
|
|||||
|
 | |
| |
| |
| |
| |
| |
|
Gene: DOCK2 |
Gene summary for DOCK2 |
| Gene information | Species | Human | Gene symbol | DOCK2 | Gene ID | 1794 |
| Gene name | dedicator of cytokinesis 2 | |
| Gene Alias | IMD40 | |
| Cytomap | 5q35.1 | |
| Gene Type | protein-coding | GO ID | GO:0001766 | UniProtAcc | Q5XG91 |
Top |
Malignant transformation analysis |
| Identification of the aberrant gene expression in precancerous and cancerous lesions by comparing the gene expression of stem-like cells in diseased tissues with normal stem cells |
| Entrez ID | Symbol | Replicates | Species | Organ | Tissue | Adj P-value | Log2FC | Malignancy |
| 1794 | DOCK2 | GSM5353216_PA_PB1A_Pool_1_3_S50_L002 | Human | Prostate | Tumor | 4.63e-02 | 4.90e-01 | 0.159 |
| 1794 | DOCK2 | GSM5353218_PA_PB1B_Pool_1_2_S74_L003 | Human | Prostate | Tumor | 1.93e-02 | 5.01e-01 | 0.1479 |
| 1794 | DOCK2 | GSM5353220_PA_PB1B_Pool_3_S51_L002 | Human | Prostate | Tumor | 4.53e-06 | 6.77e-01 | 0.1531 |
| 1794 | DOCK2 | GSM5353226_PA_PR5196-2_Pool_1_2_3_S54_L002 | Human | Prostate | Tumor | 7.96e-03 | 5.13e-01 | 0.159 |
| Page: 1 |
| Tissue | Expression Dynamics | Abbreviation |
| Prostate | 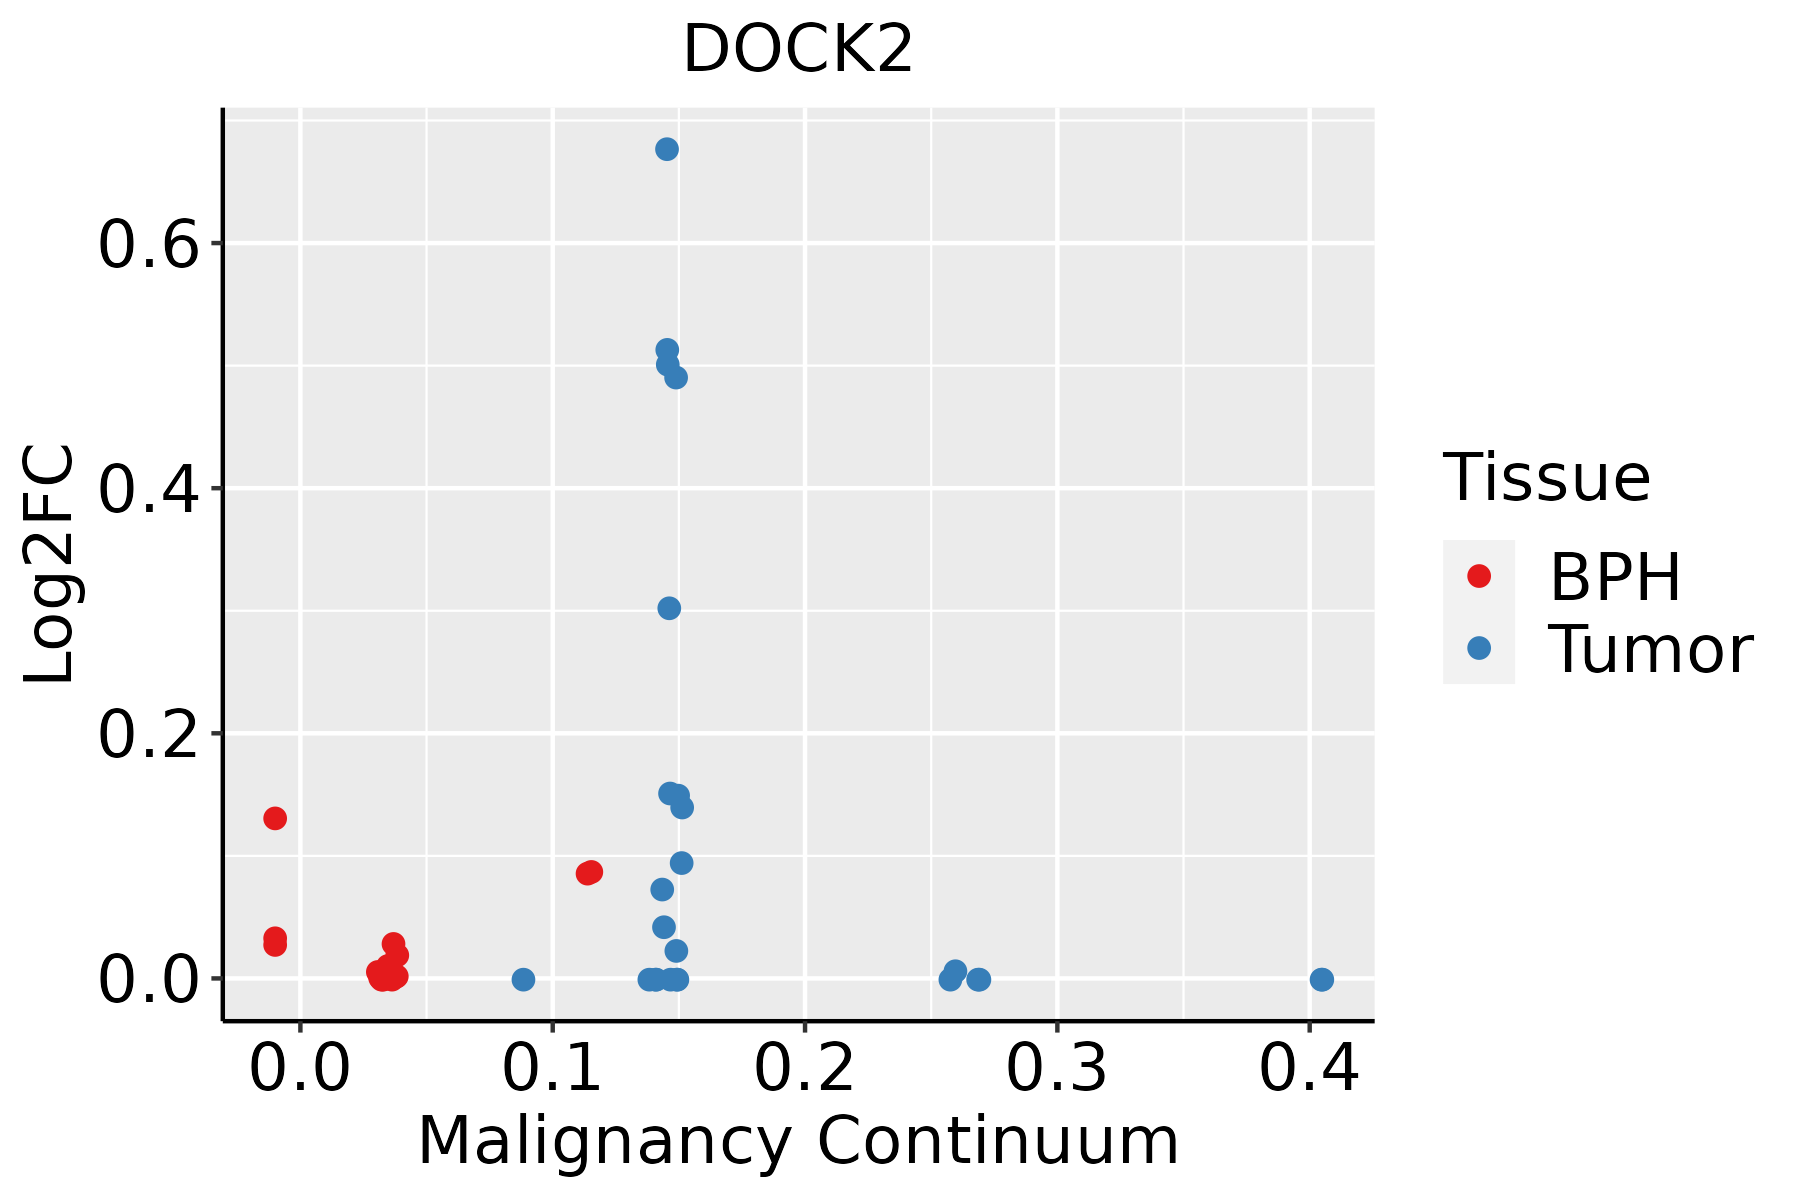 | BPH: Benign Prostatic Hyperplasia |
| ∗log2FC in expression of this searched gene in stem-like cells from each diseased tissue sample relative to stem-like cells in normal samples in each tissue plotted against the malignancy continuum. Samples are colored based on if they are from different disease stage. |
Top |
Malignant transformation related pathway analysis |
| Find out the enriched GO biological processes and KEGG pathways involved in transition from healthy to precancer to cancer |
| Tissue | Disease Stage | Enriched GO biological Processes |
| Colorectum | AD |  |
| Colorectum | SER |  |
| Colorectum | MSS |  |
| Colorectum | MSI-H |  |
| Colorectum | FAP |  |
| ∗Top 15 enriched GO BP terms are showed in the bar plot of each disease state in each tissue. Each row represents a significant GO biological process which is colored according to the -log10(p.adjust). |
| Page: 1 2 3 4 5 6 7 8 9 |
| GO ID | Tissue | Disease Stage | Description | Gene Ratio | Bg Ratio | pvalue | p.adjust | Count |
| GO:000716317 | Prostate | Tumor | establishment or maintenance of cell polarity | 74/3246 | 218/18723 | 2.00e-09 | 8.86e-08 | 74 |
| GO:003001015 | Prostate | Tumor | establishment of cell polarity | 46/3246 | 143/18723 | 1.09e-05 | 1.56e-04 | 46 |
| GO:003157913 | Prostate | Tumor | membrane raft organization | 14/3246 | 25/18723 | 1.41e-05 | 1.92e-04 | 14 |
| GO:005105613 | Prostate | Tumor | regulation of small GTPase mediated signal transduction | 80/3246 | 302/18723 | 3.96e-05 | 4.57e-04 | 80 |
| GO:004211015 | Prostate | Tumor | T cell activation | 117/3246 | 487/18723 | 9.22e-05 | 9.05e-04 | 117 |
| GO:190313113 | Prostate | Tumor | mononuclear cell differentiation | 102/3246 | 426/18723 | 2.87e-04 | 2.32e-03 | 102 |
| GO:003009811 | Prostate | Tumor | lymphocyte differentiation | 87/3246 | 374/18723 | 1.93e-03 | 1.12e-02 | 87 |
| GO:004663111 | Prostate | Tumor | alpha-beta T cell activation | 41/3246 | 156/18723 | 3.21e-03 | 1.68e-02 | 41 |
| GO:00466331 | Prostate | Tumor | alpha-beta T cell proliferation | 14/3246 | 38/18723 | 3.24e-03 | 1.69e-02 | 14 |
| GO:003021711 | Prostate | Tumor | T cell differentiation | 61/3246 | 257/18723 | 5.30e-03 | 2.54e-02 | 61 |
| GO:004209815 | Prostate | Tumor | T cell proliferation | 49/3246 | 199/18723 | 5.61e-03 | 2.63e-02 | 49 |
| Page: 1 |
| Pathway ID | Tissue | Disease Stage | Description | Gene Ratio | Bg Ratio | pvalue | p.adjust | qvalue | Count |
| Page: 1 |
Top |
Cell-cell communication analysis |
| Identification of potential cell-cell interactions between two cell types and their ligand-receptor pairs for different disease states |
| Ligand | Receptor | LRpair | Pathway | Tissue | Disease Stage |
| Page: 1 |
Top |
Single-cell gene regulatory network inference analysis |
| Find out the significant the regulons (TFs) and the target genes of each regulon across cell types for different disease states |
| TF | Cell Type | Tissue | Disease Stage | Target Gene | RSS | Regulon Activity |
| ∗The dot plots of a searched regulon are shown for all cell subpopulations in each disease state of each tissue based on the regulon specific score inferred using pySCENIC and by calculating the average expression. |
| Page: 1 |
Top |
Somatic mutation of malignant transformation related genes |
| Annotation of somatic variants for genes involved in malignant transformation |
| Hugo Symbol | Variant Class | Variant Classification | dbSNP RS | HGVSc | HGVSp | HGVSp Short | SWISSPROT | BIOTYPE | SIFT | PolyPhen | Tumor Sample Barcode | Tissue | Histology | Sex | Age | Stage | Therapy Types | Drugs | Outcome |
| DOCK2 | SNV | Missense_Mutation | novel | c.4158N>C | p.Glu1386Asp | p.E1386D | Q92608 | protein_coding | tolerated(0.05) | benign(0.034) | TCGA-5L-AAT1-01 | Breast | breast invasive carcinoma | Female | <65 | III/IV | Hormone Therapy | letrozol | SD |
| DOCK2 | SNV | Missense_Mutation | novel | c.5239G>T | p.Val1747Phe | p.V1747F | Q92608 | protein_coding | tolerated_low_confidence(0.05) | benign(0.034) | TCGA-A2-A0T0-01 | Breast | breast invasive carcinoma | Female | <65 | I/II | Chemotherapy | taxotere | SD |
| DOCK2 | SNV | Missense_Mutation | novel | c.4945N>T | p.Ala1649Ser | p.A1649S | Q92608 | protein_coding | tolerated(0.94) | benign(0) | TCGA-A2-A25A-01 | Breast | breast invasive carcinoma | Female | <65 | I/II | Unspecific | Cytoxan | SD |
| DOCK2 | SNV | Missense_Mutation | novel | c.1406N>T | p.Gly469Val | p.G469V | Q92608 | protein_coding | deleterious(0) | probably_damaging(0.991) | TCGA-A7-A0DB-01 | Breast | breast invasive carcinoma | Female | <65 | I/II | Hormone Therapy | arimidex | SD |
| DOCK2 | SNV | Missense_Mutation | novel | c.1808N>T | p.Ser603Phe | p.S603F | Q92608 | protein_coding | deleterious(0) | probably_damaging(0.993) | TCGA-AC-A23C-01 | Breast | breast invasive carcinoma | Female | <65 | I/II | Chemotherapy | chemo | CR |
| DOCK2 | SNV | Missense_Mutation | c.2023N>T | p.Asp675Tyr | p.D675Y | Q92608 | protein_coding | deleterious(0) | probably_damaging(0.998) | TCGA-AC-A23H-01 | Breast | breast invasive carcinoma | Female | >=65 | I/II | Unknown | Unknown | PD | |
| DOCK2 | SNV | Missense_Mutation | c.5326N>A | p.Glu1776Lys | p.E1776K | Q92608 | protein_coding | deleterious_low_confidence(0.03) | possibly_damaging(0.76) | TCGA-AC-A23H-01 | Breast | breast invasive carcinoma | Female | >=65 | I/II | Unknown | Unknown | PD | |
| DOCK2 | SNV | Missense_Mutation | rs141274816 | c.5294N>T | p.Ala1765Val | p.A1765V | Q92608 | protein_coding | tolerated_low_confidence(0.11) | benign(0.007) | TCGA-AC-A3TM-01 | Breast | breast invasive carcinoma | Female | <65 | III/IV | Chemotherapy | cytoxan | CR |
| DOCK2 | SNV | Missense_Mutation | c.1180N>T | p.Arg394Cys | p.R394C | Q92608 | protein_coding | deleterious(0) | probably_damaging(0.965) | TCGA-AN-A046-01 | Breast | breast invasive carcinoma | Female | >=65 | I/II | Unknown | Unknown | SD | |
| DOCK2 | SNV | Missense_Mutation | c.1219N>A | p.Val407Met | p.V407M | Q92608 | protein_coding | deleterious(0.03) | probably_damaging(0.972) | TCGA-BH-A0HO-01 | Breast | breast invasive carcinoma | Female | <65 | I/II | Chemotherapy | cyclophosphamide | SD |
| Page: 1 2 3 4 5 6 7 8 9 10 11 12 13 14 15 16 17 18 19 20 21 22 23 24 25 26 27 28 29 30 31 32 33 34 35 36 37 38 |
Top |
Related drugs of malignant transformation related genes |
| Identification of chemicals and drugs interact with genes involved in malignant transfromation |
| (DGIdb 4.0) |
| Entrez ID | Symbol | Category | Interaction Types | Drug Claim Name | Drug Name | PMIDs |
| Page: 1 |

Copyright 2023-Present -The University of Texas Health Science Center at Houston |