
|
|||||
|
 | |
| |
| |
| |
| |
| |
|
Gene: DOCK10 |
Gene summary for DOCK10 |
| Gene information | Species | Human | Gene symbol | DOCK10 | Gene ID | 55619 |
| Gene name | dedicator of cytokinesis 10 | |
| Gene Alias | DRIP2 | |
| Cytomap | 2q36.2 | |
| Gene Type | protein-coding | GO ID | GO:0000902 | UniProtAcc | Q96BY6 |
Top |
Malignant transformation analysis |
| Identification of the aberrant gene expression in precancerous and cancerous lesions by comparing the gene expression of stem-like cells in diseased tissues with normal stem cells |
| Entrez ID | Symbol | Replicates | Species | Organ | Tissue | Adj P-value | Log2FC | Malignancy |
| 55619 | DOCK10 | RNA-P6T1-P6T1-2 | Human | Lung | MIAC | 1.48e-05 | 8.60e-01 | -0.0186 |
| 55619 | DOCK10 | RNA-P6T1-P6T1-3 | Human | Lung | MIAC | 1.19e-03 | 7.32e-01 | -0.0296 |
| 55619 | DOCK10 | RNA-P6T1-P6T1-4 | Human | Lung | MIAC | 1.14e-02 | 6.05e-01 | -0.0263 |
| 55619 | DOCK10 | EOLP-1 | Human | Oral cavity | EOLP | 8.65e-21 | 6.92e-01 | -0.0202 |
| 55619 | DOCK10 | EOLP-2 | Human | Oral cavity | EOLP | 2.07e-20 | 6.17e-01 | -0.0203 |
| 55619 | DOCK10 | NEOLP-2 | Human | Oral cavity | NEOLP | 9.75e-08 | 3.56e-01 | -0.0196 |
| 55619 | DOCK10 | NEOLP-3 | Human | Oral cavity | NEOLP | 3.87e-06 | 3.86e-01 | -0.0191 |
| Page: 1 |
| Tissue | Expression Dynamics | Abbreviation |
| Lung | 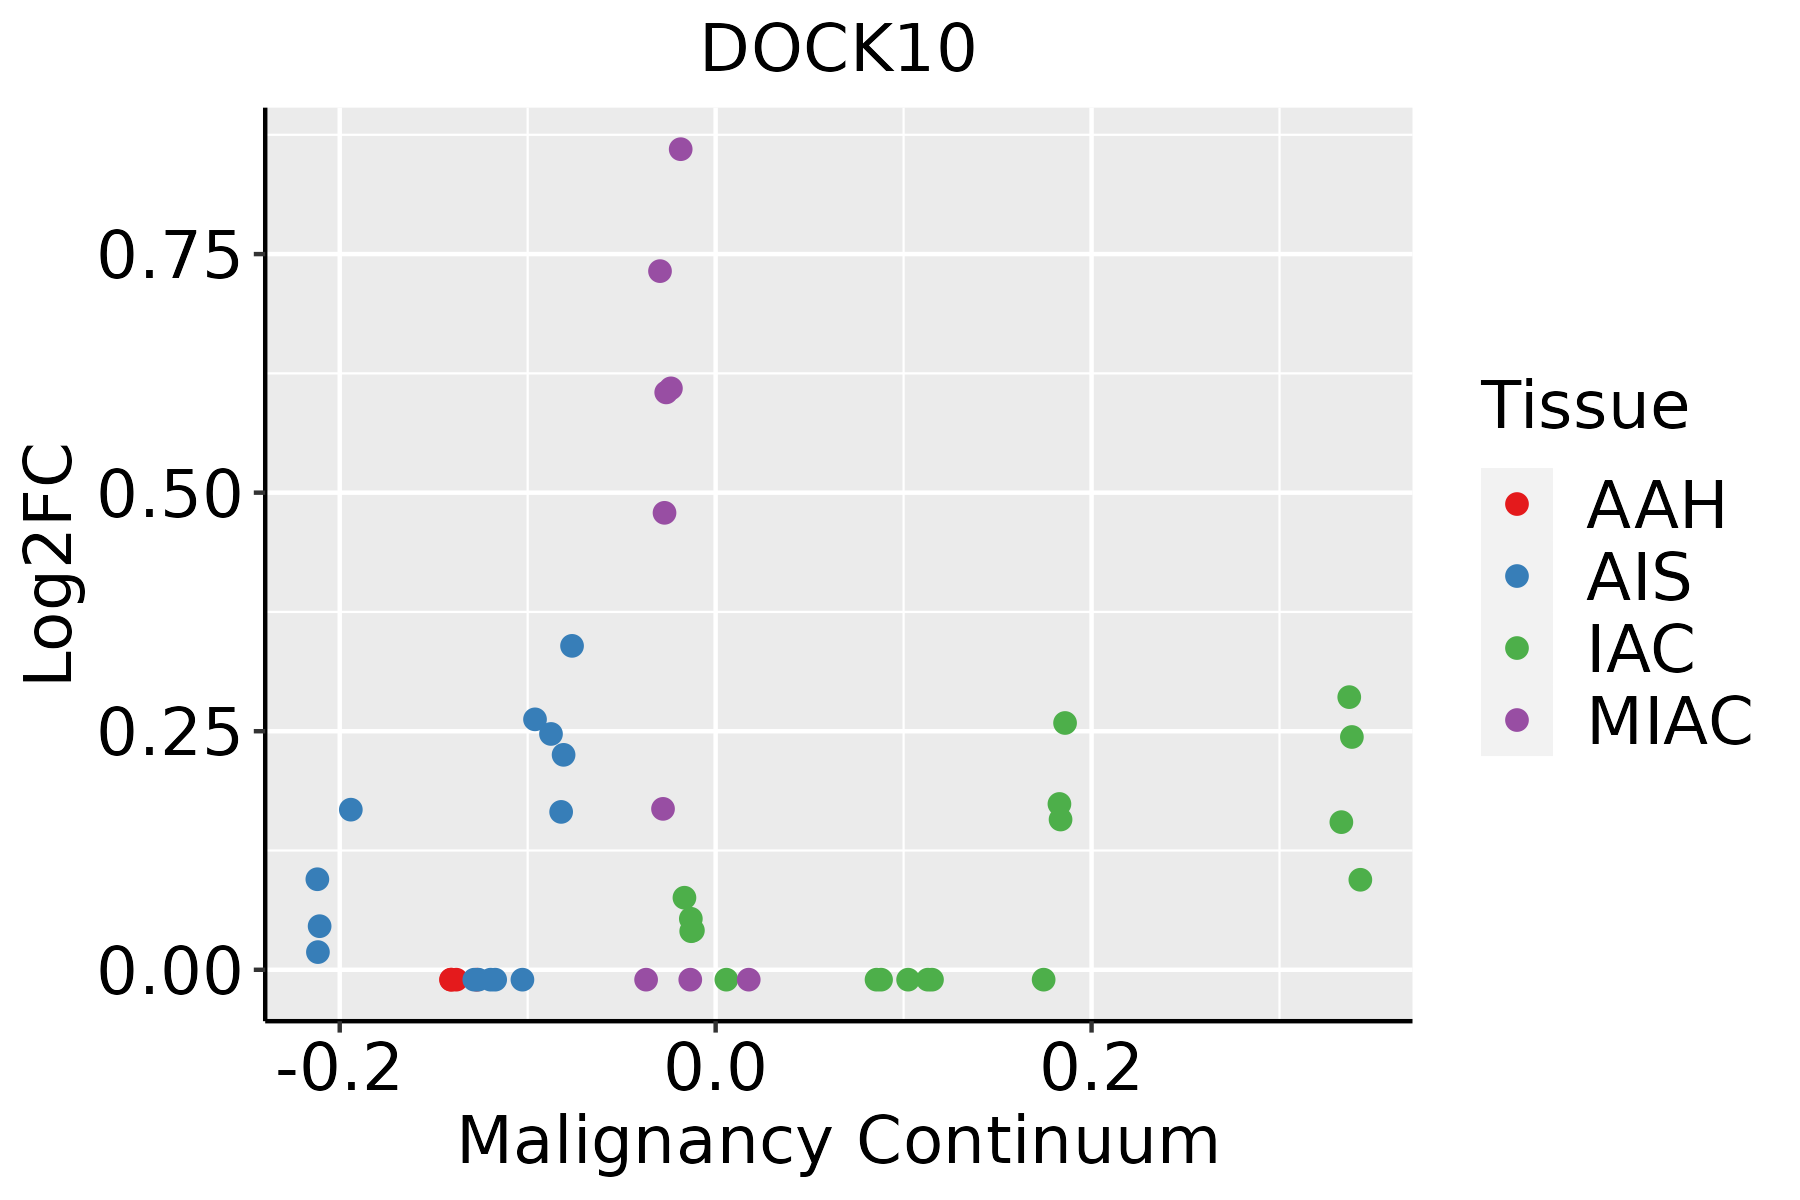 | AAH: Atypical adenomatous hyperplasia |
| AIS: Adenocarcinoma in situ | ||
| IAC: Invasive lung adenocarcinoma | ||
| MIA: Minimally invasive adenocarcinoma | ||
| Oral Cavity | 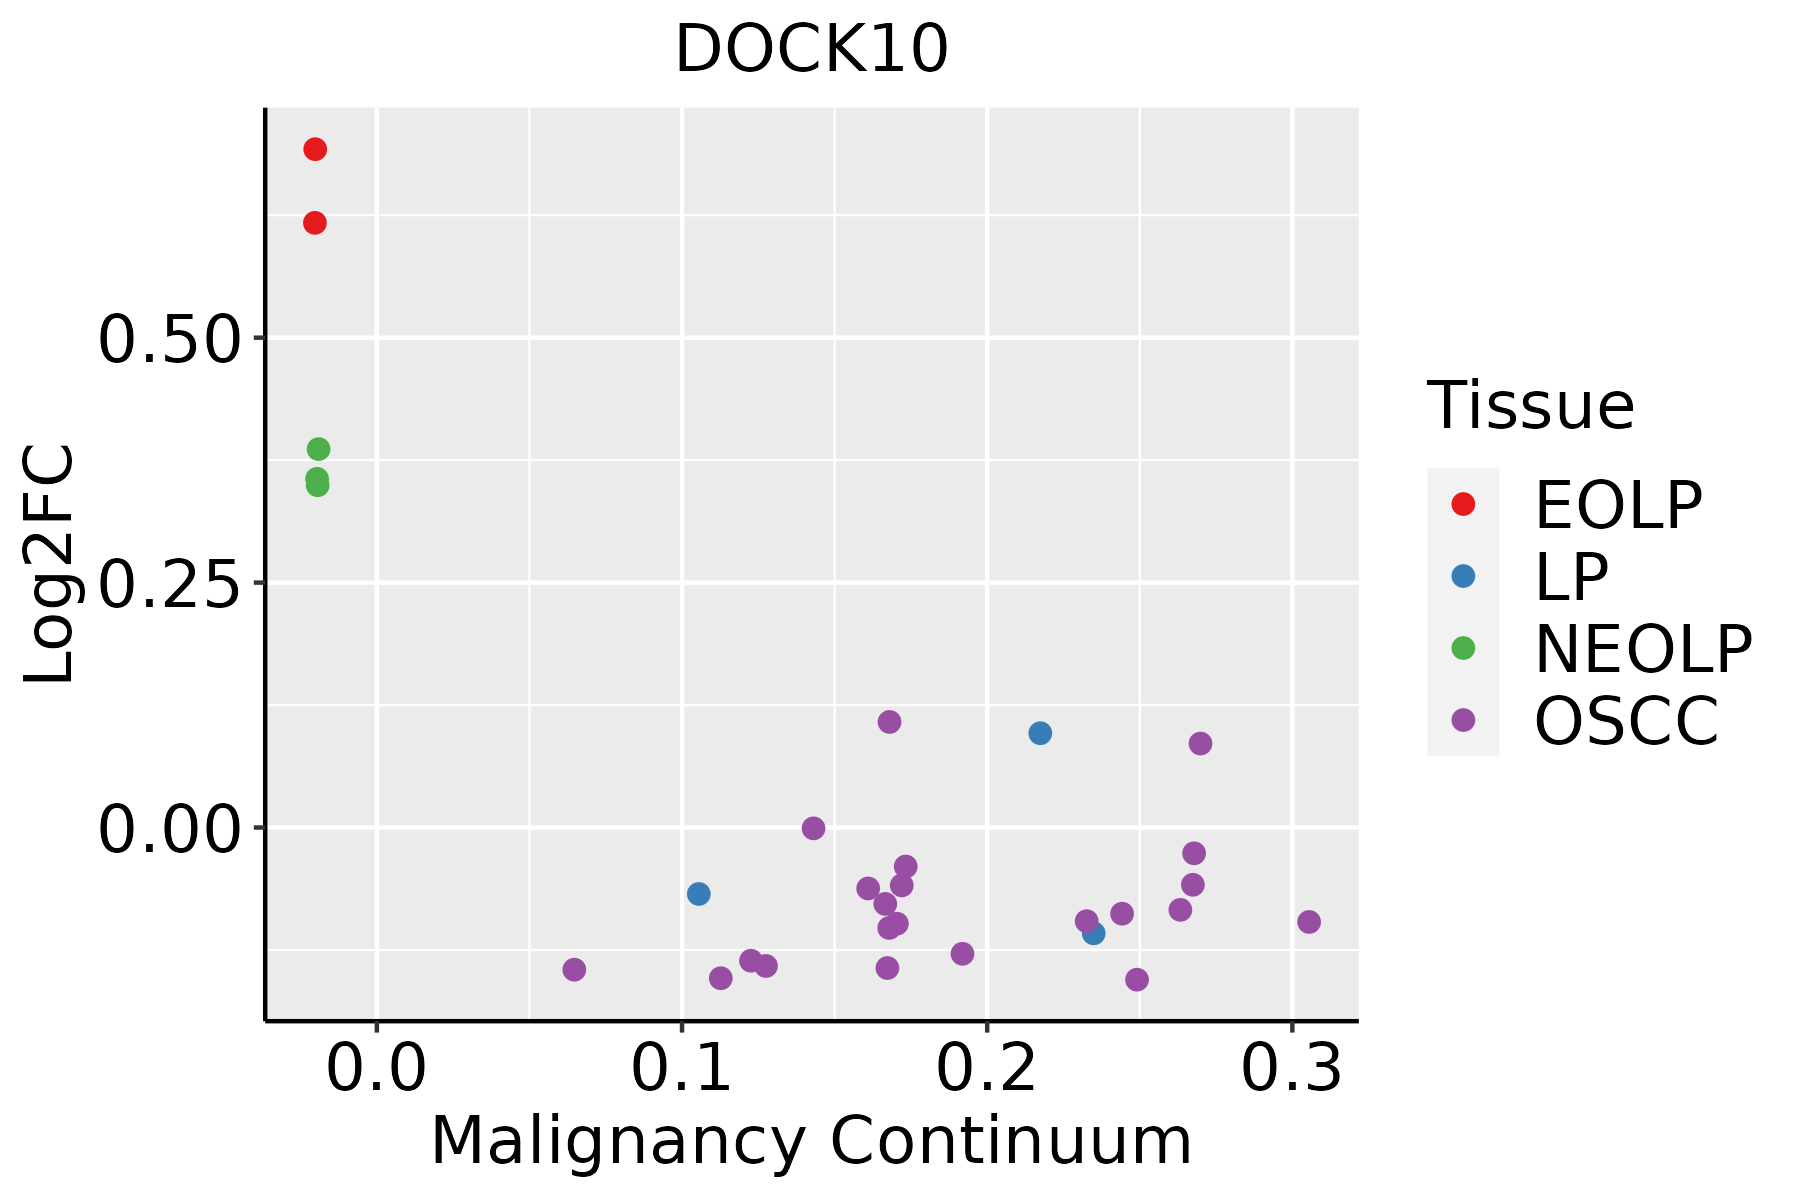 | EOLP: Erosive Oral lichen planus |
| LP: leukoplakia | ||
| NEOLP: Non-erosive oral lichen planus | ||
| OSCC: Oral squamous cell carcinoma |
| ∗log2FC in expression of this searched gene in stem-like cells from each diseased tissue sample relative to stem-like cells in normal samples in each tissue plotted against the malignancy continuum. Samples are colored based on if they are from different disease stage. |
Top |
Malignant transformation related pathway analysis |
| Find out the enriched GO biological processes and KEGG pathways involved in transition from healthy to precancer to cancer |
| Tissue | Disease Stage | Enriched GO biological Processes |
| Colorectum | AD |  |
| Colorectum | SER |  |
| Colorectum | MSS |  |
| Colorectum | MSI-H |  |
| Colorectum | FAP |  |
| ∗Top 15 enriched GO BP terms are showed in the bar plot of each disease state in each tissue. Each row represents a significant GO biological process which is colored according to the -log10(p.adjust). |
| Page: 1 2 3 4 5 6 7 8 9 |
| GO ID | Tissue | Disease Stage | Description | Gene Ratio | Bg Ratio | pvalue | p.adjust | Count |
| GO:004308721 | Lung | MIAC | regulation of GTPase activity | 41/967 | 348/18723 | 7.39e-07 | 1.08e-04 | 41 |
| GO:004354721 | Lung | MIAC | positive regulation of GTPase activity | 31/967 | 255/18723 | 8.63e-06 | 7.38e-04 | 31 |
| GO:004887223 | Lung | MIAC | homeostasis of number of cells | 27/967 | 272/18723 | 9.04e-04 | 1.92e-02 | 27 |
| GO:001635831 | Lung | MIAC | dendrite development | 23/967 | 243/18723 | 3.82e-03 | 4.69e-02 | 23 |
| GO:004887226 | Oral cavity | EOLP | homeostasis of number of cells | 68/2218 | 272/18723 | 1.20e-09 | 8.27e-08 | 68 |
| GO:190313114 | Oral cavity | EOLP | mononuclear cell differentiation | 88/2218 | 426/18723 | 1.07e-07 | 3.61e-06 | 88 |
| GO:001635815 | Oral cavity | EOLP | dendrite development | 55/2218 | 243/18723 | 1.43e-06 | 3.42e-05 | 55 |
| GO:003009812 | Oral cavity | EOLP | lymphocyte differentiation | 76/2218 | 374/18723 | 1.50e-06 | 3.55e-05 | 76 |
| GO:006099614 | Oral cavity | EOLP | dendritic spine development | 27/2218 | 99/18723 | 2.21e-05 | 3.37e-04 | 27 |
| GO:00022633 | Oral cavity | EOLP | cell activation involved in immune response | 56/2218 | 279/18723 | 4.91e-05 | 6.47e-04 | 56 |
| GO:00023662 | Oral cavity | EOLP | leukocyte activation involved in immune response | 55/2218 | 275/18723 | 6.32e-05 | 7.90e-04 | 55 |
| GO:004308714 | Oral cavity | EOLP | regulation of GTPase activity | 66/2218 | 348/18723 | 6.92e-05 | 8.55e-04 | 66 |
| GO:00022852 | Oral cavity | EOLP | lymphocyte activation involved in immune response | 42/2218 | 194/18723 | 7.17e-05 | 8.82e-04 | 42 |
| GO:00488137 | Oral cavity | EOLP | dendrite morphogenesis | 34/2218 | 146/18723 | 7.56e-05 | 9.19e-04 | 34 |
| GO:00421132 | Oral cavity | EOLP | B cell activation | 61/2218 | 334/18723 | 3.68e-04 | 3.35e-03 | 61 |
| GO:01060279 | Oral cavity | EOLP | neuron projection organization | 23/2218 | 93/18723 | 4.20e-04 | 3.72e-03 | 23 |
| GO:00017761 | Oral cavity | EOLP | leukocyte homeostasis | 21/2218 | 87/18723 | 1.03e-03 | 7.63e-03 | 21 |
| GO:00435479 | Oral cavity | EOLP | positive regulation of GTPase activity | 47/2218 | 255/18723 | 1.34e-03 | 9.33e-03 | 47 |
| GO:00970618 | Oral cavity | EOLP | dendritic spine organization | 20/2218 | 84/18723 | 1.60e-03 | 1.07e-02 | 20 |
| GO:004887233 | Oral cavity | NEOLP | homeostasis of number of cells | 65/2005 | 272/18723 | 3.20e-10 | 2.93e-08 | 65 |
| Page: 1 2 |
| Pathway ID | Tissue | Disease Stage | Description | Gene Ratio | Bg Ratio | pvalue | p.adjust | qvalue | Count |
| Page: 1 |
Top |
Cell-cell communication analysis |
| Identification of potential cell-cell interactions between two cell types and their ligand-receptor pairs for different disease states |
| Ligand | Receptor | LRpair | Pathway | Tissue | Disease Stage |
| Page: 1 |
Top |
Single-cell gene regulatory network inference analysis |
| Find out the significant the regulons (TFs) and the target genes of each regulon across cell types for different disease states |
| TF | Cell Type | Tissue | Disease Stage | Target Gene | RSS | Regulon Activity |
| ∗The dot plots of a searched regulon are shown for all cell subpopulations in each disease state of each tissue based on the regulon specific score inferred using pySCENIC and by calculating the average expression. |
| Page: 1 |
Top |
Somatic mutation of malignant transformation related genes |
| Annotation of somatic variants for genes involved in malignant transformation |
| Hugo Symbol | Variant Class | Variant Classification | dbSNP RS | HGVSc | HGVSp | HGVSp Short | SWISSPROT | BIOTYPE | SIFT | PolyPhen | Tumor Sample Barcode | Tissue | Histology | Sex | Age | Stage | Therapy Types | Drugs | Outcome |
| DOCK10 | SNV | Missense_Mutation | c.1277N>A | p.Ser426Asn | p.S426N | Q96BY6 | protein_coding | tolerated(0.11) | probably_damaging(0.993) | TCGA-A2-A0CQ-01 | Breast | breast invasive carcinoma | Female | <65 | I/II | Chemotherapy | adriamycin | SD | |
| DOCK10 | SNV | Missense_Mutation | c.5491G>C | p.Asp1831His | p.D1831H | Q96BY6 | protein_coding | tolerated(0.23) | benign(0.034) | TCGA-A8-A08R-01 | Breast | breast invasive carcinoma | Female | <65 | I/II | Unknown | Unknown | SD | |
| DOCK10 | SNV | Missense_Mutation | rs745850719 | c.3974N>A | p.Arg1325Gln | p.R1325Q | Q96BY6 | protein_coding | tolerated(0.12) | possibly_damaging(0.743) | TCGA-AC-A6NO-01 | Breast | breast invasive carcinoma | Female | <65 | I/II | Unknown | Unknown | SD |
| DOCK10 | SNV | Missense_Mutation | rs200577403 | c.6418N>A | p.Glu2140Lys | p.E2140K | Q96BY6 | protein_coding | deleterious(0.05) | benign(0.275) | TCGA-AN-A046-01 | Breast | breast invasive carcinoma | Female | >=65 | I/II | Unknown | Unknown | SD |
| DOCK10 | SNV | Missense_Mutation | novel | c.3970N>A | p.Leu1324Ile | p.L1324I | Q96BY6 | protein_coding | tolerated(0.53) | benign(0.11) | TCGA-AN-A046-01 | Breast | breast invasive carcinoma | Female | >=65 | I/II | Unknown | Unknown | SD |
| DOCK10 | SNV | Missense_Mutation | novel | c.687N>T | p.Glu229Asp | p.E229D | Q96BY6 | protein_coding | tolerated(0.08) | probably_damaging(0.976) | TCGA-AN-A046-01 | Breast | breast invasive carcinoma | Female | >=65 | I/II | Unknown | Unknown | SD |
| DOCK10 | SNV | Missense_Mutation | novel | c.194N>A | p.Arg65Gln | p.R65Q | Q96BY6 | protein_coding | tolerated(0.37) | benign(0.003) | TCGA-AN-A046-01 | Breast | breast invasive carcinoma | Female | >=65 | I/II | Unknown | Unknown | SD |
| DOCK10 | SNV | Missense_Mutation | c.1651N>A | p.Gly551Arg | p.G551R | Q96BY6 | protein_coding | deleterious(0) | probably_damaging(1) | TCGA-AO-A0J5-01 | Breast | breast invasive carcinoma | Female | <65 | III/IV | Other, specify in notesBisphosphonate | zoledronic | PD | |
| DOCK10 | SNV | Missense_Mutation | c.1376N>T | p.Ser459Phe | p.S459F | Q96BY6 | protein_coding | deleterious(0) | benign(0.398) | TCGA-BH-A1EV-01 | Breast | breast invasive carcinoma | Female | <65 | III/IV | Unknown | Unknown | PD | |
| DOCK10 | SNV | Missense_Mutation | c.1233N>C | p.Glu411Asp | p.E411D | Q96BY6 | protein_coding | tolerated(0.3) | benign(0.015) | TCGA-C8-A26Y-01 | Breast | breast invasive carcinoma | Female | >=65 | I/II | Unknown | Unknown | SD |
| Page: 1 2 3 4 5 6 7 8 9 10 11 12 13 14 15 16 17 18 19 20 21 22 23 24 25 26 27 28 29 30 31 |
Top |
Related drugs of malignant transformation related genes |
| Identification of chemicals and drugs interact with genes involved in malignant transfromation |
| (DGIdb 4.0) |
| Entrez ID | Symbol | Category | Interaction Types | Drug Claim Name | Drug Name | PMIDs |
| 55619 | DOCK10 | NA | INTERLEUKIN-4 | 18499258 |
| Page: 1 |

Copyright 2023-Present -The University of Texas Health Science Center at Houston |