
|
|||||
|
 | |
| |
| |
| |
| |
| |
|
Gene: DNTTIP1 |
Gene summary for DNTTIP1 |
| Gene information | Species | Human | Gene symbol | DNTTIP1 | Gene ID | 116092 |
| Gene name | deoxynucleotidyltransferase terminal interacting protein 1 | |
| Gene Alias | C20orf167 | |
| Cytomap | 20q13.12 | |
| Gene Type | protein-coding | GO ID | GO:0000118 | UniProtAcc | Q9H147 |
Top |
Malignant transformation analysis |
| Identification of the aberrant gene expression in precancerous and cancerous lesions by comparing the gene expression of stem-like cells in diseased tissues with normal stem cells |
| Entrez ID | Symbol | Replicates | Species | Organ | Tissue | Adj P-value | Log2FC | Malignancy |
| 116092 | DNTTIP1 | HTA11_2487_2000001011 | Human | Colorectum | SER | 1.04e-02 | 2.65e-01 | -0.1808 |
| 116092 | DNTTIP1 | HTA11_1938_2000001011 | Human | Colorectum | AD | 3.90e-04 | 2.31e-01 | -0.0811 |
| 116092 | DNTTIP1 | HTA11_347_2000001011 | Human | Colorectum | AD | 3.91e-07 | 2.73e-01 | -0.1954 |
| 116092 | DNTTIP1 | HTA11_411_2000001011 | Human | Colorectum | SER | 8.74e-04 | 6.47e-01 | -0.2602 |
| 116092 | DNTTIP1 | HTA11_3361_2000001011 | Human | Colorectum | AD | 1.04e-02 | 3.66e-01 | -0.1207 |
| 116092 | DNTTIP1 | HTA11_696_2000001011 | Human | Colorectum | AD | 2.54e-04 | 3.36e-01 | -0.1464 |
| 116092 | DNTTIP1 | HTA11_1391_2000001011 | Human | Colorectum | AD | 3.49e-03 | 2.33e-01 | -0.059 |
| 116092 | DNTTIP1 | HTA11_866_3004761011 | Human | Colorectum | AD | 2.07e-10 | 3.69e-01 | 0.096 |
| 116092 | DNTTIP1 | HTA11_99999965062_69753 | Human | Colorectum | MSI-H | 5.78e-03 | 5.79e-01 | 0.3487 |
| 116092 | DNTTIP1 | HTA11_99999965104_69814 | Human | Colorectum | MSS | 1.15e-09 | 4.47e-01 | 0.281 |
| 116092 | DNTTIP1 | HTA11_99999971662_82457 | Human | Colorectum | MSS | 5.51e-28 | 8.18e-01 | 0.3859 |
| 116092 | DNTTIP1 | HTA11_99999973899_84307 | Human | Colorectum | MSS | 3.91e-13 | 6.51e-01 | 0.2585 |
| 116092 | DNTTIP1 | HTA11_99999974143_84620 | Human | Colorectum | MSS | 2.01e-05 | 2.97e-01 | 0.3005 |
| 116092 | DNTTIP1 | A015-C-203 | Human | Colorectum | FAP | 3.61e-02 | -7.79e-02 | -0.1294 |
| 116092 | DNTTIP1 | LZE5T | Human | Esophagus | ESCC | 1.14e-07 | 5.34e-01 | 0.0514 |
| 116092 | DNTTIP1 | LZE7T | Human | Esophagus | ESCC | 4.35e-11 | 3.95e-01 | 0.0667 |
| 116092 | DNTTIP1 | LZE20T | Human | Esophagus | ESCC | 2.01e-11 | 4.40e-01 | 0.0662 |
| 116092 | DNTTIP1 | LZE22T | Human | Esophagus | ESCC | 4.84e-03 | 3.12e-01 | 0.068 |
| 116092 | DNTTIP1 | LZE24T | Human | Esophagus | ESCC | 4.63e-40 | 9.80e-01 | 0.0596 |
| 116092 | DNTTIP1 | LZE21T | Human | Esophagus | ESCC | 4.85e-03 | 2.93e-01 | 0.0655 |
| Page: 1 2 3 4 5 6 7 |
| Tissue | Expression Dynamics | Abbreviation |
| Colorectum (GSE201348) | 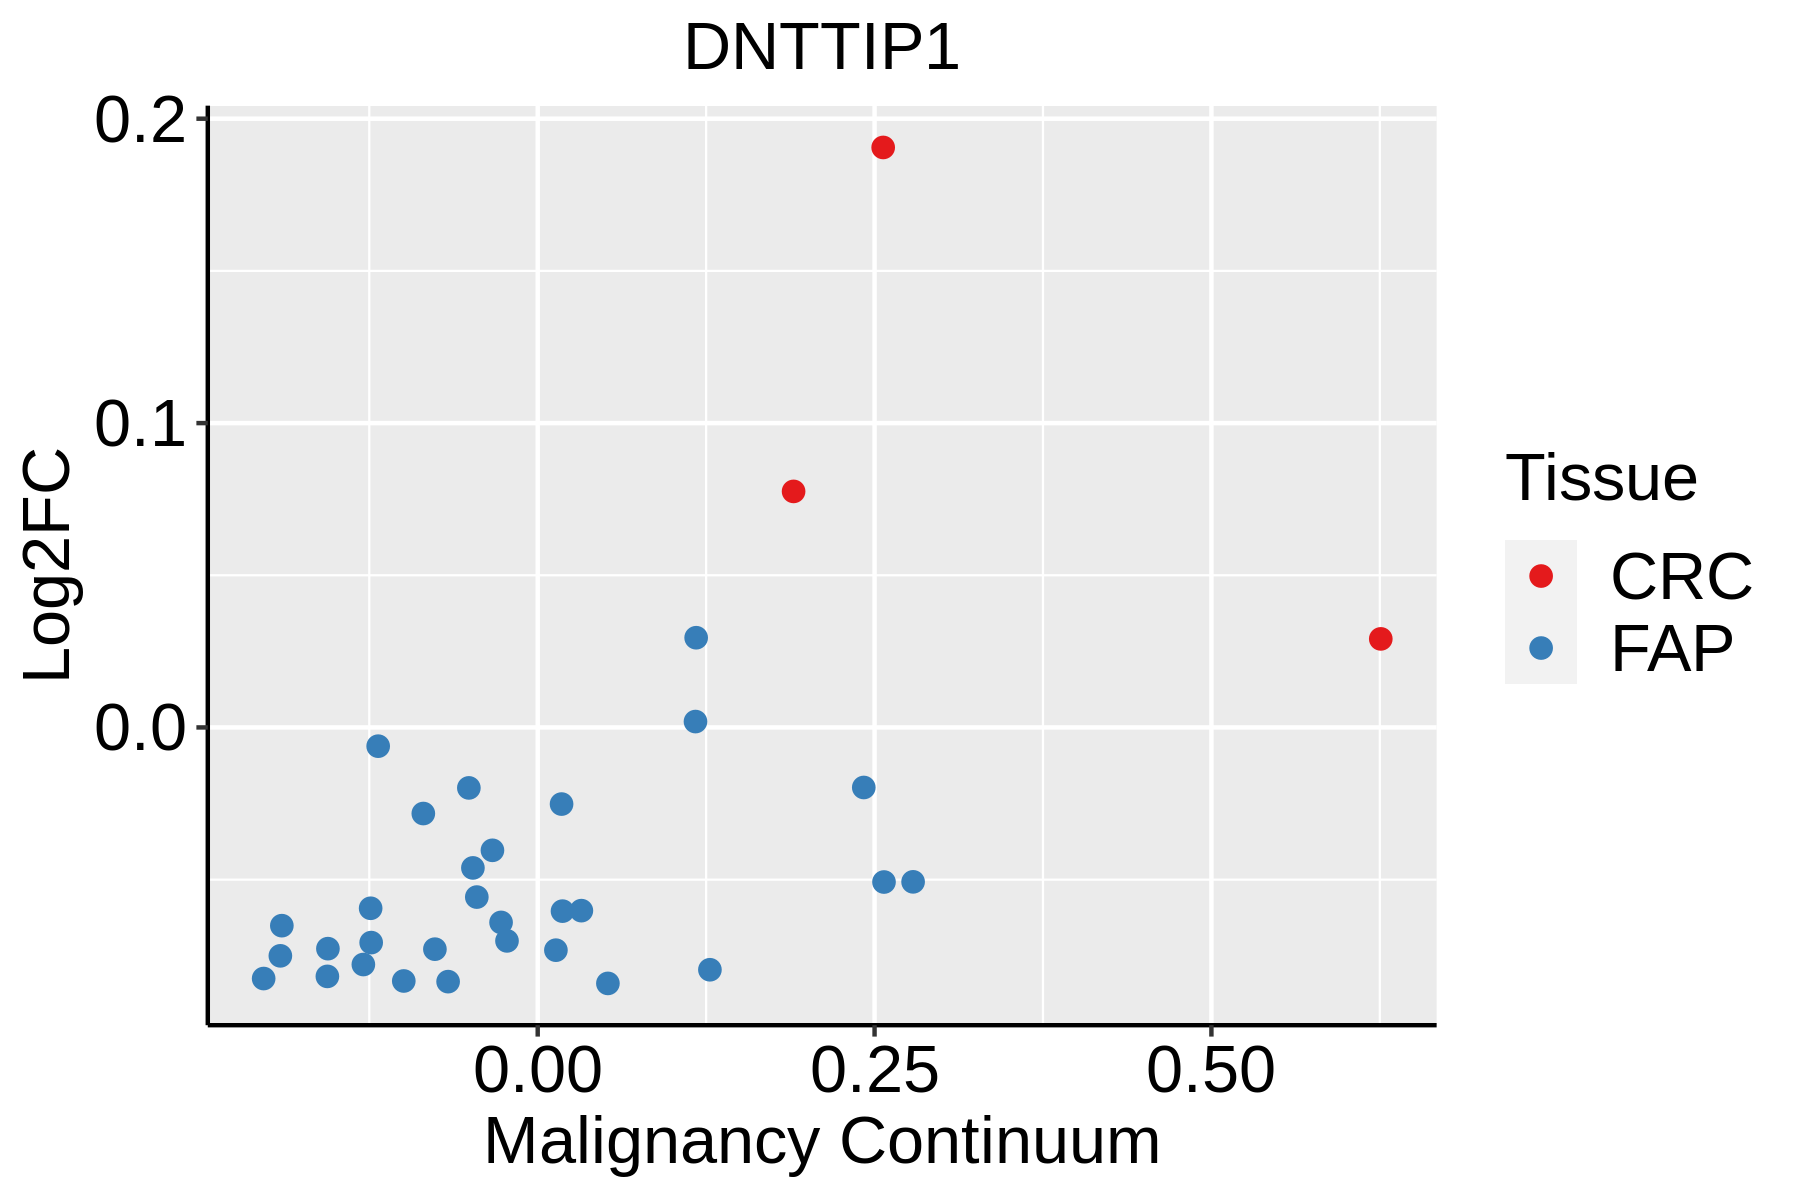 | FAP: Familial adenomatous polyposis |
| CRC: Colorectal cancer | ||
| Colorectum (HTA11) | 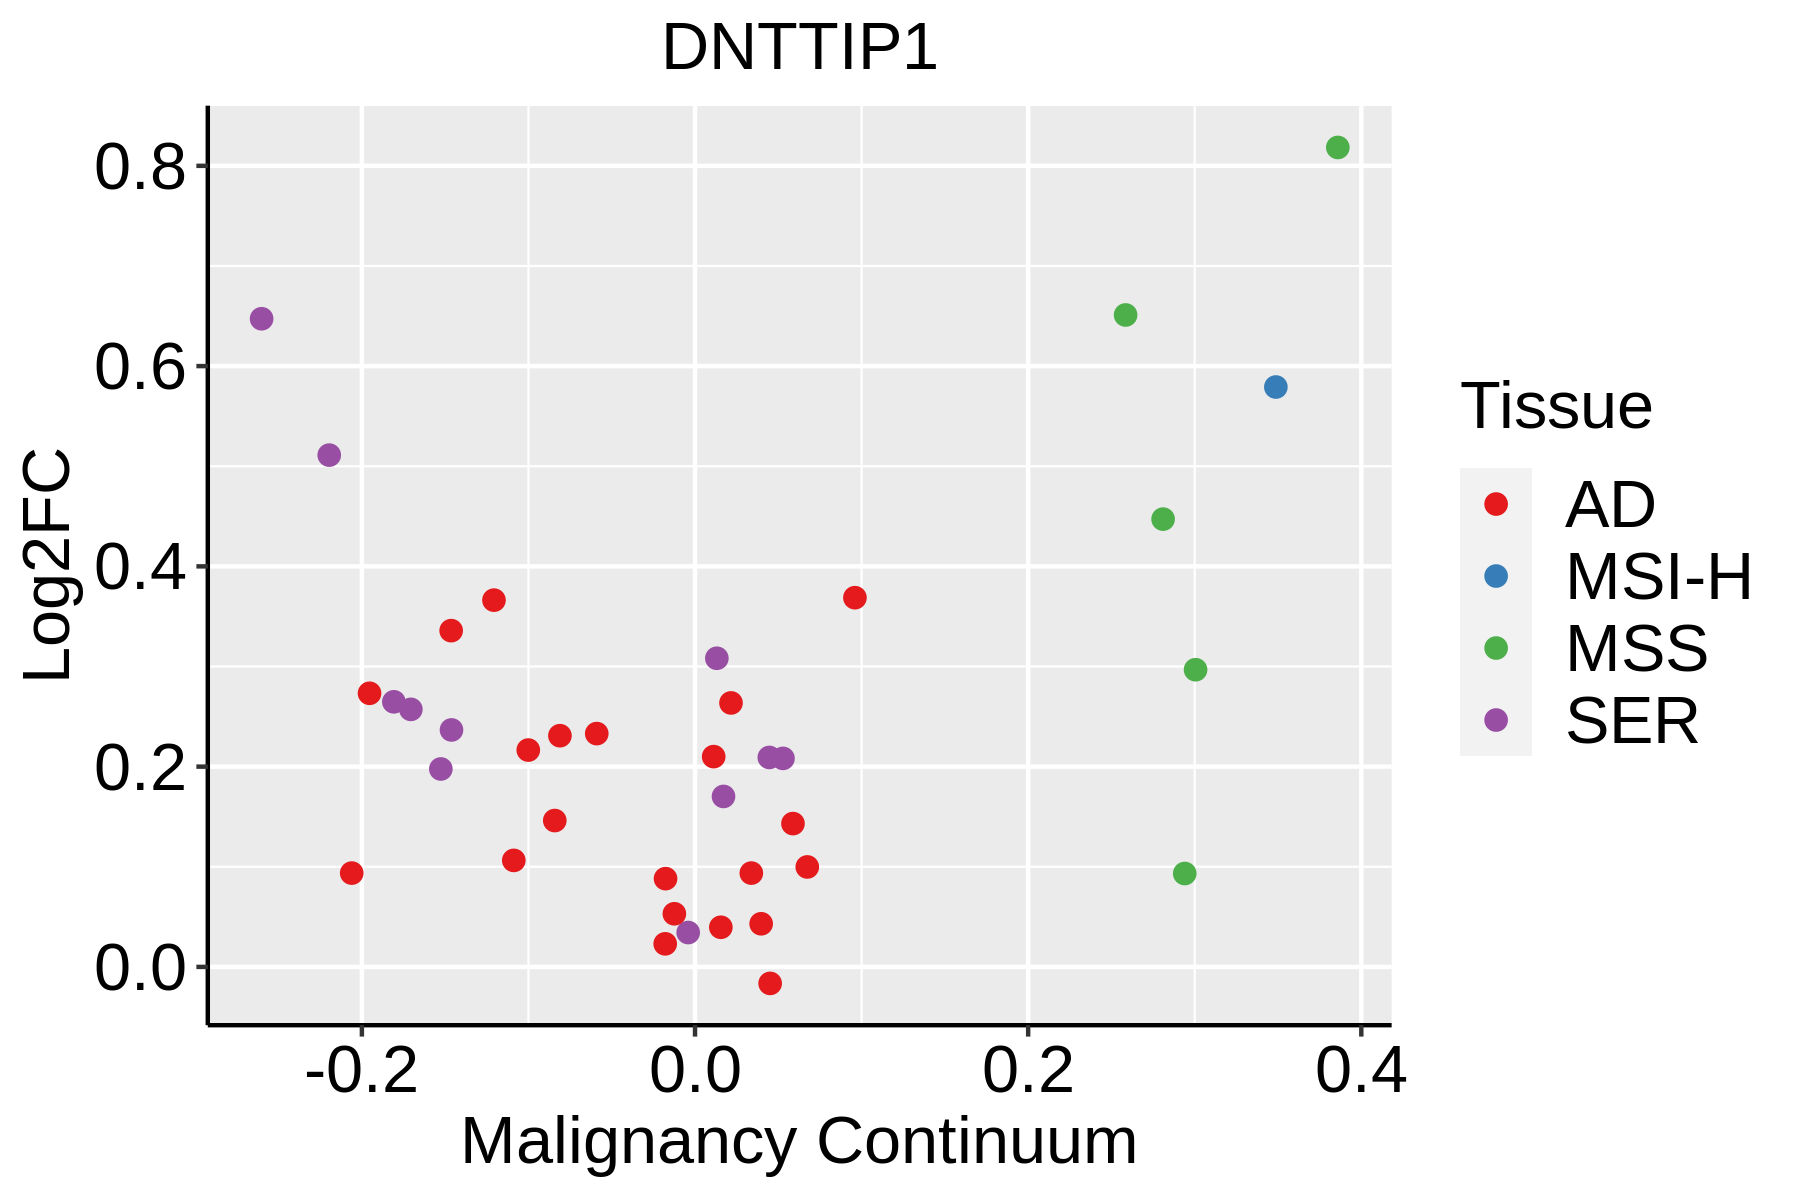 | AD: Adenomas |
| SER: Sessile serrated lesions | ||
| MSI-H: Microsatellite-high colorectal cancer | ||
| MSS: Microsatellite stable colorectal cancer | ||
| Esophagus | 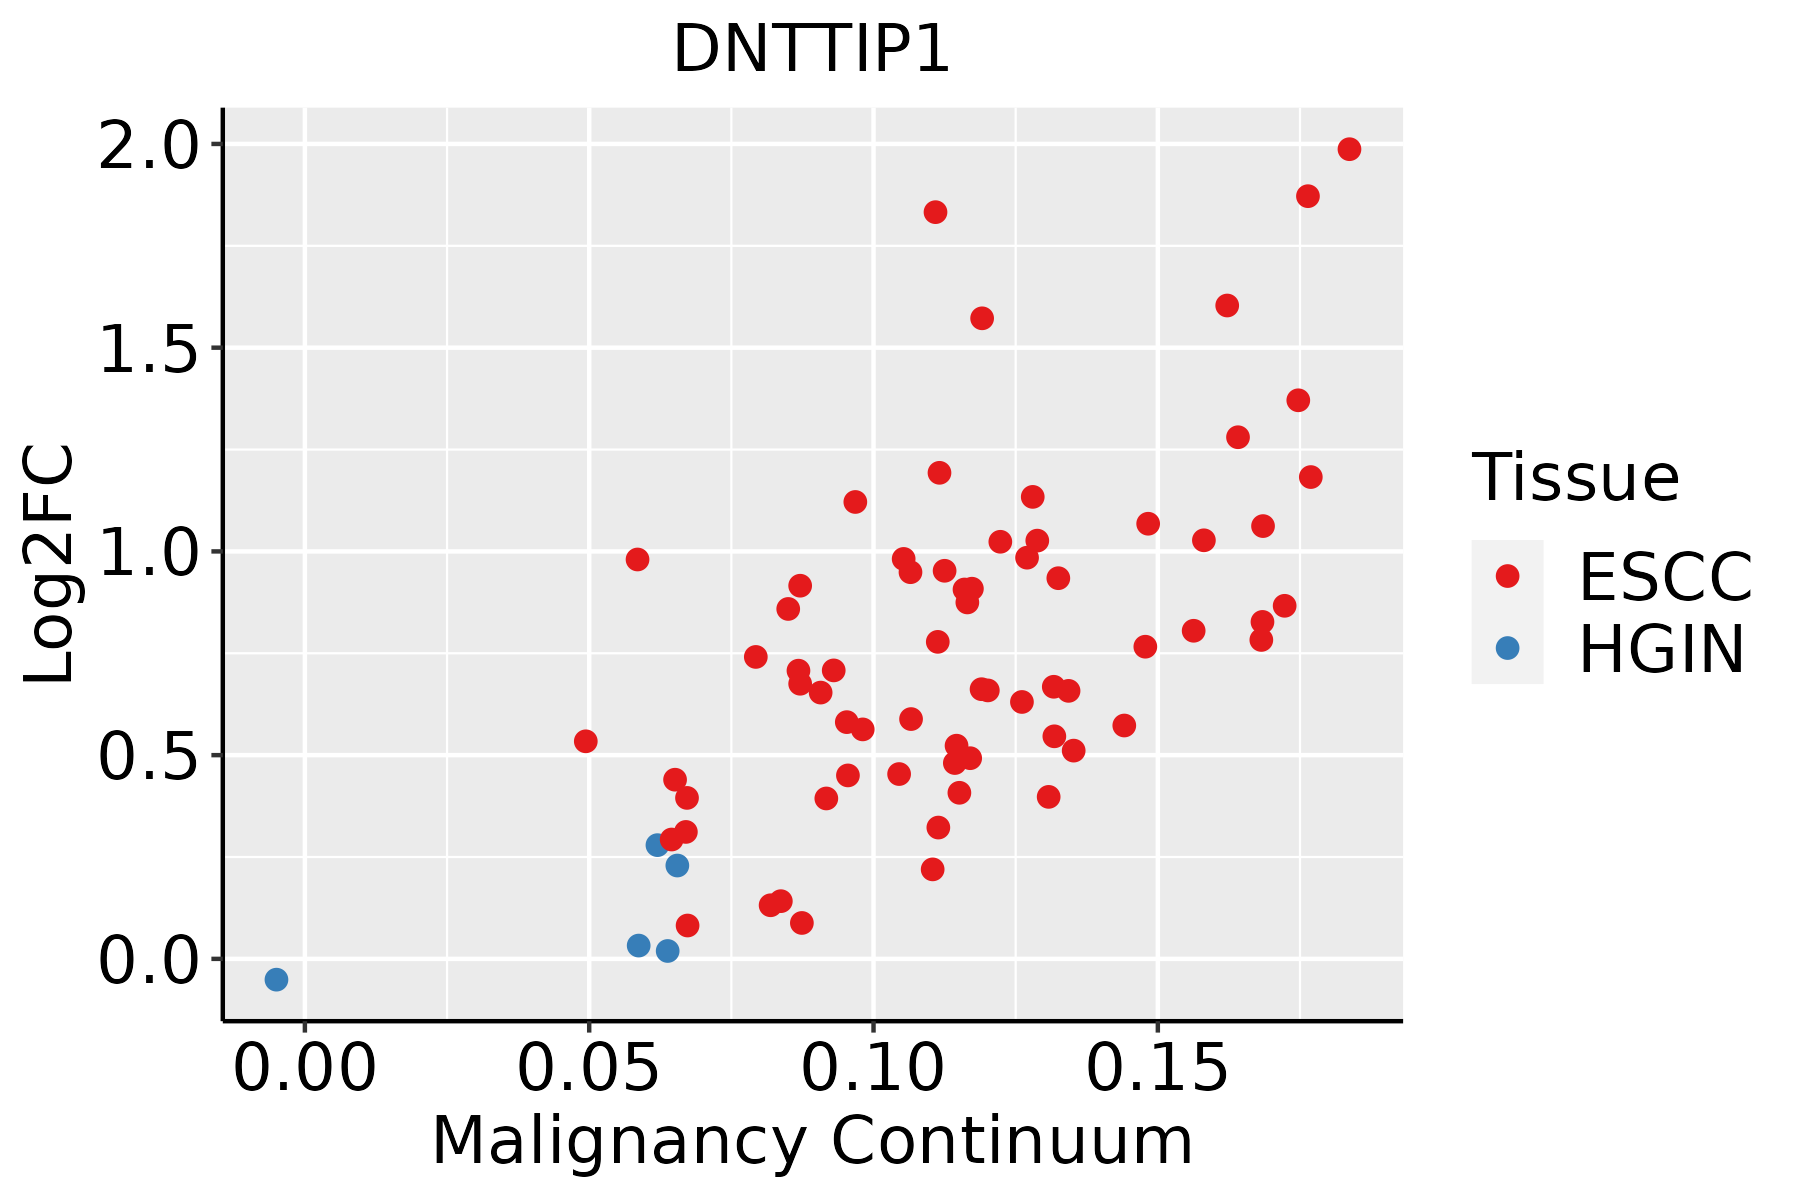 | ESCC: Esophageal squamous cell carcinoma |
| HGIN: High-grade intraepithelial neoplasias | ||
| LGIN: Low-grade intraepithelial neoplasias | ||
| Liver | 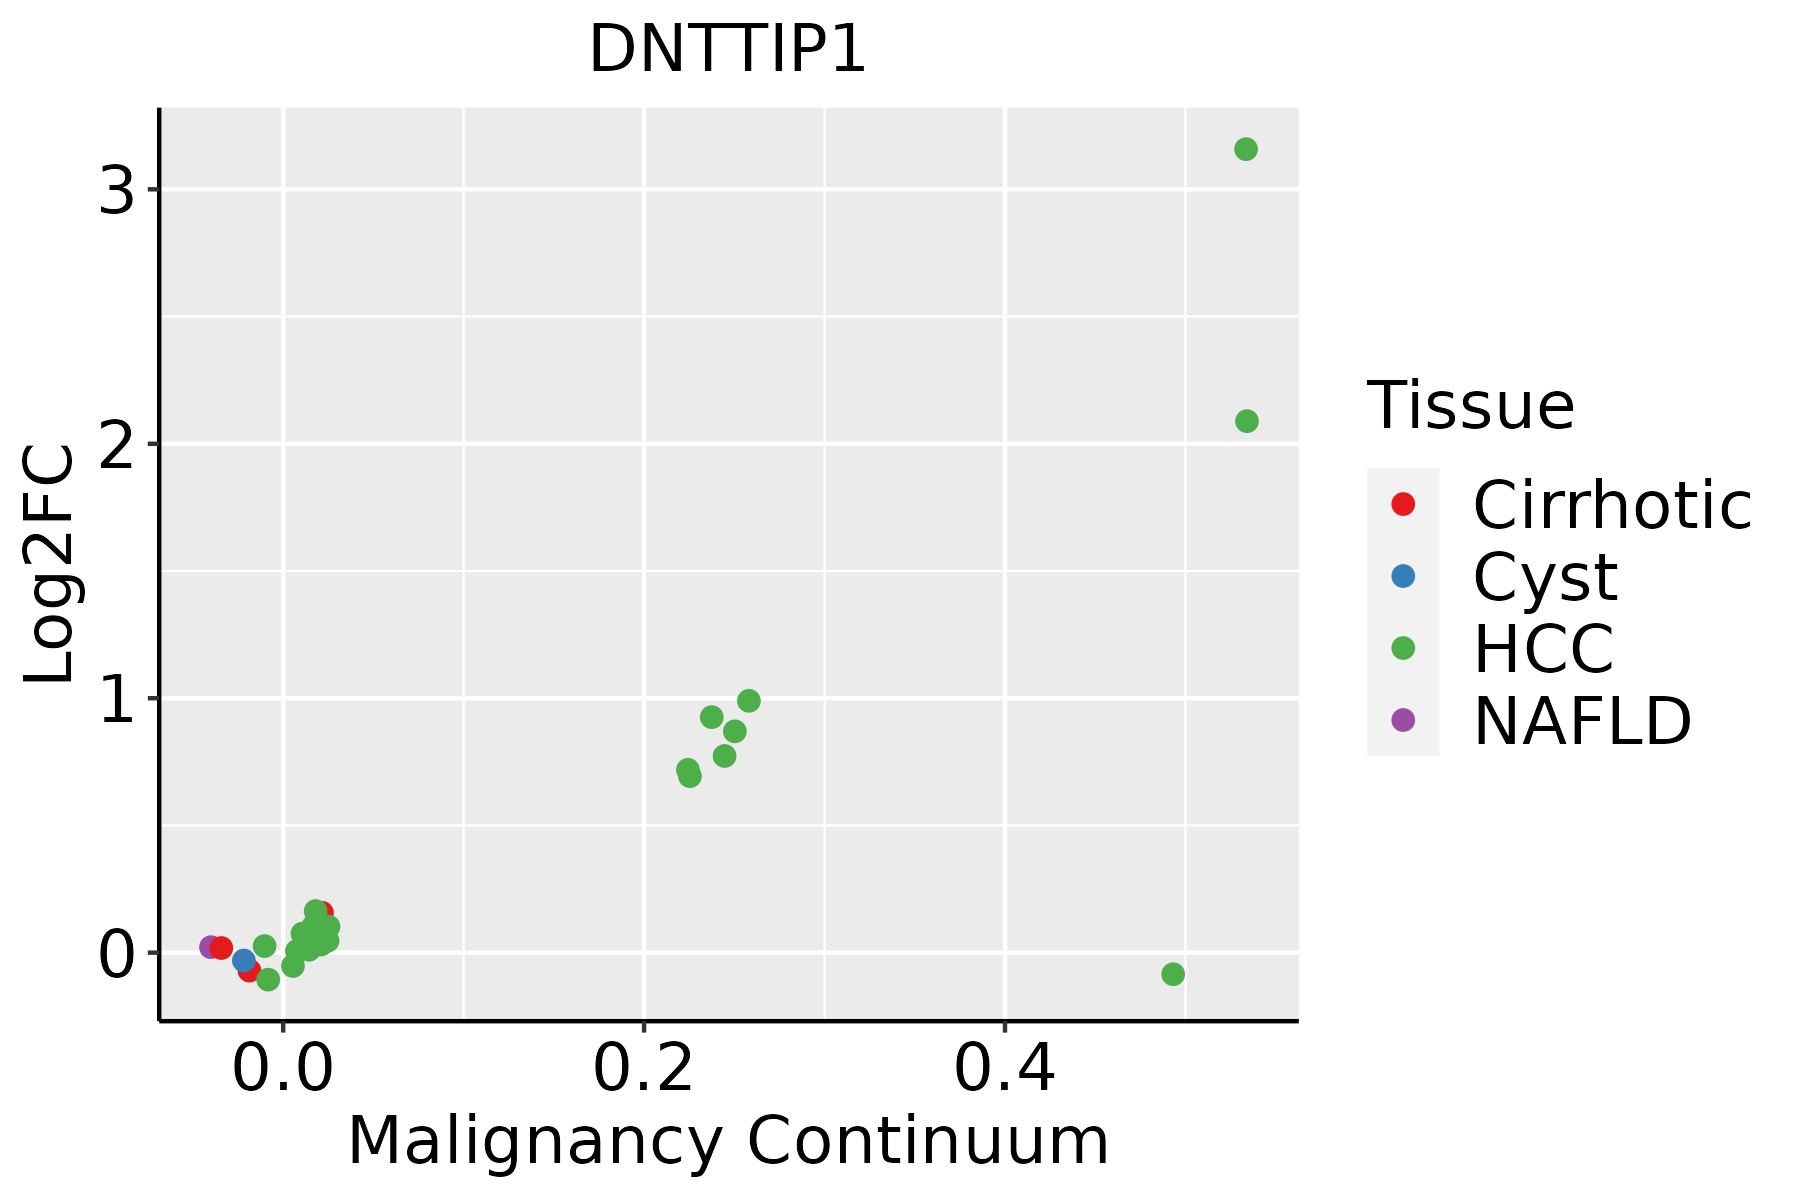 | HCC: Hepatocellular carcinoma |
| NAFLD: Non-alcoholic fatty liver disease | ||
| Oral Cavity | 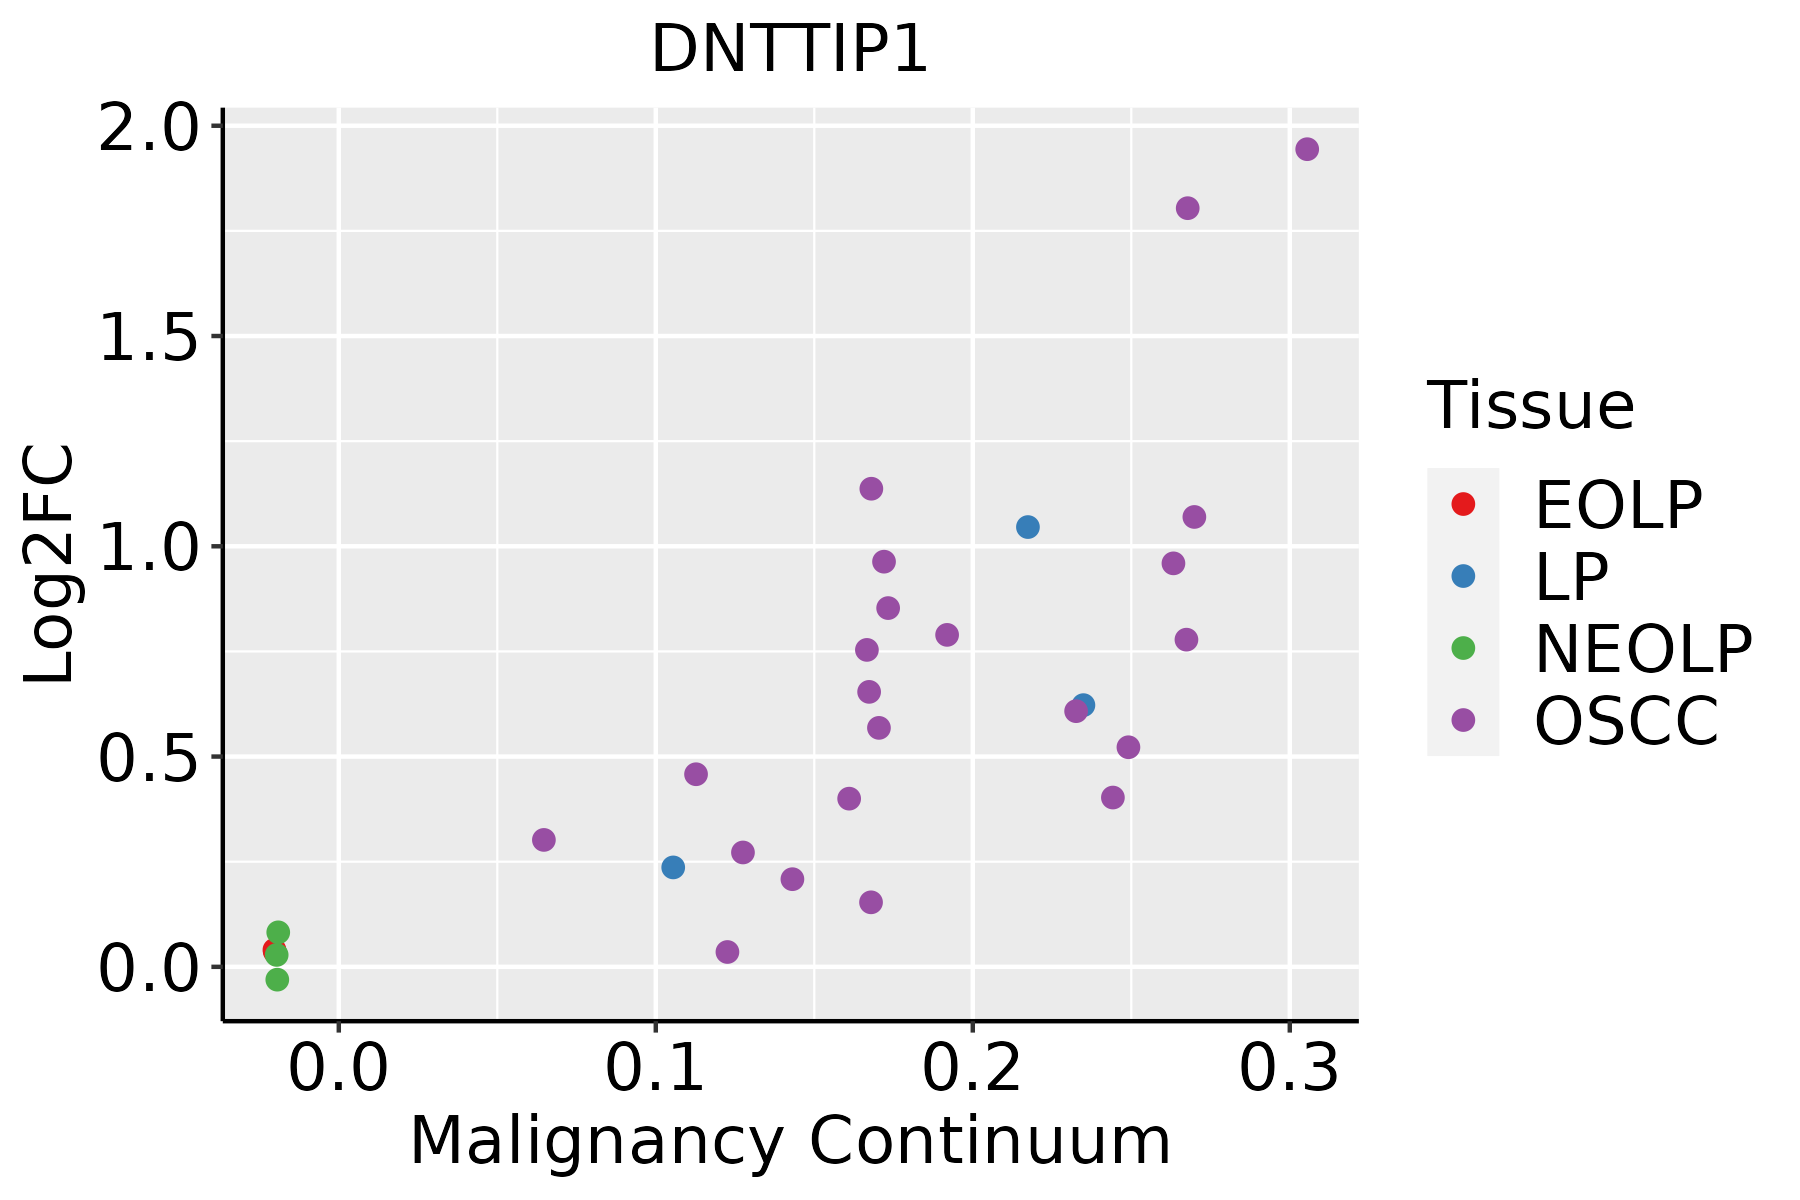 | EOLP: Erosive Oral lichen planus |
| LP: leukoplakia | ||
| NEOLP: Non-erosive oral lichen planus | ||
| OSCC: Oral squamous cell carcinoma | ||
| Prostate | 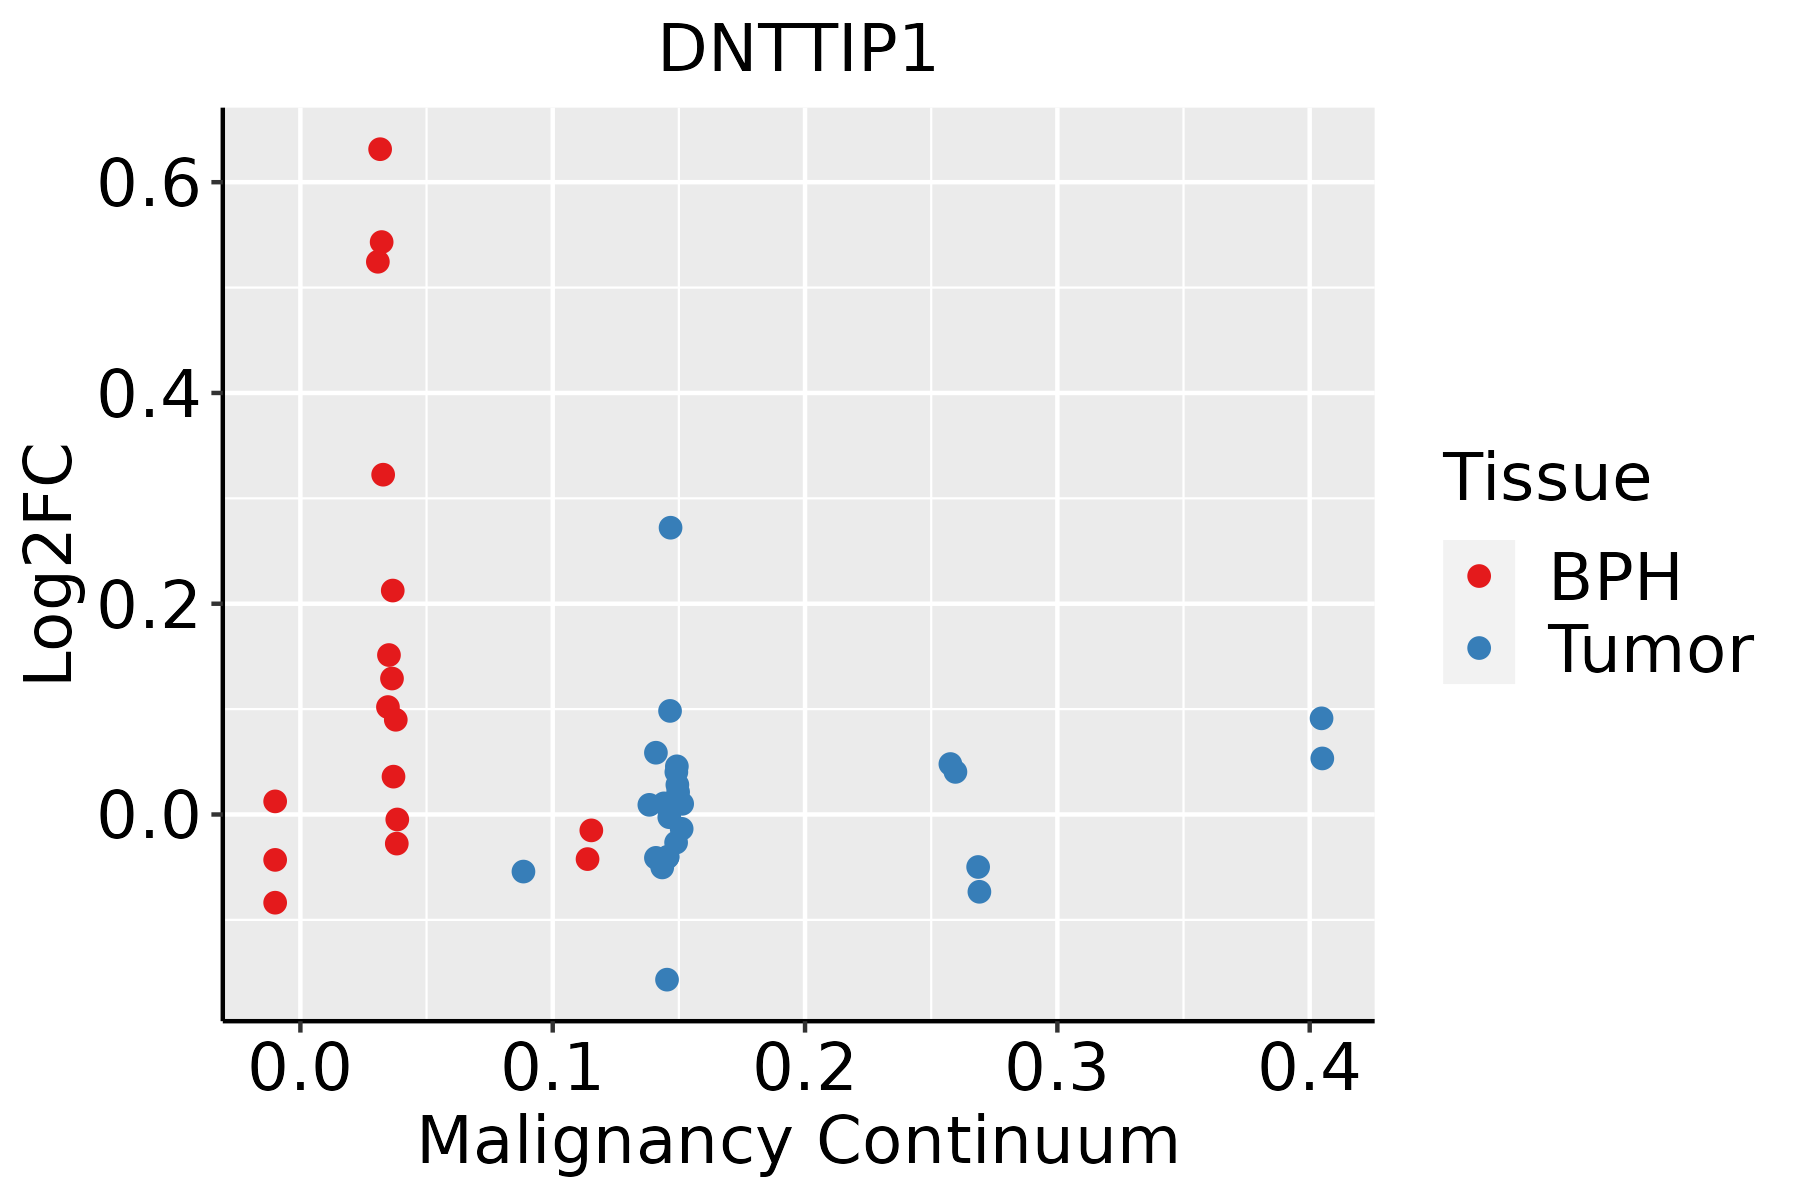 | BPH: Benign Prostatic Hyperplasia |
| Skin | 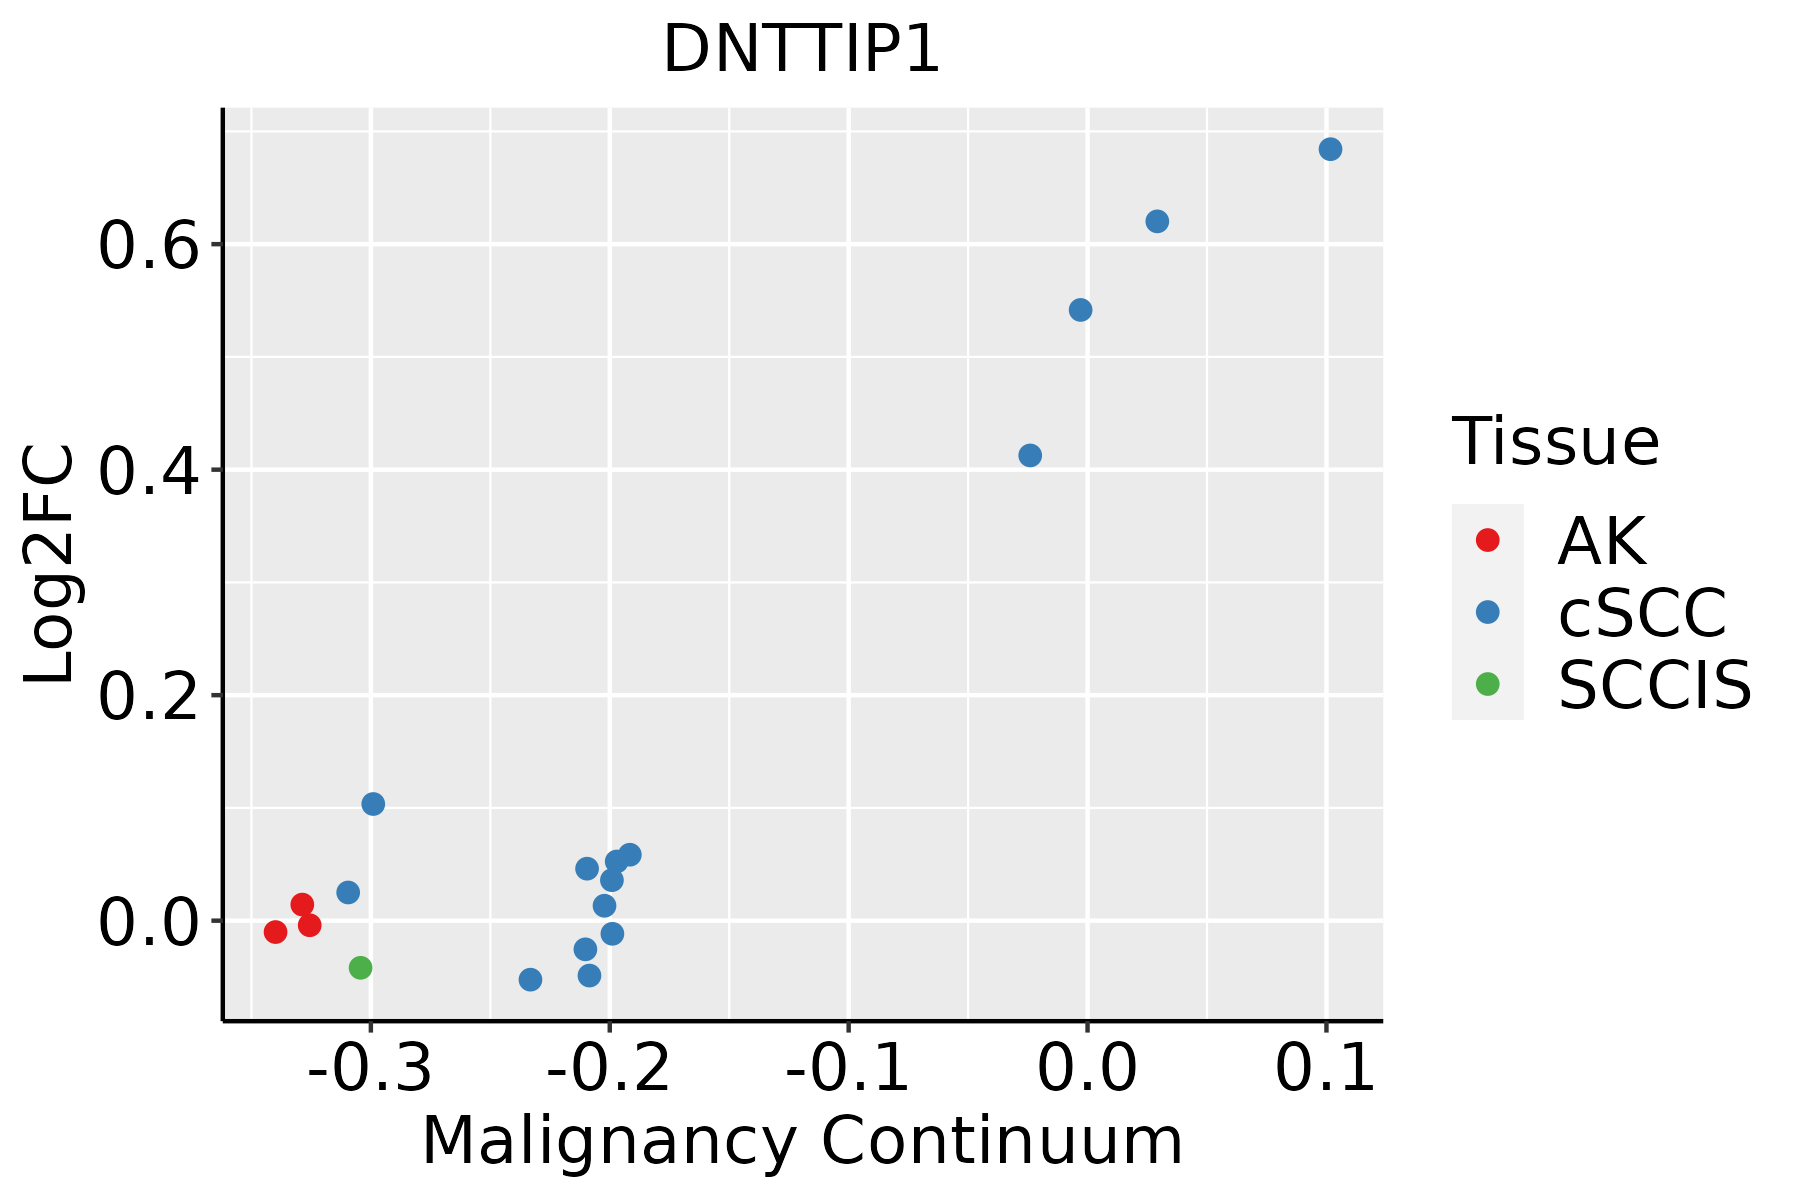 | AK: Actinic keratosis |
| cSCC: Cutaneous squamous cell carcinoma | ||
| SCCIS:squamous cell carcinoma in situ | ||
| Thyroid | 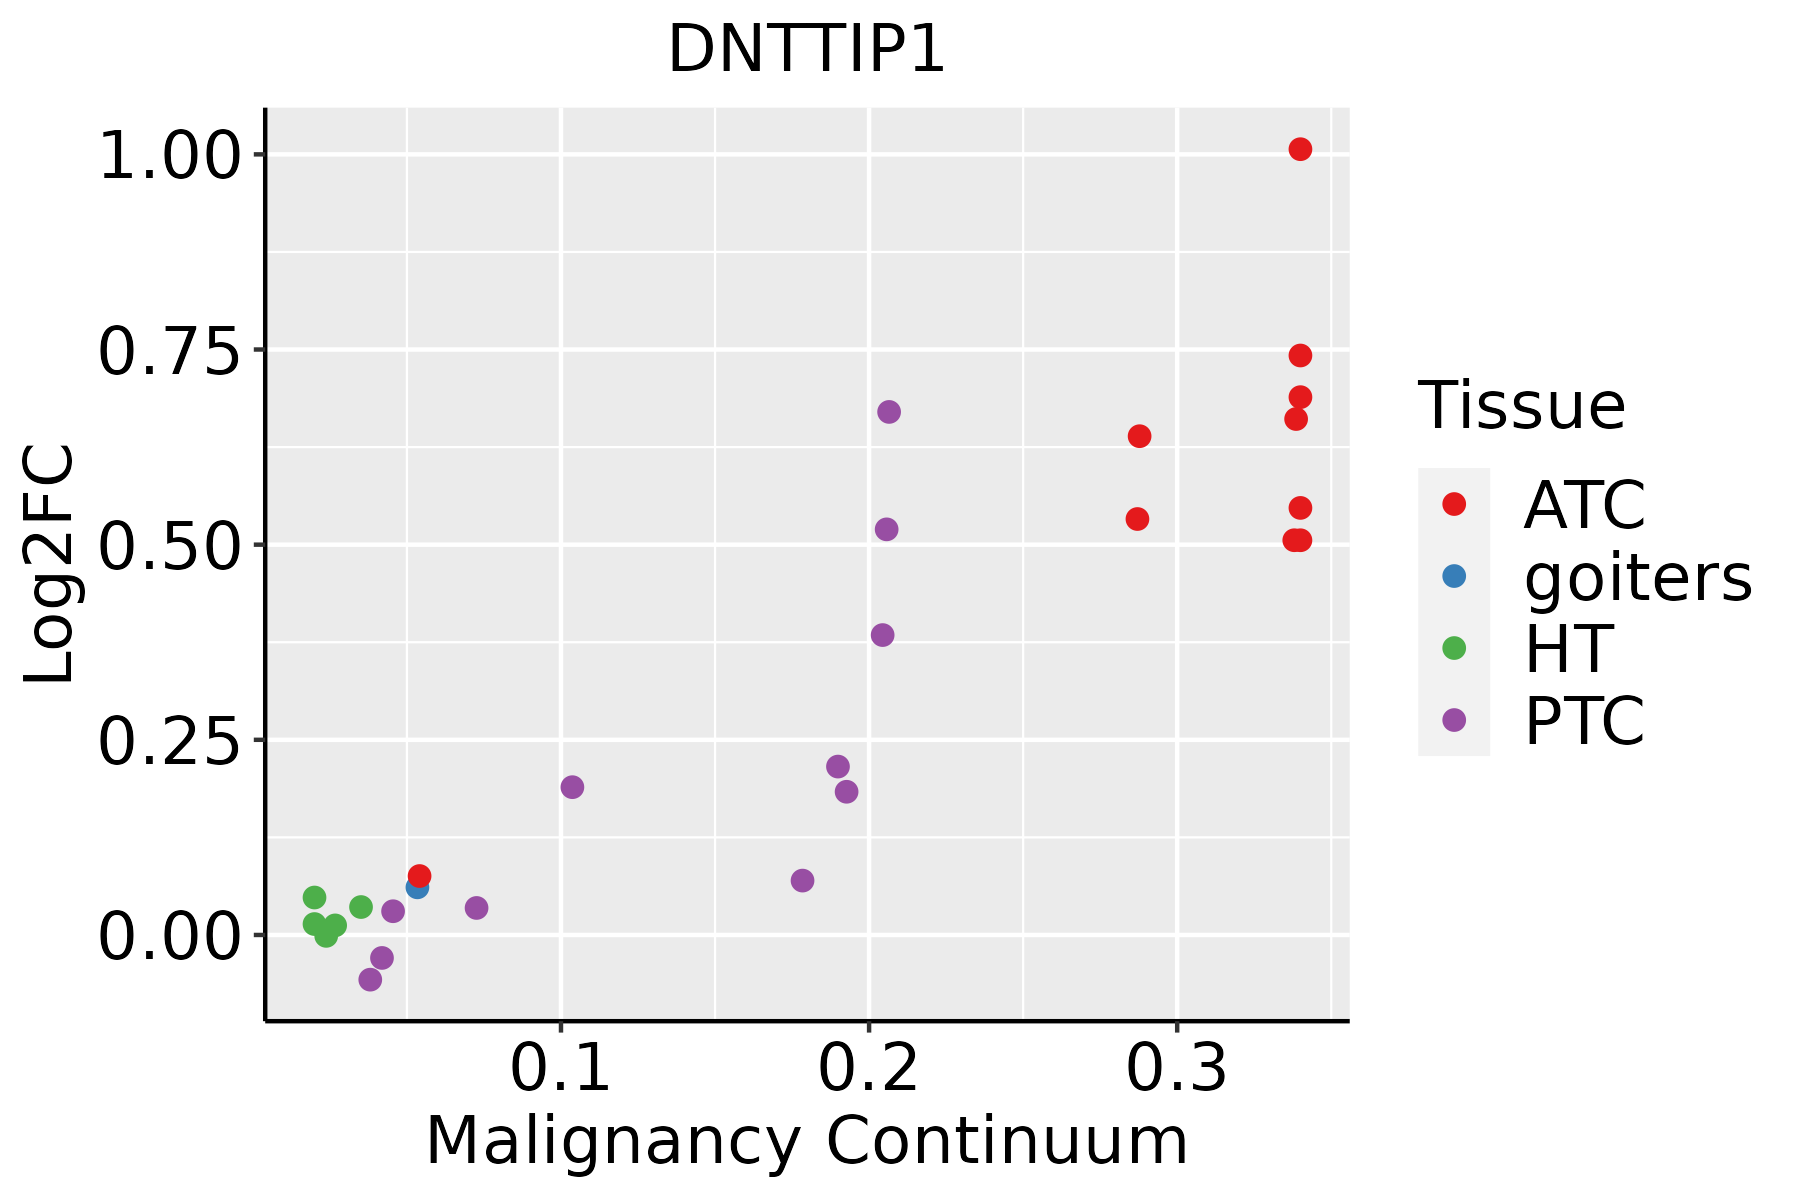 | ATC: Anaplastic thyroid cancer |
| HT: Hashimoto's thyroiditis | ||
| PTC: Papillary thyroid cancer |
| ∗log2FC in expression of this searched gene in stem-like cells from each diseased tissue sample relative to stem-like cells in normal samples in each tissue plotted against the malignancy continuum. Samples are colored based on if they are from different disease stage. |
Top |
Malignant transformation related pathway analysis |
| Find out the enriched GO biological processes and KEGG pathways involved in transition from healthy to precancer to cancer |
| Tissue | Disease Stage | Enriched GO biological Processes |
| Colorectum | AD |  |
| Colorectum | SER |  |
| Colorectum | MSS |  |
| Colorectum | MSI-H |  |
| Colorectum | FAP |  |
| ∗Top 15 enriched GO BP terms are showed in the bar plot of each disease state in each tissue. Each row represents a significant GO biological process which is colored according to the -log10(p.adjust). |
| Page: 1 2 3 4 5 6 7 8 9 |
| GO ID | Tissue | Disease Stage | Description | Gene Ratio | Bg Ratio | pvalue | p.adjust | Count |
| Page: 1 |
| Pathway ID | Tissue | Disease Stage | Description | Gene Ratio | Bg Ratio | pvalue | p.adjust | qvalue | Count |
| Page: 1 |
Top |
Cell-cell communication analysis |
| Identification of potential cell-cell interactions between two cell types and their ligand-receptor pairs for different disease states |
| Ligand | Receptor | LRpair | Pathway | Tissue | Disease Stage |
| Page: 1 |
Top |
Single-cell gene regulatory network inference analysis |
| Find out the significant the regulons (TFs) and the target genes of each regulon across cell types for different disease states |
| TF | Cell Type | Tissue | Disease Stage | Target Gene | RSS | Regulon Activity |
| ∗The dot plots of a searched regulon are shown for all cell subpopulations in each disease state of each tissue based on the regulon specific score inferred using pySCENIC and by calculating the average expression. |
| Page: 1 |
Top |
Somatic mutation of malignant transformation related genes |
| Annotation of somatic variants for genes involved in malignant transformation |
| Hugo Symbol | Variant Class | Variant Classification | dbSNP RS | HGVSc | HGVSp | HGVSp Short | SWISSPROT | BIOTYPE | SIFT | PolyPhen | Tumor Sample Barcode | Tissue | Histology | Sex | Age | Stage | Therapy Types | Drugs | Outcome |
| DNTTIP1 | SNV | Missense_Mutation | c.505G>A | p.Gly169Arg | p.G169R | Q9H147 | protein_coding | tolerated(0.05) | probably_damaging(0.962) | TCGA-AC-A23H-01 | Breast | breast invasive carcinoma | Female | >=65 | I/II | Unknown | Unknown | PD | |
| DNTTIP1 | SNV | Missense_Mutation | c.506G>A | p.Gly169Glu | p.G169E | Q9H147 | protein_coding | tolerated(0.06) | probably_damaging(0.943) | TCGA-AC-A23H-01 | Breast | breast invasive carcinoma | Female | >=65 | I/II | Unknown | Unknown | PD | |
| DNTTIP1 | SNV | Missense_Mutation | c.686G>C | p.Arg229Thr | p.R229T | Q9H147 | protein_coding | deleterious(0) | benign(0.329) | TCGA-AC-A23H-01 | Breast | breast invasive carcinoma | Female | >=65 | I/II | Unknown | Unknown | PD | |
| DNTTIP1 | SNV | Missense_Mutation | c.430N>A | p.Pro144Thr | p.P144T | Q9H147 | protein_coding | tolerated(0.05) | benign(0.436) | TCGA-C8-A12T-01 | Breast | breast invasive carcinoma | Female | <65 | I/II | Unknown | Unknown | SD | |
| DNTTIP1 | SNV | Missense_Mutation | novel | c.437T>A | p.Ile146Lys | p.I146K | Q9H147 | protein_coding | tolerated(0.68) | benign(0.143) | TCGA-EW-A1PB-01 | Breast | breast invasive carcinoma | Female | >=65 | III/IV | Unknown | Unknown | SD |
| DNTTIP1 | SNV | Missense_Mutation | novel | c.811N>A | p.Glu271Lys | p.E271K | Q9H147 | protein_coding | tolerated(0.27) | probably_damaging(0.997) | TCGA-DS-A1OB-01 | Cervix | cervical & endocervical cancer | Female | <65 | I/II | Chemotherapy | carboplatin | PD |
| DNTTIP1 | SNV | Missense_Mutation | c.775N>T | p.Arg259Trp | p.R259W | Q9H147 | protein_coding | deleterious(0.01) | probably_damaging(0.984) | TCGA-A6-5665-01 | Colorectum | colon adenocarcinoma | Female | >=65 | I/II | Unknown | Unknown | PD | |
| DNTTIP1 | SNV | Missense_Mutation | c.692N>T | p.Arg231Ile | p.R231I | Q9H147 | protein_coding | deleterious(0) | possibly_damaging(0.66) | TCGA-A6-6141-01 | Colorectum | colon adenocarcinoma | Male | <65 | I/II | Chemotherapy | 5-fu | SD | |
| DNTTIP1 | SNV | Missense_Mutation | c.298N>A | p.Val100Met | p.V100M | Q9H147 | protein_coding | deleterious(0.02) | probably_damaging(0.916) | TCGA-AA-3864-01 | Colorectum | colon adenocarcinoma | Male | >=65 | I/II | Unknown | Unknown | SD | |
| DNTTIP1 | SNV | Missense_Mutation | c.951N>C | p.Glu317Asp | p.E317D | Q9H147 | protein_coding | tolerated(0.5) | probably_damaging(0.986) | TCGA-AY-6196-01 | Colorectum | colon adenocarcinoma | Male | <65 | III/IV | Unknown | Unknown | SD |
| Page: 1 2 3 4 |
Top |
Related drugs of malignant transformation related genes |
| Identification of chemicals and drugs interact with genes involved in malignant transfromation |
| (DGIdb 4.0) |
| Entrez ID | Symbol | Category | Interaction Types | Drug Claim Name | Drug Name | PMIDs |
| Page: 1 |

Copyright 2023-Present -The University of Texas Health Science Center at Houston |