| Tissue | Expression Dynamics | Abbreviation |
| Endometrium | 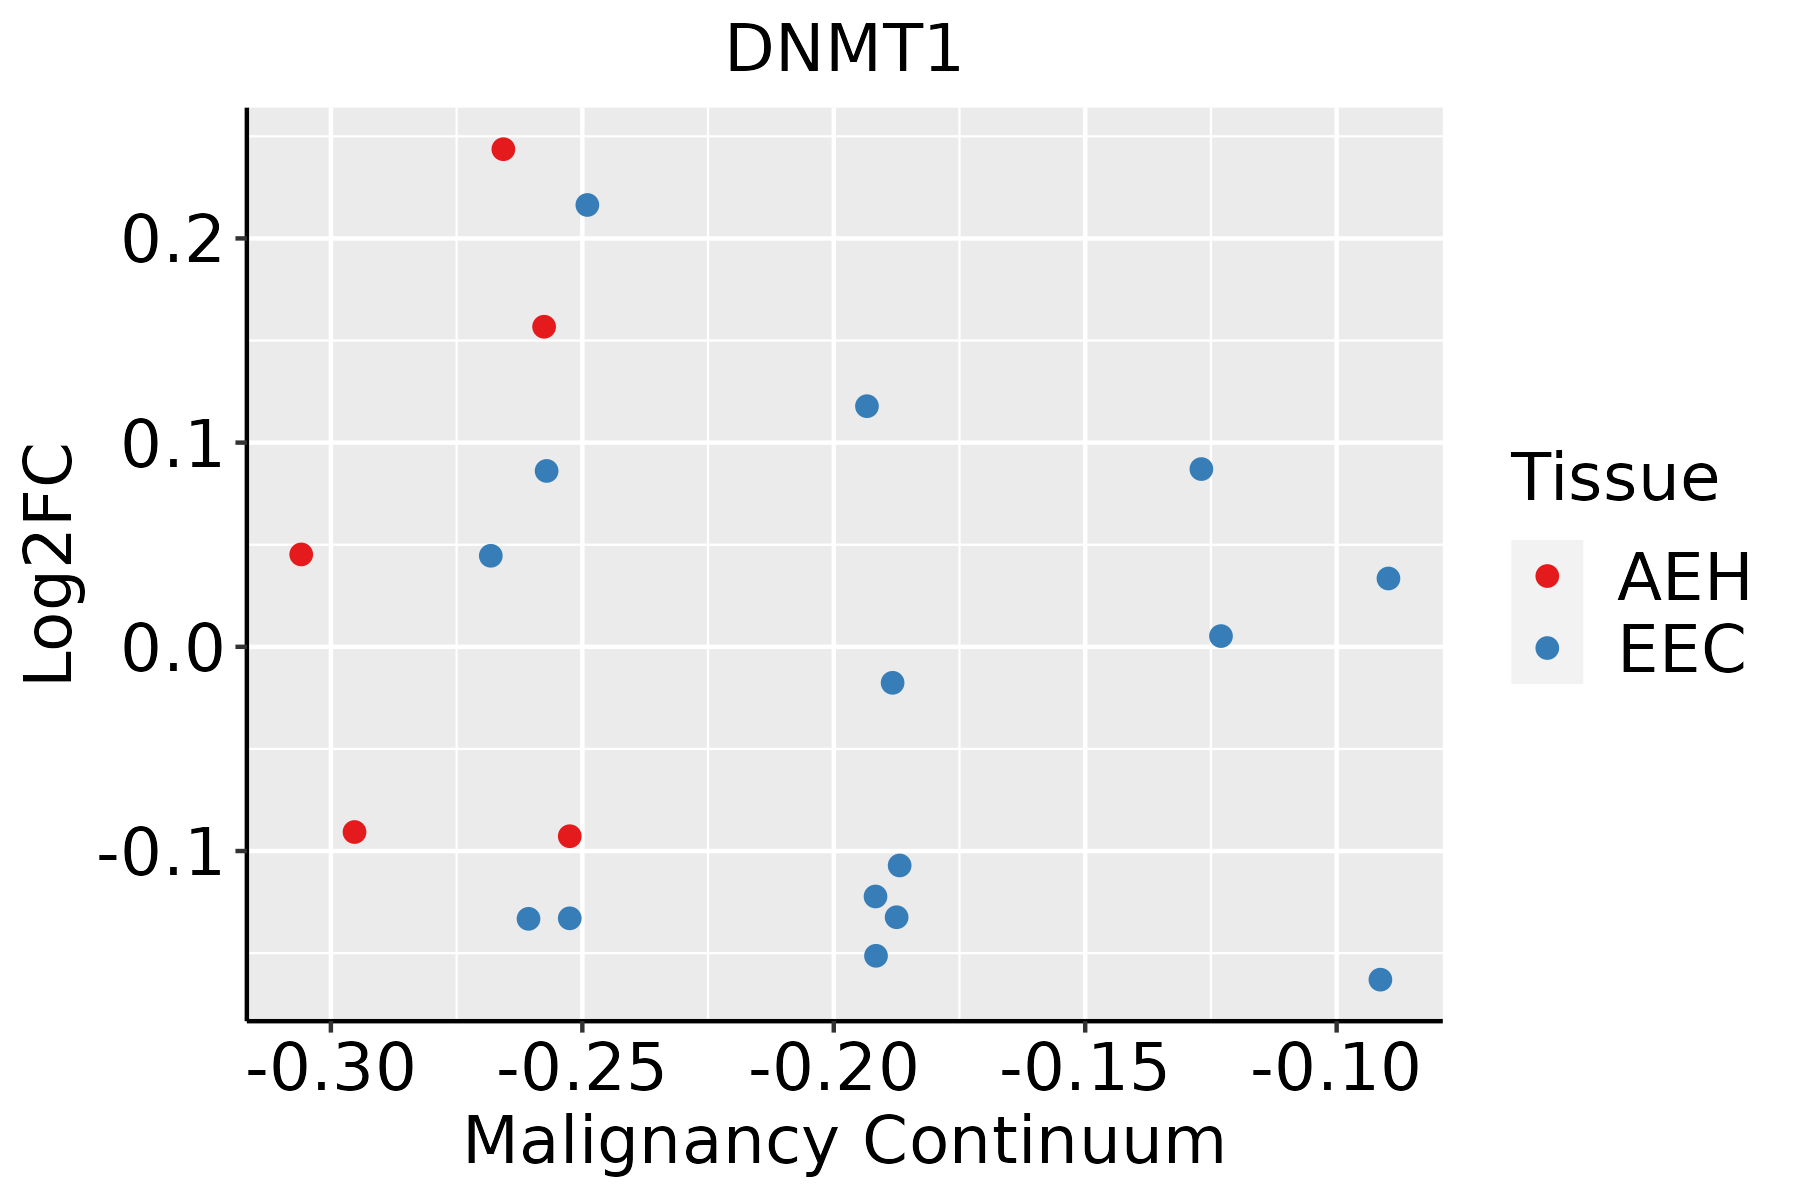 | AEH: Atypical endometrial hyperplasia |
| EEC: Endometrioid Cancer |
| Esophagus |  | ESCC: Esophageal squamous cell carcinoma |
| HGIN: High-grade intraepithelial neoplasias |
| LGIN: Low-grade intraepithelial neoplasias |
| Liver |  | HCC: Hepatocellular carcinoma |
| NAFLD: Non-alcoholic fatty liver disease |
| Oral Cavity |  | EOLP: Erosive Oral lichen planus |
| LP: leukoplakia |
| NEOLP: Non-erosive oral lichen planus |
| OSCC: Oral squamous cell carcinoma |
| Skin |  | AK: Actinic keratosis |
| cSCC: Cutaneous squamous cell carcinoma |
| SCCIS:squamous cell carcinoma in situ |
| Thyroid |  | ATC: Anaplastic thyroid cancer |
| HT: Hashimoto's thyroiditis |
| PTC: Papillary thyroid cancer |
| GO ID | Tissue | Disease Stage | Description | Gene Ratio | Bg Ratio | pvalue | p.adjust | Count |
| GO:00486604 | Endometrium | AEH | regulation of smooth muscle cell proliferation | 43/2100 | 180/18723 | 1.09e-06 | 3.68e-05 | 43 |
| GO:200125210 | Endometrium | AEH | positive regulation of chromosome organization | 25/2100 | 82/18723 | 1.95e-06 | 5.93e-05 | 25 |
| GO:00486594 | Endometrium | AEH | smooth muscle cell proliferation | 43/2100 | 184/18723 | 2.04e-06 | 6.14e-05 | 43 |
| GO:00330022 | Endometrium | AEH | muscle cell proliferation | 51/2100 | 248/18723 | 1.26e-05 | 2.77e-04 | 51 |
| GO:00072657 | Endometrium | AEH | Ras protein signal transduction | 63/2100 | 337/18723 | 3.09e-05 | 5.66e-04 | 63 |
| GO:00426925 | Endometrium | AEH | muscle cell differentiation | 68/2100 | 384/18723 | 8.88e-05 | 1.30e-03 | 68 |
| GO:00330446 | Endometrium | AEH | regulation of chromosome organization | 36/2100 | 187/18723 | 8.27e-04 | 7.73e-03 | 36 |
| GO:00011017 | Endometrium | AEH | response to acid chemical | 28/2100 | 135/18723 | 9.24e-04 | 8.43e-03 | 28 |
| GO:00486613 | Endometrium | AEH | positive regulation of smooth muscle cell proliferation | 23/2100 | 104/18723 | 1.03e-03 | 9.15e-03 | 23 |
| GO:00432005 | Endometrium | AEH | response to amino acid | 24/2100 | 116/18723 | 2.14e-03 | 1.65e-02 | 24 |
| GO:00063258 | Endometrium | AEH | chromatin organization | 64/2100 | 409/18723 | 3.69e-03 | 2.52e-02 | 64 |
| GO:00712302 | Endometrium | AEH | cellular response to amino acid stimulus | 16/2100 | 71/18723 | 4.68e-03 | 2.99e-02 | 16 |
| GO:1904705 | Endometrium | AEH | regulation of vascular associated smooth muscle cell proliferation | 19/2100 | 90/18723 | 4.69e-03 | 2.99e-02 | 19 |
| GO:1990874 | Endometrium | AEH | vascular associated smooth muscle cell proliferation | 19/2100 | 91/18723 | 5.32e-03 | 3.32e-02 | 19 |
| GO:1904707 | Endometrium | AEH | positive regulation of vascular associated smooth muscle cell proliferation | 12/2100 | 49/18723 | 6.75e-03 | 3.94e-02 | 12 |
| GO:00712293 | Endometrium | AEH | cellular response to acid chemical | 17/2100 | 80/18723 | 6.76e-03 | 3.94e-02 | 17 |
| GO:0031453 | Endometrium | AEH | positive regulation of heterochromatin assembly | 5/2100 | 12/18723 | 7.10e-03 | 4.09e-02 | 5 |
| GO:0120263 | Endometrium | AEH | positive regulation of heterochromatin organization | 5/2100 | 12/18723 | 7.10e-03 | 4.09e-02 | 5 |
| GO:0051148 | Endometrium | AEH | negative regulation of muscle cell differentiation | 15/2100 | 68/18723 | 7.45e-03 | 4.23e-02 | 15 |
| GO:200125213 | Endometrium | EEC | positive regulation of chromosome organization | 26/2168 | 82/18723 | 9.70e-07 | 3.31e-05 | 26 |
| Hugo Symbol | Variant Class | Variant Classification | dbSNP RS | HGVSc | HGVSp | HGVSp Short | SWISSPROT | BIOTYPE | SIFT | PolyPhen | Tumor Sample Barcode | Tissue | Histology | Sex | Age | Stage | Therapy Types | Drugs | Outcome |
| DNMT1 | SNV | Missense_Mutation | | c.461C>T | p.Pro154Leu | p.P154L | P26358 | protein_coding | tolerated_low_confidence(0.06) | benign(0) | TCGA-AN-A0FS-01 | Breast | breast invasive carcinoma | Female | <65 | I/II | Unknown | Unknown | SD |
| DNMT1 | SNV | Missense_Mutation | | c.2366N>T | p.Pro789Leu | p.P789L | P26358 | protein_coding | deleterious(0.03) | possibly_damaging(0.778) | TCGA-AR-A251-01 | Breast | breast invasive carcinoma | Female | <65 | III/IV | Chemotherapy | doxorubicin | SD |
| DNMT1 | SNV | Missense_Mutation | | c.4084G>C | p.Asp1362His | p.D1362H | P26358 | protein_coding | deleterious(0) | probably_damaging(0.987) | TCGA-BH-A0GY-01 | Breast | breast invasive carcinoma | Female | >=65 | I/II | Chemotherapy | cyotxan | SD |
| DNMT1 | SNV | Missense_Mutation | | c.3744G>T | p.Met1248Ile | p.M1248I | P26358 | protein_coding | deleterious(0) | probably_damaging(0.995) | TCGA-BH-A0GY-01 | Breast | breast invasive carcinoma | Female | >=65 | I/II | Chemotherapy | cyotxan | SD |
| DNMT1 | SNV | Missense_Mutation | | c.2401N>A | p.Asp801Asn | p.D801N | P26358 | protein_coding | tolerated(0.17) | benign(0.131) | TCGA-BH-A18G-01 | Breast | breast invasive carcinoma | Female | >=65 | I/II | Unknown | Unknown | SD |
| DNMT1 | SNV | Missense_Mutation | novel | c.3280N>T | p.Gly1094Cys | p.G1094C | P26358 | protein_coding | deleterious(0) | probably_damaging(0.967) | TCGA-C8-A3M8-01 | Breast | breast invasive carcinoma | Female | >=65 | I/II | Hormone Therapy | tamoxiphen | CR |
| DNMT1 | SNV | Missense_Mutation | novel | c.4388N>T | p.Ser1463Leu | p.S1463L | P26358 | protein_coding | deleterious(0.01) | possibly_damaging(0.662) | TCGA-C8-A8HQ-01 | Breast | breast invasive carcinoma | Female | <65 | I/II | Unknown | Unknown | SD |
| DNMT1 | SNV | Missense_Mutation | | c.2980N>C | p.Asp994His | p.D994H | P26358 | protein_coding | deleterious(0) | probably_damaging(0.982) | TCGA-E2-A1B6-01 | Breast | breast invasive carcinoma | Female | <65 | I/II | Unspecific | Adriamycin | SD |
| DNMT1 | SNV | Missense_Mutation | rs749258509 | c.2623N>A | p.Asp875Asn | p.D875N | P26358 | protein_coding | tolerated(0.12) | benign(0.043) | TCGA-EW-A1PA-01 | Breast | breast invasive carcinoma | Female | <65 | I/II | Chemotherapy | cyclophosphamide | SD |
| DNMT1 | insertion | Nonsense_Mutation | novel | c.1100_1101insGTGGAGGGCTGGGCGCGGTGGCTCATGCCTGTAATCCTAGCACTTT | p.Lys368TrpfsTer11 | p.K368Wfs*11 | P26358 | protein_coding | | | TCGA-AN-A046-01 | Breast | breast invasive carcinoma | Female | >=65 | I/II | Unknown | Unknown | SD |
| Entrez ID | Symbol | Category | Interaction Types | Drug Claim Name | Drug Name | PMIDs |
| 1786 | DNMT1 | DRUG RESISTANCE, ENZYME, DRUGGABLE GENOME, CLINICALLY ACTIONABLE | | Guadecitabine | GUADECITABINE | |
| 1786 | DNMT1 | DRUG RESISTANCE, ENZYME, DRUGGABLE GENOME, CLINICALLY ACTIONABLE | | DEMETHOXYCURCUMIN | DEMETHOXYCURCUMIN | 19112019 |
| 1786 | DNMT1 | DRUG RESISTANCE, ENZYME, DRUGGABLE GENOME, CLINICALLY ACTIONABLE | | 5-FLUORODEOXYURIDINE | FLOXURIDINE | 15899874 |
| 1786 | DNMT1 | DRUG RESISTANCE, ENZYME, DRUGGABLE GENOME, CLINICALLY ACTIONABLE | | IFOSFAMIDE | IFOSFAMIDE | |
| 1786 | DNMT1 | DRUG RESISTANCE, ENZYME, DRUGGABLE GENOME, CLINICALLY ACTIONABLE | | TETRAHYDROCURCUMIN | TETRAHYDROCURCUMIN | 19112019 |
| 1786 | DNMT1 | DRUG RESISTANCE, ENZYME, DRUGGABLE GENOME, CLINICALLY ACTIONABLE | | PMID27376512-Compound-PG-11048 | | |
| 1786 | DNMT1 | DRUG RESISTANCE, ENZYME, DRUGGABLE GENOME, CLINICALLY ACTIONABLE | | DNDI1417346 | CHEMBL1490332 | |
| 1786 | DNMT1 | DRUG RESISTANCE, ENZYME, DRUGGABLE GENOME, CLINICALLY ACTIONABLE | | S-110 | | |
| 1786 | DNMT1 | DRUG RESISTANCE, ENZYME, DRUGGABLE GENOME, CLINICALLY ACTIONABLE | | ARSENIC TRIOXIDE | | 16613325 |
| 1786 | DNMT1 | DRUG RESISTANCE, ENZYME, DRUGGABLE GENOME, CLINICALLY ACTIONABLE | | PMID27376512-Compound-CROs | | |


