
|
|||||
|
 | |
| |
| |
| |
| |
| |
|
Gene: DNM1L |
Gene summary for DNM1L |
| Gene information | Species | Human | Gene symbol | DNM1L | Gene ID | 10059 |
| Gene name | dynamin 1 like | |
| Gene Alias | DLP1 | |
| Cytomap | 12p11.21 | |
| Gene Type | protein-coding | GO ID | GO:0000266 | UniProtAcc | B4DYR6 |
Top |
Malignant transformation analysis |
| Identification of the aberrant gene expression in precancerous and cancerous lesions by comparing the gene expression of stem-like cells in diseased tissues with normal stem cells |
| Entrez ID | Symbol | Replicates | Species | Organ | Tissue | Adj P-value | Log2FC | Malignancy |
| 10059 | DNM1L | CA_HPV_1 | Human | Cervix | CC | 1.37e-02 | -6.49e-02 | 0.0264 |
| 10059 | DNM1L | CCI_2 | Human | Cervix | CC | 2.16e-02 | 6.17e-01 | 0.5249 |
| 10059 | DNM1L | CCI_3 | Human | Cervix | CC | 6.23e-05 | 7.86e-01 | 0.516 |
| 10059 | DNM1L | LZE2T | Human | Esophagus | ESCC | 4.39e-02 | 3.67e-01 | 0.082 |
| 10059 | DNM1L | LZE4T | Human | Esophagus | ESCC | 2.18e-09 | 2.41e-01 | 0.0811 |
| 10059 | DNM1L | LZE5T | Human | Esophagus | ESCC | 7.89e-03 | 1.60e-01 | 0.0514 |
| 10059 | DNM1L | LZE7T | Human | Esophagus | ESCC | 4.81e-09 | 4.71e-01 | 0.0667 |
| 10059 | DNM1L | LZE8T | Human | Esophagus | ESCC | 1.09e-07 | 3.32e-01 | 0.067 |
| 10059 | DNM1L | LZE20T | Human | Esophagus | ESCC | 1.70e-08 | 1.94e-01 | 0.0662 |
| 10059 | DNM1L | LZE24T | Human | Esophagus | ESCC | 3.13e-11 | 3.53e-01 | 0.0596 |
| 10059 | DNM1L | LZE21T | Human | Esophagus | ESCC | 2.13e-02 | 1.52e-01 | 0.0655 |
| 10059 | DNM1L | LZE6T | Human | Esophagus | ESCC | 2.89e-03 | 1.03e-01 | 0.0845 |
| 10059 | DNM1L | P1T-E | Human | Esophagus | ESCC | 1.78e-12 | 5.08e-01 | 0.0875 |
| 10059 | DNM1L | P2T-E | Human | Esophagus | ESCC | 1.79e-56 | 8.99e-01 | 0.1177 |
| 10059 | DNM1L | P4T-E | Human | Esophagus | ESCC | 7.41e-27 | 6.16e-01 | 0.1323 |
| 10059 | DNM1L | P5T-E | Human | Esophagus | ESCC | 4.19e-36 | 7.01e-01 | 0.1327 |
| 10059 | DNM1L | P8T-E | Human | Esophagus | ESCC | 1.46e-36 | 6.28e-01 | 0.0889 |
| 10059 | DNM1L | P9T-E | Human | Esophagus | ESCC | 1.19e-07 | 1.96e-01 | 0.1131 |
| 10059 | DNM1L | P10T-E | Human | Esophagus | ESCC | 2.94e-27 | 4.60e-01 | 0.116 |
| 10059 | DNM1L | P11T-E | Human | Esophagus | ESCC | 2.24e-18 | 6.30e-01 | 0.1426 |
| Page: 1 2 3 4 5 6 7 |
| Tissue | Expression Dynamics | Abbreviation |
| Cervix | 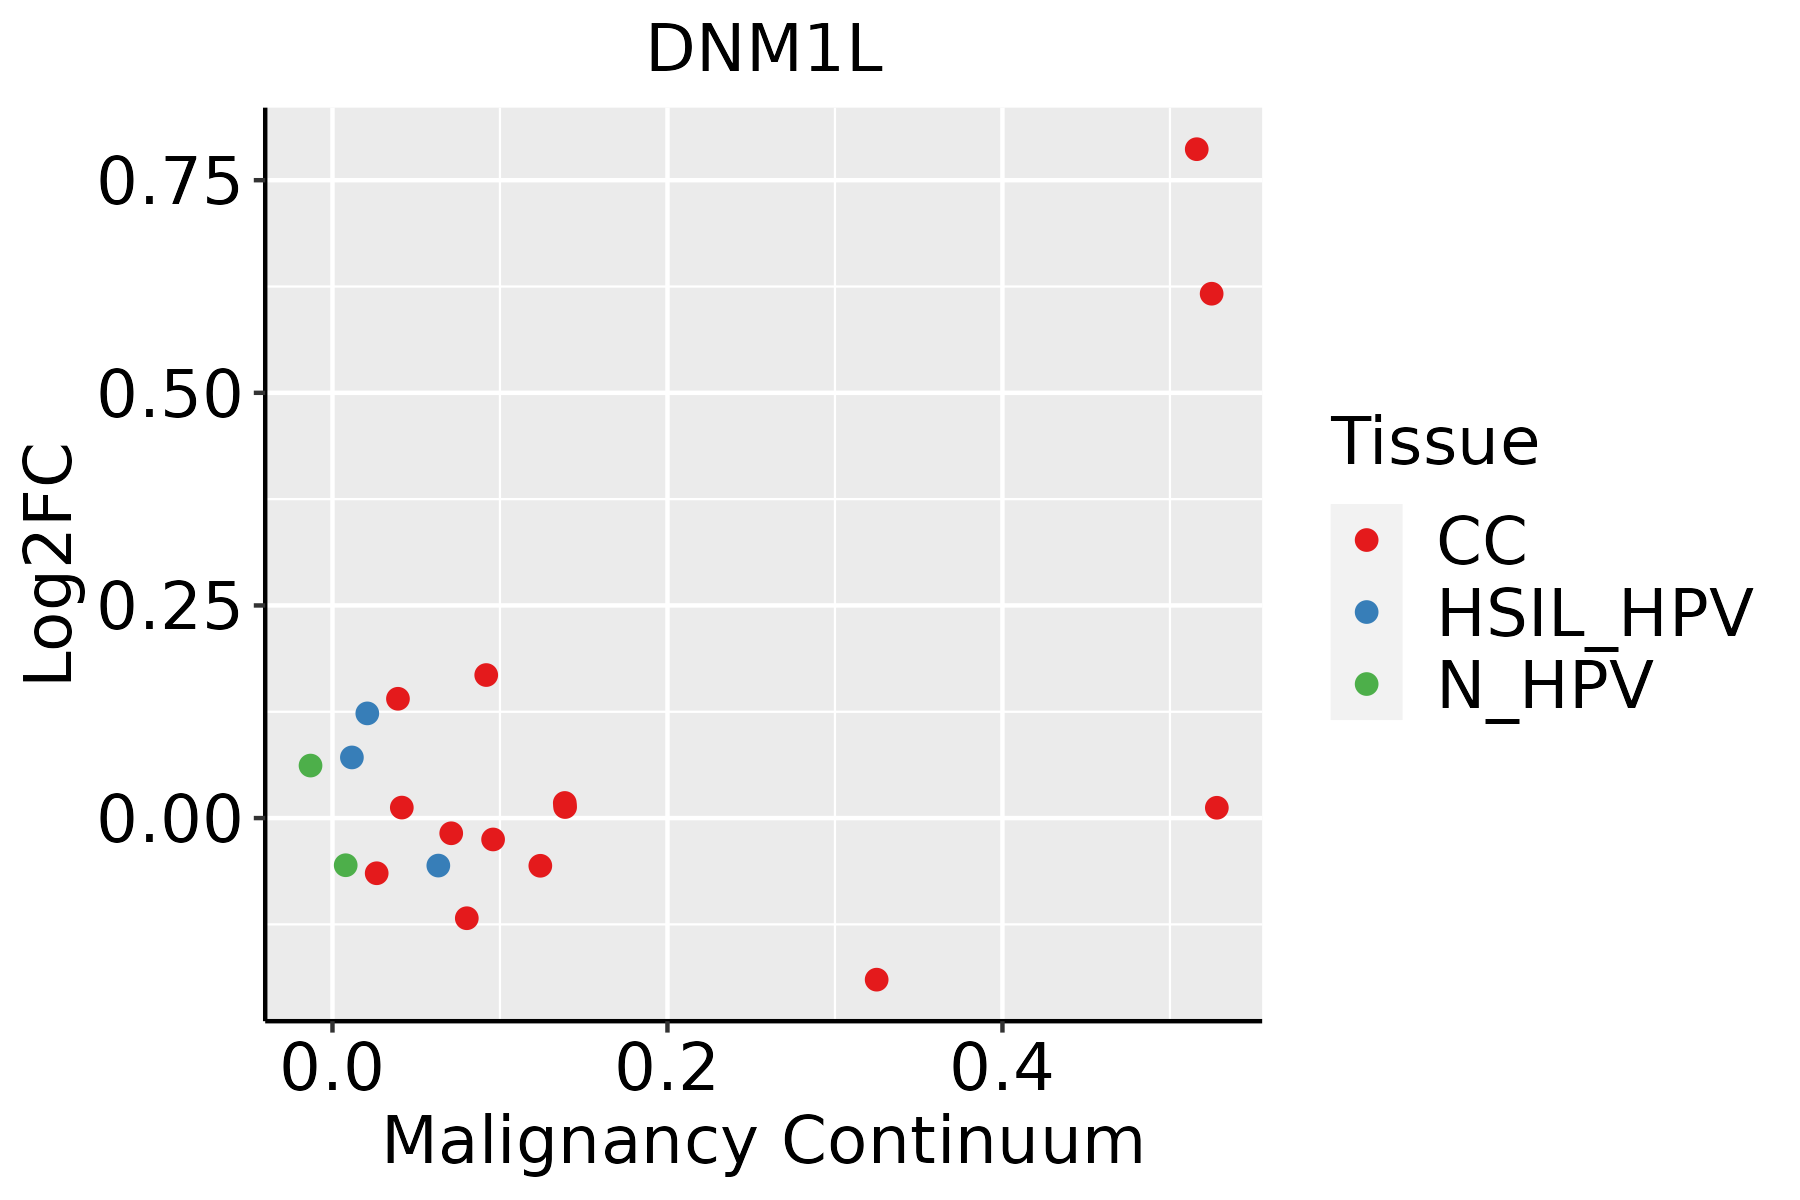 | CC: Cervix cancer |
| HSIL_HPV: HPV-infected high-grade squamous intraepithelial lesions | ||
| N_HPV: HPV-infected normal cervix | ||
| Esophagus | 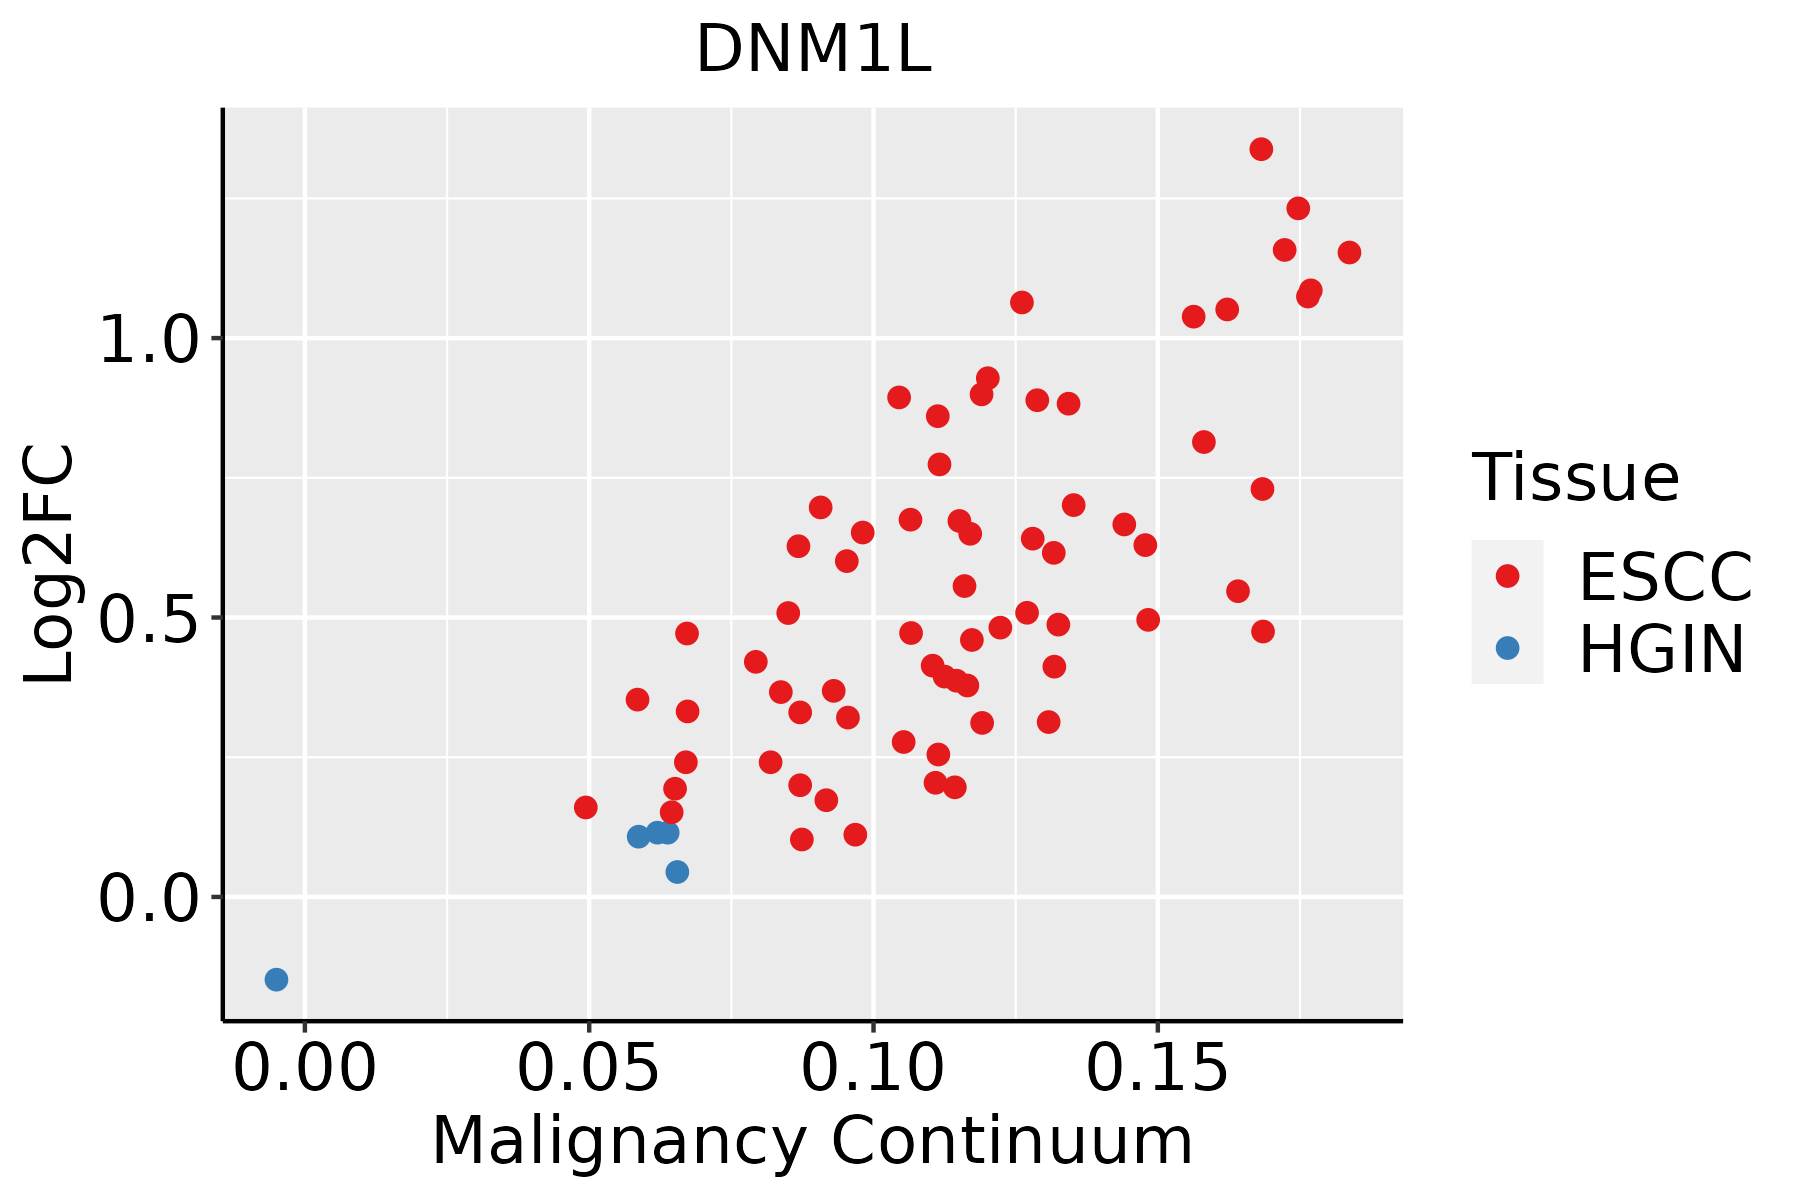 | ESCC: Esophageal squamous cell carcinoma |
| HGIN: High-grade intraepithelial neoplasias | ||
| LGIN: Low-grade intraepithelial neoplasias | ||
| Liver | 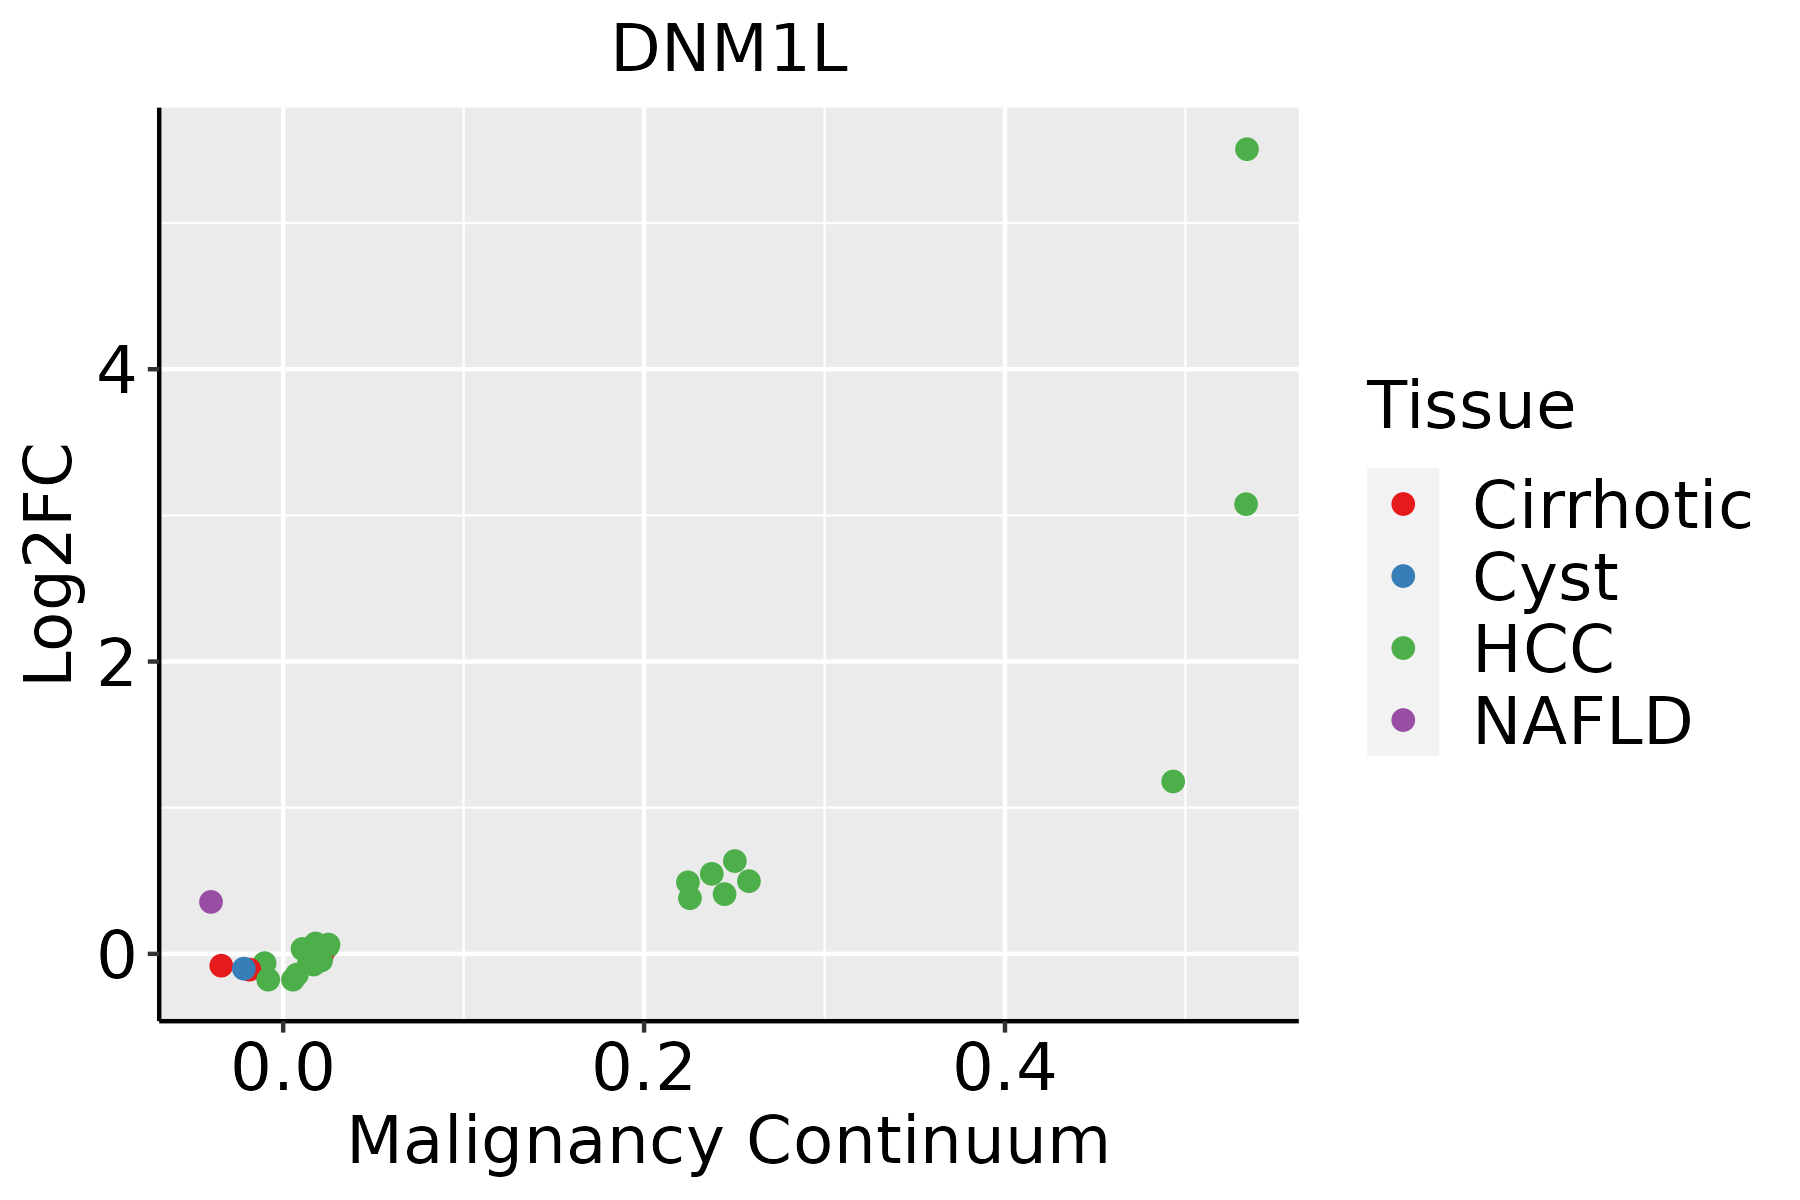 | HCC: Hepatocellular carcinoma |
| NAFLD: Non-alcoholic fatty liver disease | ||
| Oral Cavity | 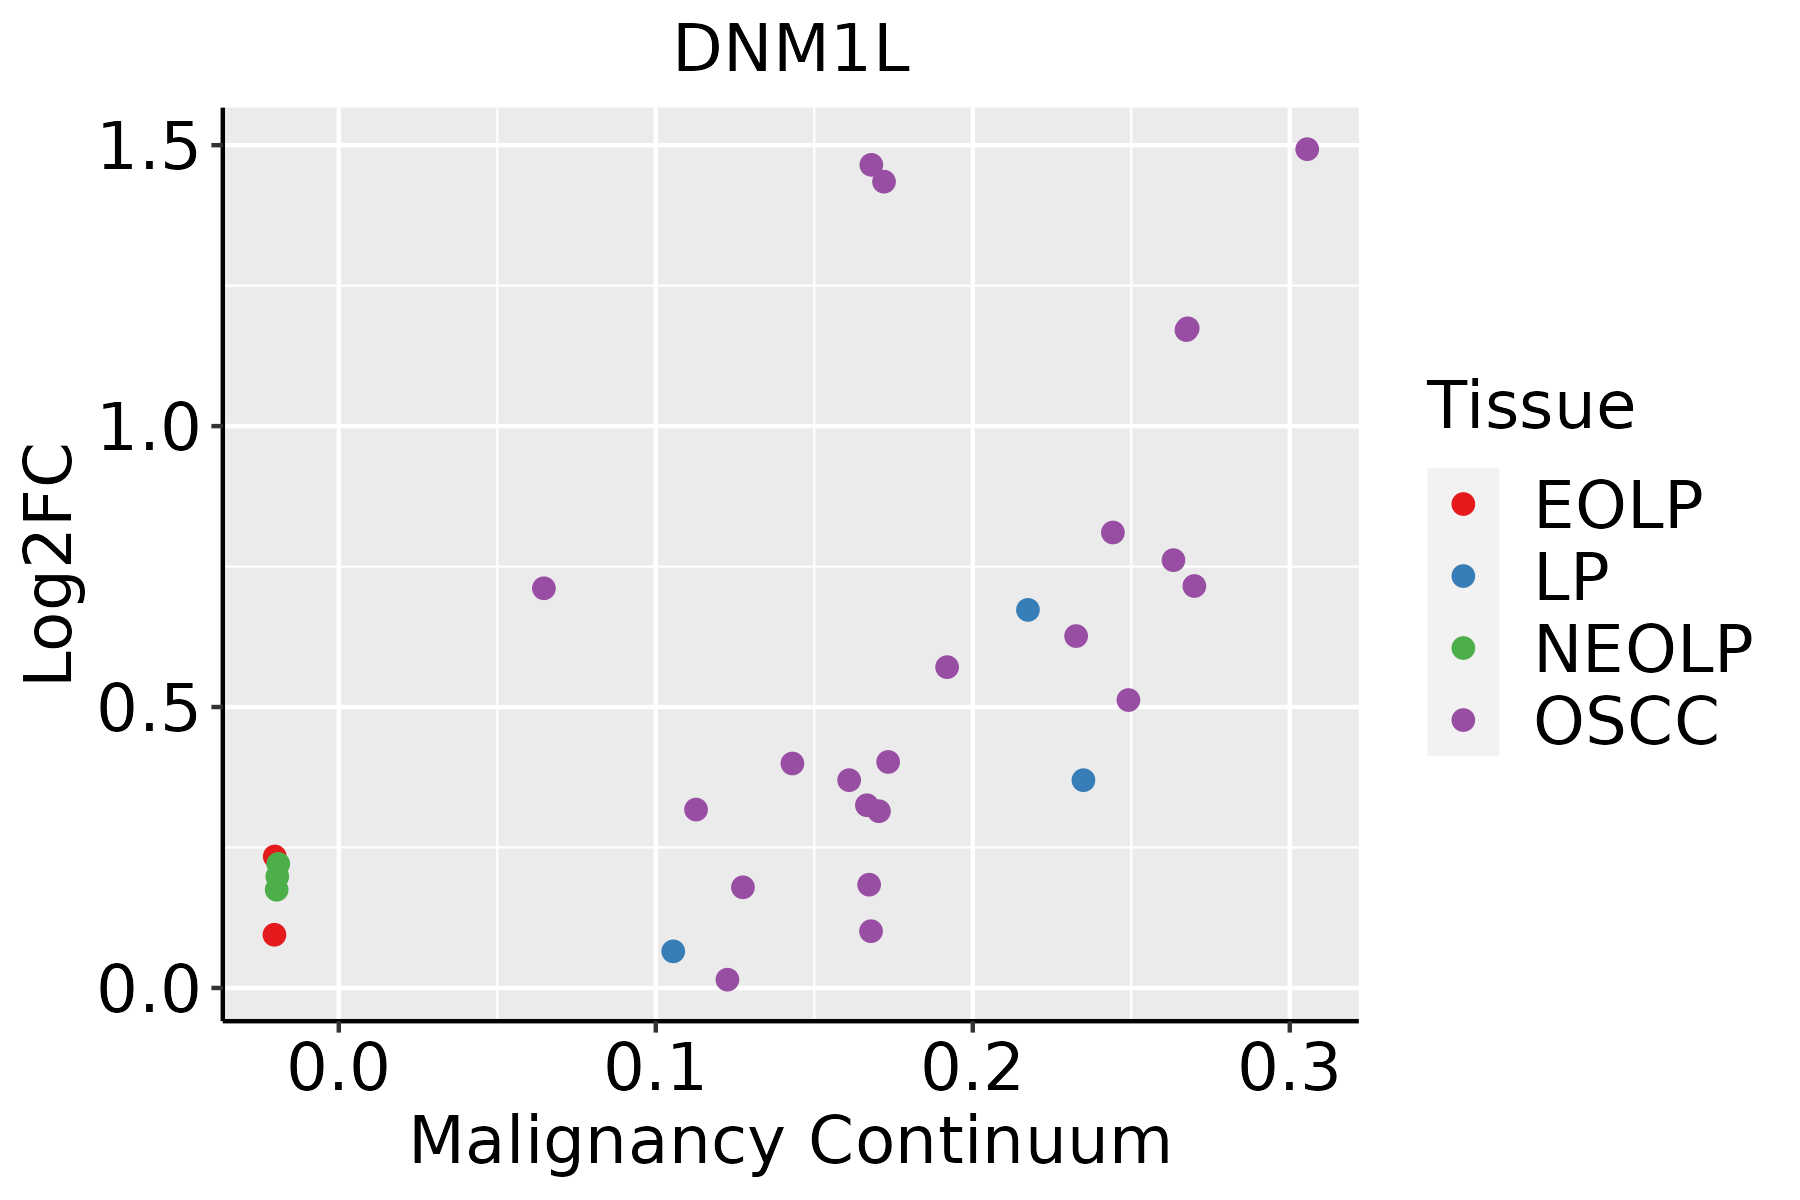 | EOLP: Erosive Oral lichen planus |
| LP: leukoplakia | ||
| NEOLP: Non-erosive oral lichen planus | ||
| OSCC: Oral squamous cell carcinoma | ||
| Skin | 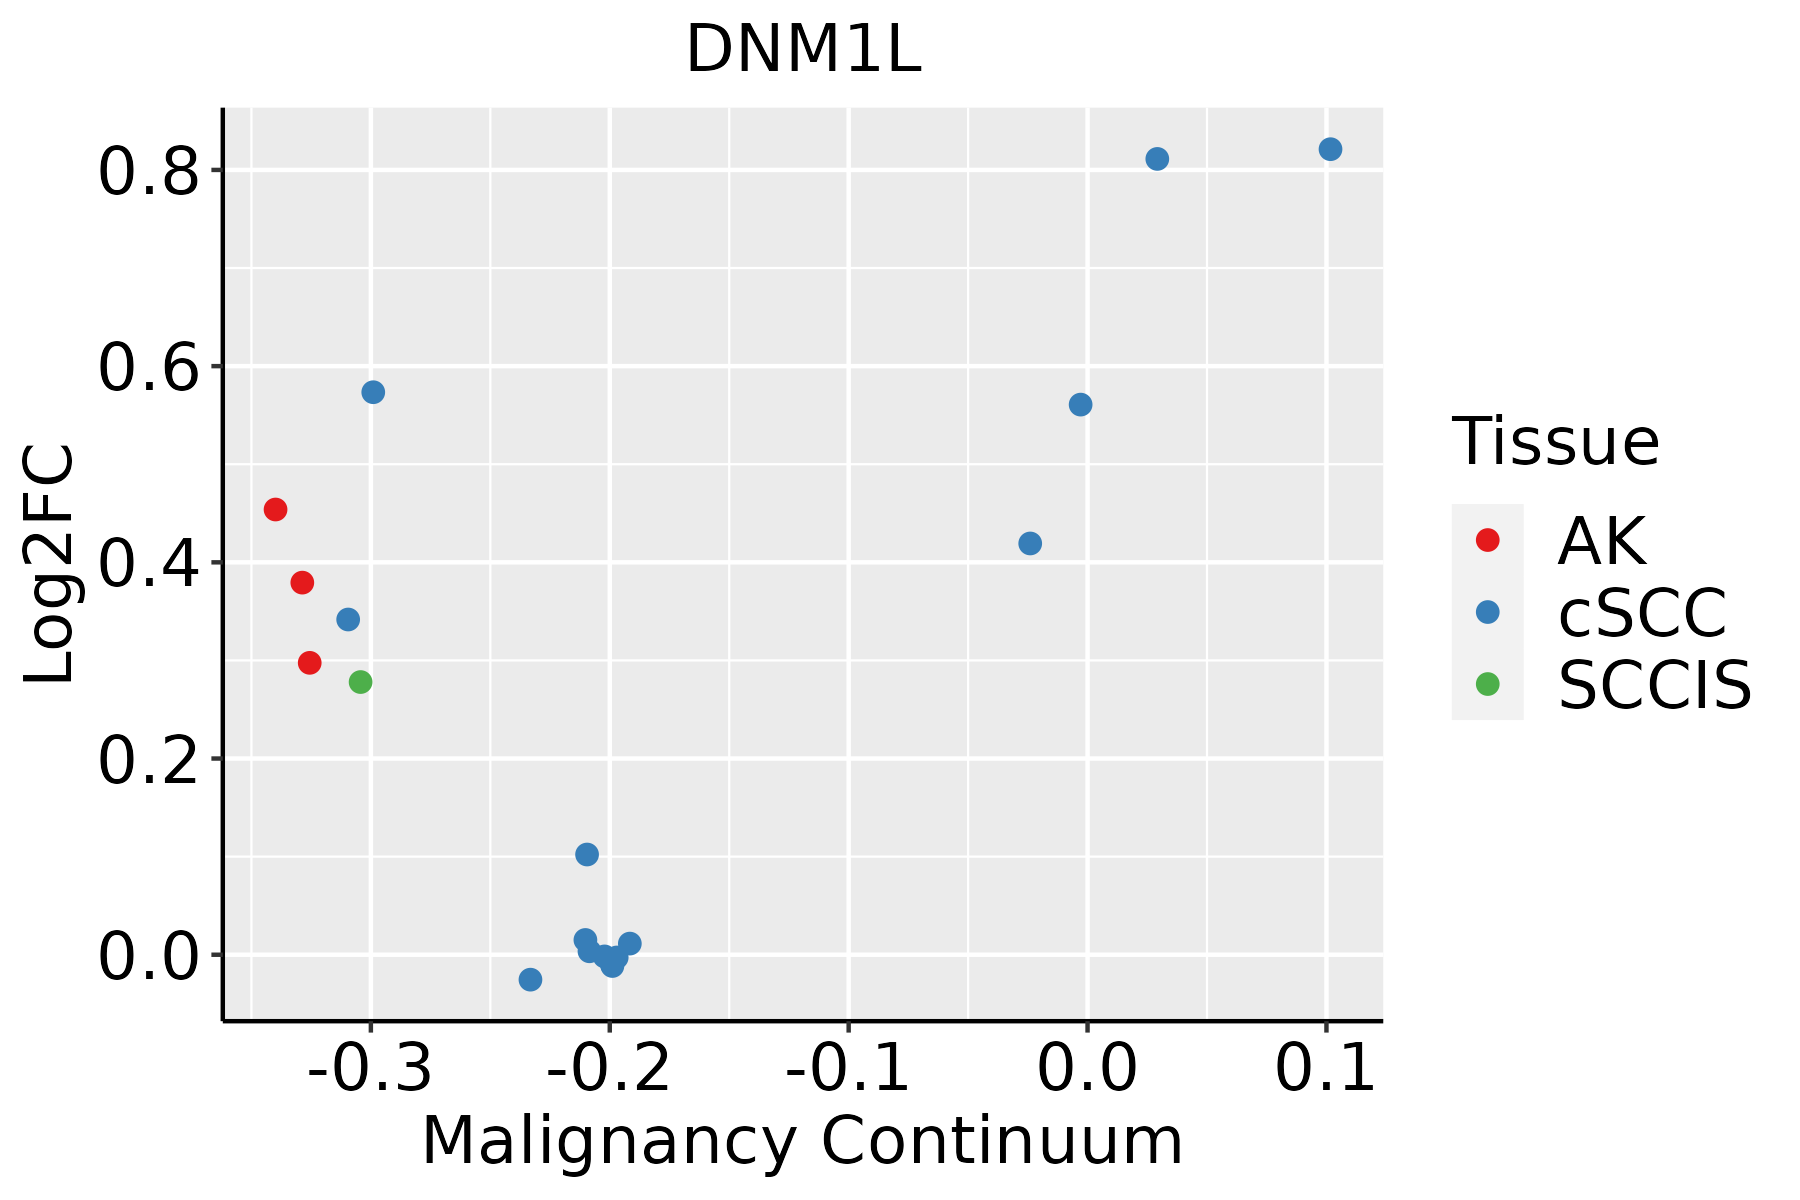 | AK: Actinic keratosis |
| cSCC: Cutaneous squamous cell carcinoma | ||
| SCCIS:squamous cell carcinoma in situ | ||
| Thyroid | 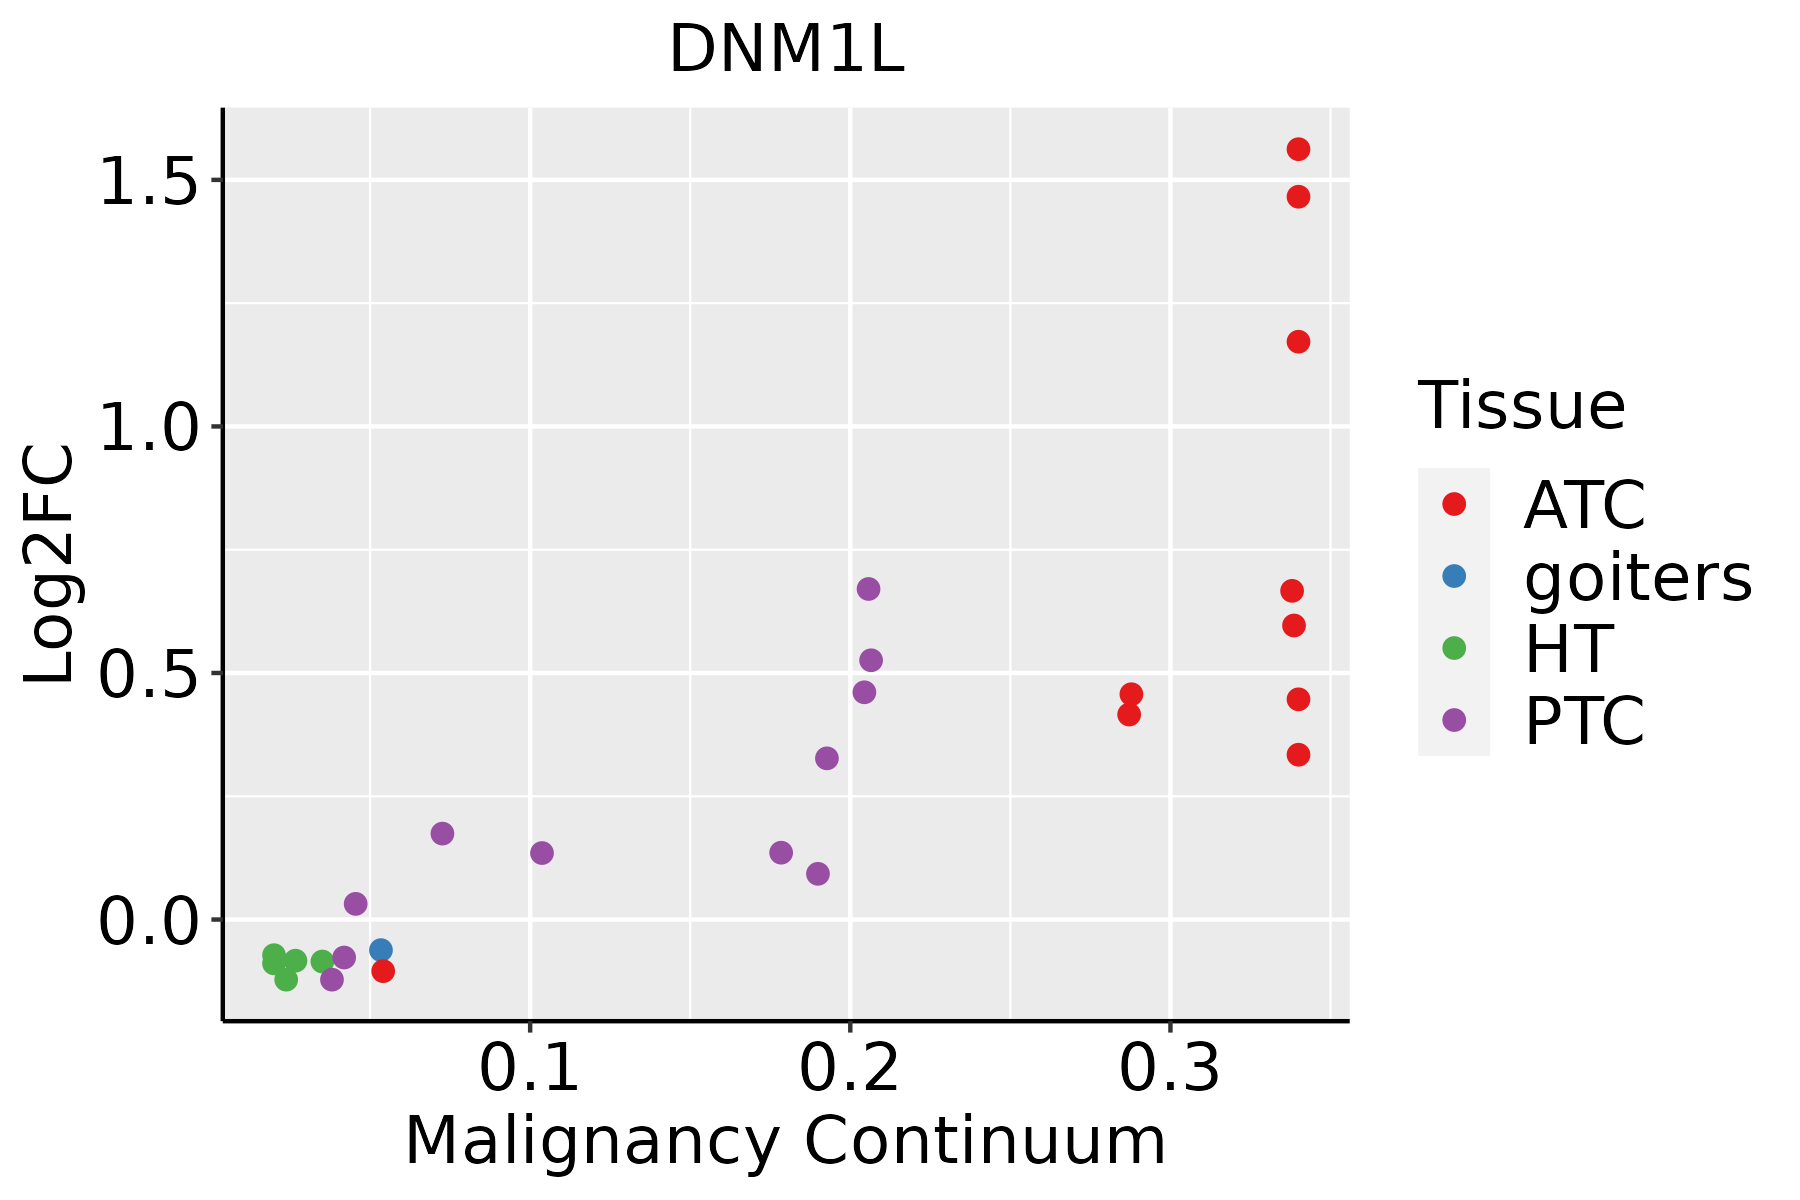 | ATC: Anaplastic thyroid cancer |
| HT: Hashimoto's thyroiditis | ||
| PTC: Papillary thyroid cancer |
| ∗log2FC in expression of this searched gene in stem-like cells from each diseased tissue sample relative to stem-like cells in normal samples in each tissue plotted against the malignancy continuum. Samples are colored based on if they are from different disease stage. |
Top |
Malignant transformation related pathway analysis |
| Find out the enriched GO biological processes and KEGG pathways involved in transition from healthy to precancer to cancer |
| Tissue | Disease Stage | Enriched GO biological Processes |
| Colorectum | AD |  |
| Colorectum | SER |  |
| Colorectum | MSS |  |
| Colorectum | MSI-H |  |
| Colorectum | FAP |  |
| ∗Top 15 enriched GO BP terms are showed in the bar plot of each disease state in each tissue. Each row represents a significant GO biological process which is colored according to the -log10(p.adjust). |
| Page: 1 2 3 4 5 6 7 8 9 |
| GO ID | Tissue | Disease Stage | Description | Gene Ratio | Bg Ratio | pvalue | p.adjust | Count |
| GO:004603410 | Cervix | CC | ATP metabolic process | 90/2311 | 277/18723 | 7.90e-19 | 2.36e-15 | 90 |
| GO:009719310 | Cervix | CC | intrinsic apoptotic signaling pathway | 85/2311 | 288/18723 | 4.56e-15 | 6.46e-12 | 85 |
| GO:200123310 | Cervix | CC | regulation of apoptotic signaling pathway | 96/2311 | 356/18723 | 4.08e-14 | 3.05e-11 | 96 |
| GO:002260410 | Cervix | CC | regulation of cell morphogenesis | 84/2311 | 309/18723 | 1.00e-12 | 4.29e-10 | 84 |
| GO:200124210 | Cervix | CC | regulation of intrinsic apoptotic signaling pathway | 52/2311 | 164/18723 | 5.06e-11 | 1.01e-08 | 52 |
| GO:007149610 | Cervix | CC | cellular response to external stimulus | 78/2311 | 320/18723 | 1.82e-09 | 1.98e-07 | 78 |
| GO:00321035 | Cervix | CC | positive regulation of response to external stimulus | 95/2311 | 427/18723 | 5.44e-09 | 5.03e-07 | 95 |
| GO:005122210 | Cervix | CC | positive regulation of protein transport | 72/2311 | 303/18723 | 2.36e-08 | 1.70e-06 | 72 |
| GO:00603267 | Cervix | CC | cell chemotaxis | 73/2311 | 310/18723 | 2.82e-08 | 1.96e-06 | 73 |
| GO:005125810 | Cervix | CC | protein polymerization | 70/2311 | 297/18723 | 5.20e-08 | 3.11e-06 | 70 |
| GO:00975298 | Cervix | CC | myeloid leukocyte migration | 56/2311 | 220/18723 | 7.21e-08 | 4.15e-06 | 56 |
| GO:190495110 | Cervix | CC | positive regulation of establishment of protein localization | 73/2311 | 319/18723 | 9.69e-08 | 5.25e-06 | 73 |
| GO:00305957 | Cervix | CC | leukocyte chemotaxis | 57/2311 | 230/18723 | 1.48e-07 | 7.07e-06 | 57 |
| GO:00716218 | Cervix | CC | granulocyte chemotaxis | 37/2311 | 125/18723 | 2.16e-07 | 9.56e-06 | 37 |
| GO:00107699 | Cervix | CC | regulation of cell morphogenesis involved in differentiation | 31/2311 | 96/18723 | 2.43e-07 | 1.05e-05 | 31 |
| GO:20012357 | Cervix | CC | positive regulation of apoptotic signaling pathway | 37/2311 | 126/18723 | 2.70e-07 | 1.12e-05 | 37 |
| GO:00316689 | Cervix | CC | cellular response to extracellular stimulus | 59/2311 | 246/18723 | 3.03e-07 | 1.24e-05 | 59 |
| GO:00163587 | Cervix | CC | dendrite development | 58/2311 | 243/18723 | 4.52e-07 | 1.76e-05 | 58 |
| GO:00509007 | Cervix | CC | leukocyte migration | 78/2311 | 369/18723 | 1.09e-06 | 3.80e-05 | 78 |
| GO:00975308 | Cervix | CC | granulocyte migration | 39/2311 | 148/18723 | 2.67e-06 | 7.87e-05 | 39 |
| Page: 1 2 3 4 5 6 7 8 9 10 11 12 13 14 15 16 17 18 19 20 21 22 23 24 25 26 27 28 29 30 31 32 33 34 35 36 37 38 39 40 |
| Pathway ID | Tissue | Disease Stage | Description | Gene Ratio | Bg Ratio | pvalue | p.adjust | qvalue | Count |
| hsa046686 | Cervix | CC | TNF signaling pathway | 28/1267 | 114/8465 | 4.60e-03 | 1.62e-02 | 9.59e-03 | 28 |
| hsa046213 | Cervix | CC | NOD-like receptor signaling pathway | 41/1267 | 186/8465 | 5.90e-03 | 1.95e-02 | 1.15e-02 | 41 |
| hsa0466813 | Cervix | CC | TNF signaling pathway | 28/1267 | 114/8465 | 4.60e-03 | 1.62e-02 | 9.59e-03 | 28 |
| hsa0462112 | Cervix | CC | NOD-like receptor signaling pathway | 41/1267 | 186/8465 | 5.90e-03 | 1.95e-02 | 1.15e-02 | 41 |
| hsa0466810 | Esophagus | ESCC | TNF signaling pathway | 89/4205 | 114/8465 | 3.36e-10 | 4.01e-09 | 2.06e-09 | 89 |
| hsa0462122 | Esophagus | ESCC | NOD-like receptor signaling pathway | 116/4205 | 186/8465 | 2.90e-04 | 1.03e-03 | 5.30e-04 | 116 |
| hsa0466817 | Esophagus | ESCC | TNF signaling pathway | 89/4205 | 114/8465 | 3.36e-10 | 4.01e-09 | 2.06e-09 | 89 |
| hsa0462132 | Esophagus | ESCC | NOD-like receptor signaling pathway | 116/4205 | 186/8465 | 2.90e-04 | 1.03e-03 | 5.30e-04 | 116 |
| hsa046684 | Liver | HCC | TNF signaling pathway | 73/4020 | 114/8465 | 2.53e-04 | 1.19e-03 | 6.63e-04 | 73 |
| hsa0466811 | Liver | HCC | TNF signaling pathway | 73/4020 | 114/8465 | 2.53e-04 | 1.19e-03 | 6.63e-04 | 73 |
| hsa046689 | Oral cavity | OSCC | TNF signaling pathway | 82/3704 | 114/8465 | 8.30e-10 | 9.59e-09 | 4.88e-09 | 82 |
| hsa046218 | Oral cavity | OSCC | NOD-like receptor signaling pathway | 108/3704 | 186/8465 | 5.13e-05 | 2.07e-04 | 1.05e-04 | 108 |
| hsa0466816 | Oral cavity | OSCC | TNF signaling pathway | 82/3704 | 114/8465 | 8.30e-10 | 9.59e-09 | 4.88e-09 | 82 |
| hsa0462113 | Oral cavity | OSCC | NOD-like receptor signaling pathway | 108/3704 | 186/8465 | 5.13e-05 | 2.07e-04 | 1.05e-04 | 108 |
| hsa0466841 | Oral cavity | EOLP | TNF signaling pathway | 35/1218 | 114/8465 | 5.79e-06 | 3.67e-05 | 2.16e-05 | 35 |
| hsa046214 | Oral cavity | EOLP | NOD-like receptor signaling pathway | 48/1218 | 186/8465 | 2.51e-05 | 1.31e-04 | 7.70e-05 | 48 |
| hsa0421722 | Oral cavity | EOLP | Necroptosis | 37/1218 | 159/8465 | 1.70e-03 | 5.83e-03 | 3.44e-03 | 37 |
| hsa0466851 | Oral cavity | EOLP | TNF signaling pathway | 35/1218 | 114/8465 | 5.79e-06 | 3.67e-05 | 2.16e-05 | 35 |
| hsa046215 | Oral cavity | EOLP | NOD-like receptor signaling pathway | 48/1218 | 186/8465 | 2.51e-05 | 1.31e-04 | 7.70e-05 | 48 |
| hsa0421732 | Oral cavity | EOLP | Necroptosis | 37/1218 | 159/8465 | 1.70e-03 | 5.83e-03 | 3.44e-03 | 37 |
| Page: 1 |
Top |
Cell-cell communication analysis |
| Identification of potential cell-cell interactions between two cell types and their ligand-receptor pairs for different disease states |
| Ligand | Receptor | LRpair | Pathway | Tissue | Disease Stage |
| Page: 1 |
Top |
Single-cell gene regulatory network inference analysis |
| Find out the significant the regulons (TFs) and the target genes of each regulon across cell types for different disease states |
| TF | Cell Type | Tissue | Disease Stage | Target Gene | RSS | Regulon Activity |
| ∗The dot plots of a searched regulon are shown for all cell subpopulations in each disease state of each tissue based on the regulon specific score inferred using pySCENIC and by calculating the average expression. |
| Page: 1 |
Top |
Somatic mutation of malignant transformation related genes |
| Annotation of somatic variants for genes involved in malignant transformation |
| Hugo Symbol | Variant Class | Variant Classification | dbSNP RS | HGVSc | HGVSp | HGVSp Short | SWISSPROT | BIOTYPE | SIFT | PolyPhen | Tumor Sample Barcode | Tissue | Histology | Sex | Age | Stage | Therapy Types | Drugs | Outcome |
| DNM1L | SNV | Missense_Mutation | novel | c.1863A>C | p.Lys621Asn | p.K621N | O00429 | protein_coding | tolerated(0.47) | benign(0.006) | TCGA-B6-A1KC-01 | Breast | breast invasive carcinoma | Female | >=65 | I/II | Unknown | Unknown | SD |
| DNM1L | SNV | Missense_Mutation | c.1637N>T | p.Ser546Phe | p.S546F | O00429 | protein_coding | deleterious(0.04) | benign(0.001) | TCGA-DR-A0ZM-01 | Cervix | cervical & endocervical cancer | Female | <65 | III/IV | Unspecific | Cisplatin | SD | |
| DNM1L | SNV | Missense_Mutation | rs747468677 | c.1456C>T | p.Arg486Cys | p.R486C | O00429 | protein_coding | deleterious(0.02) | probably_damaging(0.988) | TCGA-VS-A953-01 | Cervix | cervical & endocervical cancer | Female | <65 | I/II | Unknown | Unknown | PD |
| DNM1L | SNV | Missense_Mutation | rs754202457 | c.704C>T | p.Ala235Val | p.A235V | O00429 | protein_coding | tolerated(0.11) | benign(0.077) | TCGA-A6-3810-01 | Colorectum | colon adenocarcinoma | Male | <65 | I/II | Unknown | Unknown | SD |
| DNM1L | SNV | Missense_Mutation | c.323N>G | p.His108Arg | p.H108R | O00429 | protein_coding | deleterious(0) | probably_damaging(1) | TCGA-AA-3875-01 | Colorectum | colon adenocarcinoma | Female | >=65 | I/II | Unknown | Unknown | SD | |
| DNM1L | SNV | Missense_Mutation | novel | c.1728N>G | p.Ser576Arg | p.S576R | O00429 | protein_coding | tolerated(0.28) | benign(0.051) | TCGA-AA-3877-01 | Colorectum | colon adenocarcinoma | Female | >=65 | I/II | Unknown | Unknown | SD |
| DNM1L | SNV | Missense_Mutation | novel | c.1166N>A | p.Arg389Gln | p.R389Q | O00429 | protein_coding | tolerated(0.2) | possibly_damaging(0.476) | TCGA-AA-3950-01 | Colorectum | colon adenocarcinoma | Female | >=65 | I/II | Unknown | Unknown | SD |
| DNM1L | SNV | Missense_Mutation | c.1904N>T | p.Ala635Val | p.A635V | O00429 | protein_coding | tolerated(0.17) | benign(0.046) | TCGA-AA-A010-01 | Colorectum | colon adenocarcinoma | Female | <65 | I/II | Chemotherapy | folinic | CR | |
| DNM1L | SNV | Missense_Mutation | rs751127554 | c.586N>A | p.Ala196Thr | p.A196T | O00429 | protein_coding | deleterious(0) | probably_damaging(0.991) | TCGA-AG-3892-01 | Colorectum | rectum adenocarcinoma | Female | <65 | I/II | Unknown | Unknown | SD |
| DNM1L | SNV | Missense_Mutation | novel | c.389N>T | p.Arg130Ile | p.R130I | O00429 | protein_coding | deleterious(0) | probably_damaging(0.958) | TCGA-A5-A0G1-01 | Endometrium | uterine corpus endometrioid carcinoma | Female | >=65 | I/II | Unknown | Unknown | SD |
| Page: 1 2 3 4 5 6 |
Top |
Related drugs of malignant transformation related genes |
| Identification of chemicals and drugs interact with genes involved in malignant transfromation |
| (DGIdb 4.0) |
| Entrez ID | Symbol | Category | Interaction Types | Drug Claim Name | Drug Name | PMIDs |
| Page: 1 |

Copyright 2023-Present -The University of Texas Health Science Center at Houston |