
|
|||||
|
 | |
| |
| |
| |
| |
| |
|
Gene: DNLZ |
Gene summary for DNLZ |
| Gene information | Species | Human | Gene symbol | DNLZ | Gene ID | 728489 |
| Gene name | DNL-type zinc finger | |
| Gene Alias | C9orf151 | |
| Cytomap | 9q34.3 | |
| Gene Type | protein-coding | GO ID | GO:0006457 | UniProtAcc | Q5SXM8 |
Top |
Malignant transformation analysis |
| Identification of the aberrant gene expression in precancerous and cancerous lesions by comparing the gene expression of stem-like cells in diseased tissues with normal stem cells |
| Entrez ID | Symbol | Replicates | Species | Organ | Tissue | Adj P-value | Log2FC | Malignancy |
| 728489 | DNLZ | P2T-E | Human | Esophagus | ESCC | 1.88e-04 | 1.11e-01 | 0.1177 |
| 728489 | DNLZ | P4T-E | Human | Esophagus | ESCC | 2.45e-12 | 2.98e-01 | 0.1323 |
| 728489 | DNLZ | P5T-E | Human | Esophagus | ESCC | 4.40e-09 | 1.97e-01 | 0.1327 |
| 728489 | DNLZ | P8T-E | Human | Esophagus | ESCC | 1.66e-02 | 9.46e-02 | 0.0889 |
| 728489 | DNLZ | P9T-E | Human | Esophagus | ESCC | 4.01e-04 | 1.29e-01 | 0.1131 |
| 728489 | DNLZ | P10T-E | Human | Esophagus | ESCC | 2.02e-06 | 1.35e-01 | 0.116 |
| 728489 | DNLZ | P11T-E | Human | Esophagus | ESCC | 3.25e-05 | 2.08e-01 | 0.1426 |
| 728489 | DNLZ | P15T-E | Human | Esophagus | ESCC | 3.38e-04 | 1.23e-01 | 0.1149 |
| 728489 | DNLZ | P20T-E | Human | Esophagus | ESCC | 3.11e-04 | 1.27e-01 | 0.1124 |
| 728489 | DNLZ | P21T-E | Human | Esophagus | ESCC | 3.60e-13 | 2.61e-01 | 0.1617 |
| 728489 | DNLZ | P22T-E | Human | Esophagus | ESCC | 5.79e-16 | 2.80e-01 | 0.1236 |
| 728489 | DNLZ | P24T-E | Human | Esophagus | ESCC | 4.17e-05 | 1.56e-01 | 0.1287 |
| 728489 | DNLZ | P28T-E | Human | Esophagus | ESCC | 3.90e-42 | 6.98e-01 | 0.1149 |
| 728489 | DNLZ | P30T-E | Human | Esophagus | ESCC | 9.20e-05 | 2.02e-01 | 0.137 |
| 728489 | DNLZ | P31T-E | Human | Esophagus | ESCC | 3.50e-02 | 9.19e-02 | 0.1251 |
| 728489 | DNLZ | P32T-E | Human | Esophagus | ESCC | 9.53e-09 | 1.85e-01 | 0.1666 |
| 728489 | DNLZ | P36T-E | Human | Esophagus | ESCC | 7.72e-03 | 1.69e-01 | 0.1187 |
| 728489 | DNLZ | P37T-E | Human | Esophagus | ESCC | 1.24e-04 | 1.29e-01 | 0.1371 |
| 728489 | DNLZ | P38T-E | Human | Esophagus | ESCC | 2.66e-02 | 1.60e-01 | 0.127 |
| 728489 | DNLZ | P40T-E | Human | Esophagus | ESCC | 5.68e-07 | 2.22e-01 | 0.109 |
| Page: 1 2 |
| Tissue | Expression Dynamics | Abbreviation |
| Esophagus | 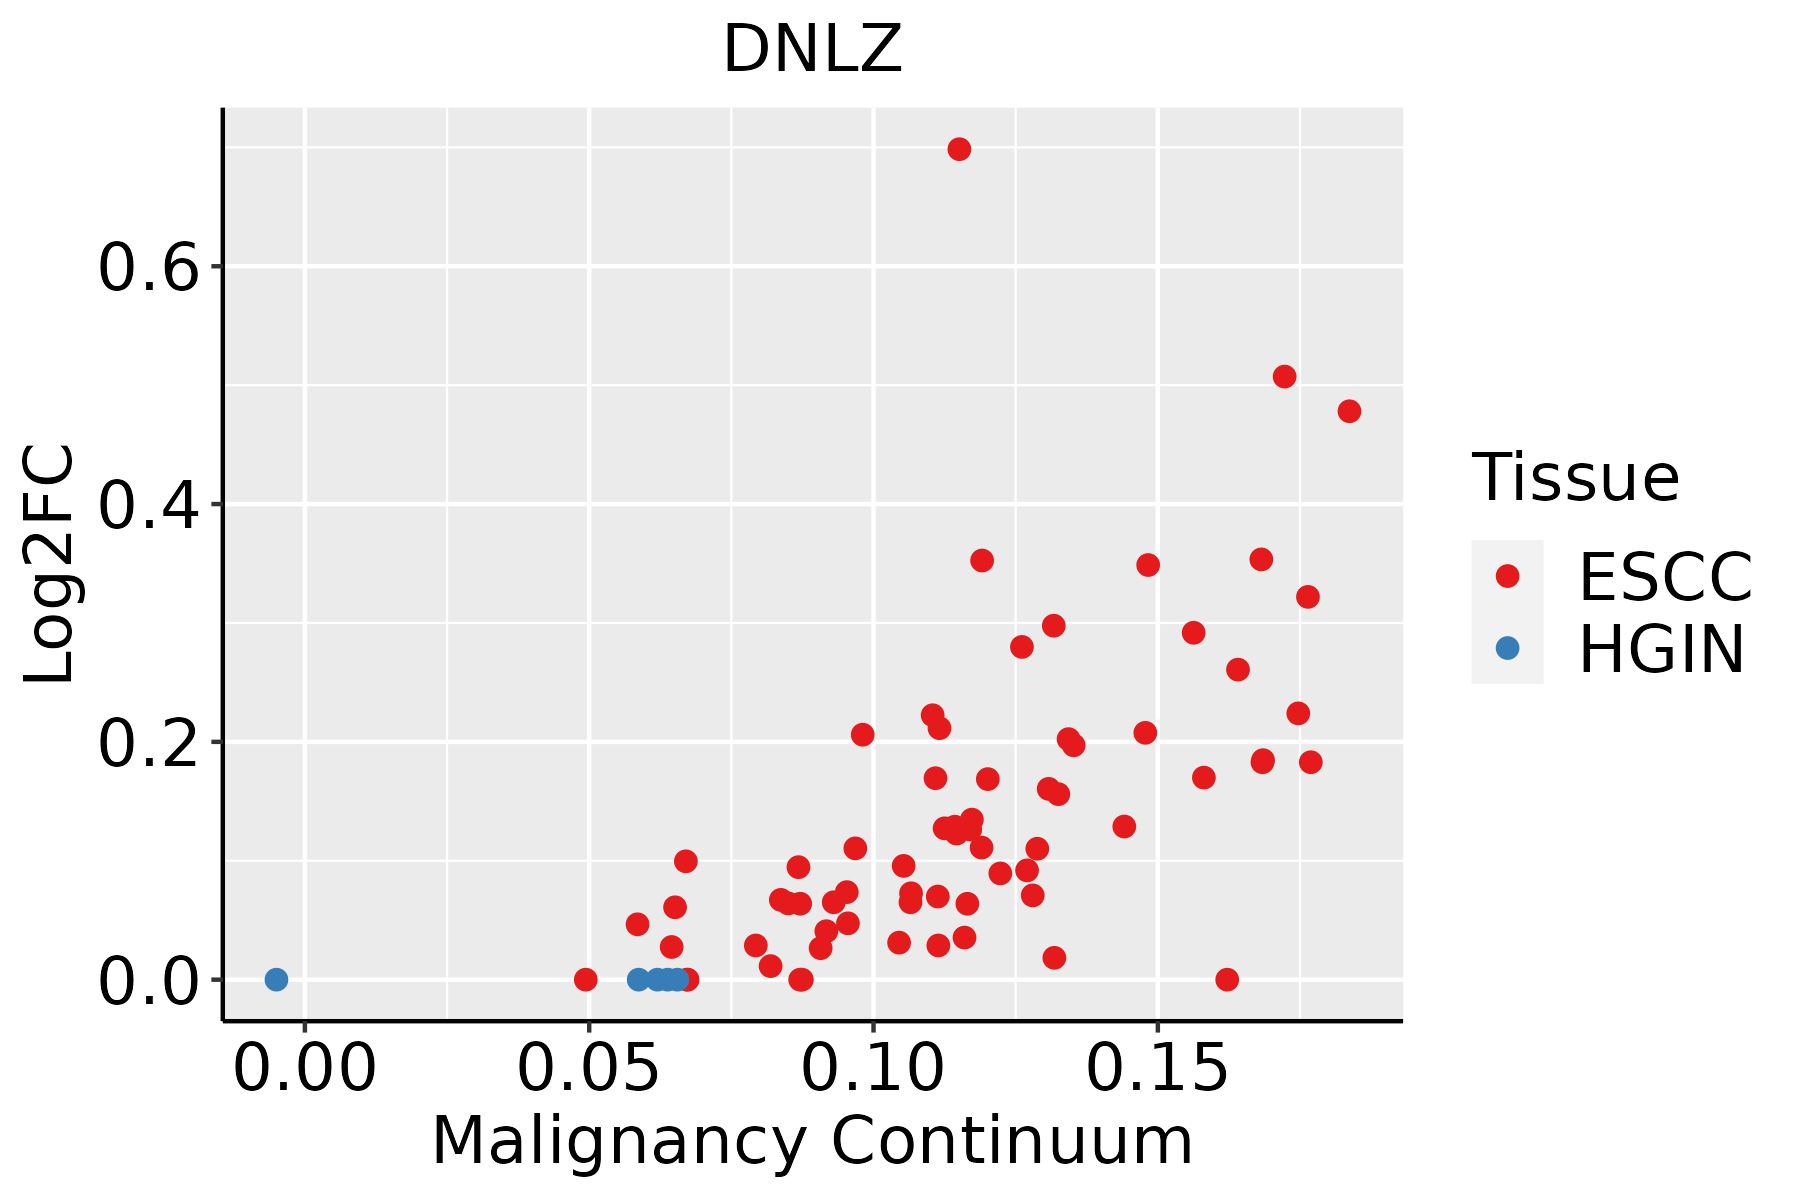 | ESCC: Esophageal squamous cell carcinoma |
| HGIN: High-grade intraepithelial neoplasias | ||
| LGIN: Low-grade intraepithelial neoplasias |
| ∗log2FC in expression of this searched gene in stem-like cells from each diseased tissue sample relative to stem-like cells in normal samples in each tissue plotted against the malignancy continuum. Samples are colored based on if they are from different disease stage. |
Top |
Malignant transformation related pathway analysis |
| Find out the enriched GO biological processes and KEGG pathways involved in transition from healthy to precancer to cancer |
| Tissue | Disease Stage | Enriched GO biological Processes |
| Colorectum | AD |  |
| Colorectum | SER |  |
| Colorectum | MSS |  |
| Colorectum | MSI-H |  |
| Colorectum | FAP |  |
| ∗Top 15 enriched GO BP terms are showed in the bar plot of each disease state in each tissue. Each row represents a significant GO biological process which is colored according to the -log10(p.adjust). |
| Page: 1 2 3 4 5 6 7 8 9 |
| GO ID | Tissue | Disease Stage | Description | Gene Ratio | Bg Ratio | pvalue | p.adjust | Count |
| GO:0072594110 | Esophagus | ESCC | establishment of protein localization to organelle | 311/8552 | 422/18723 | 3.02e-32 | 2.13e-29 | 311 |
| GO:0031647111 | Esophagus | ESCC | regulation of protein stability | 223/8552 | 298/18723 | 5.76e-25 | 1.52e-22 | 223 |
| GO:0006605111 | Esophagus | ESCC | protein targeting | 229/8552 | 314/18723 | 4.93e-23 | 1.01e-20 | 229 |
| GO:0006457110 | Esophagus | ESCC | protein folding | 163/8552 | 212/18723 | 1.13e-20 | 1.74e-18 | 163 |
| GO:0006839110 | Esophagus | ESCC | mitochondrial transport | 187/8552 | 254/18723 | 8.35e-20 | 9.81e-18 | 187 |
| GO:0072655110 | Esophagus | ESCC | establishment of protein localization to mitochondrion | 97/8552 | 120/18723 | 2.17e-15 | 1.33e-13 | 97 |
| GO:0070585110 | Esophagus | ESCC | protein localization to mitochondrion | 100/8552 | 125/18723 | 2.96e-15 | 1.77e-13 | 100 |
| GO:001703818 | Esophagus | ESCC | protein import | 149/8552 | 206/18723 | 5.90e-15 | 3.31e-13 | 149 |
| GO:0050821111 | Esophagus | ESCC | protein stabilization | 140/8552 | 191/18723 | 6.50e-15 | 3.61e-13 | 140 |
| GO:0006626110 | Esophagus | ESCC | protein targeting to mitochondrion | 81/8552 | 100/18723 | 3.60e-13 | 1.67e-11 | 81 |
| GO:00718069 | Esophagus | ESCC | protein transmembrane transport | 47/8552 | 59/18723 | 9.02e-08 | 1.51e-06 | 47 |
| GO:1990542110 | Esophagus | ESCC | mitochondrial transmembrane transport | 72/8552 | 102/18723 | 2.94e-07 | 4.23e-06 | 72 |
| GO:00650026 | Esophagus | ESCC | intracellular protein transmembrane transport | 40/8552 | 51/18723 | 1.76e-06 | 2.08e-05 | 40 |
| GO:00447433 | Esophagus | ESCC | protein transmembrane import into intracellular organelle | 29/8552 | 36/18723 | 1.91e-05 | 1.67e-04 | 29 |
| GO:00301503 | Esophagus | ESCC | protein import into mitochondrial matrix | 16/8552 | 20/18723 | 1.85e-03 | 8.40e-03 | 16 |
| Page: 1 |
| Pathway ID | Tissue | Disease Stage | Description | Gene Ratio | Bg Ratio | pvalue | p.adjust | qvalue | Count |
| Page: 1 |
Top |
Cell-cell communication analysis |
| Identification of potential cell-cell interactions between two cell types and their ligand-receptor pairs for different disease states |
| Ligand | Receptor | LRpair | Pathway | Tissue | Disease Stage |
| Page: 1 |
Top |
Single-cell gene regulatory network inference analysis |
| Find out the significant the regulons (TFs) and the target genes of each regulon across cell types for different disease states |
| TF | Cell Type | Tissue | Disease Stage | Target Gene | RSS | Regulon Activity |
| ∗The dot plots of a searched regulon are shown for all cell subpopulations in each disease state of each tissue based on the regulon specific score inferred using pySCENIC and by calculating the average expression. |
| Page: 1 |
Top |
Somatic mutation of malignant transformation related genes |
| Annotation of somatic variants for genes involved in malignant transformation |
| Hugo Symbol | Variant Class | Variant Classification | dbSNP RS | HGVSc | HGVSp | HGVSp Short | SWISSPROT | BIOTYPE | SIFT | PolyPhen | Tumor Sample Barcode | Tissue | Histology | Sex | Age | Stage | Therapy Types | Drugs | Outcome |
| DNLZ | SNV | Missense_Mutation | rs530884865 | c.419C>T | p.Ala140Val | p.A140V | Q5SXM8 | protein_coding | tolerated(0.28) | benign(0) | TCGA-AD-5900-01 | Colorectum | colon adenocarcinoma | Male | >=65 | I/II | Unknown | Unknown | SD |
| DNLZ | SNV | Missense_Mutation | c.268N>A | p.Ala90Thr | p.A90T | Q5SXM8 | protein_coding | deleterious(0) | probably_damaging(0.987) | TCGA-AD-6964-01 | Colorectum | colon adenocarcinoma | Male | <65 | III/IV | Chemotherapy | folfox | PD | |
| DNLZ | SNV | Missense_Mutation | novel | c.239N>T | p.Thr80Ile | p.T80I | Q5SXM8 | protein_coding | deleterious(0.01) | possibly_damaging(0.821) | TCGA-AM-5820-01 | Colorectum | colon adenocarcinoma | Female | <65 | I/II | Unknown | Unknown | SD |
| DNLZ | SNV | Missense_Mutation | rs770091036 | c.482N>T | p.Pro161Leu | p.P161L | Q5SXM8 | protein_coding | tolerated(0.52) | benign(0.001) | TCGA-AZ-6601-01 | Colorectum | colon adenocarcinoma | Male | >=65 | I/II | Unknown | Unknown | PD |
| DNLZ | deletion | Frame_Shift_Del | c.510delN | p.Ser171AlafsTer? | p.S171Afs*? | Q5SXM8 | protein_coding | TCGA-AD-A5EJ-01 | Colorectum | colon adenocarcinoma | Female | >=65 | I/II | Unknown | Unknown | SD | |||
| DNLZ | SNV | Missense_Mutation | novel | c.362N>A | p.Gly121Glu | p.G121E | Q5SXM8 | protein_coding | deleterious(0) | possibly_damaging(0.896) | TCGA-A5-A2K7-01 | Endometrium | uterine corpus endometrioid carcinoma | Female | <65 | I/II | Chemotherapy | taxol | SD |
| DNLZ | SNV | Missense_Mutation | novel | c.232N>C | p.Cys78Arg | p.C78R | Q5SXM8 | protein_coding | deleterious(0) | probably_damaging(1) | TCGA-AP-A1DK-01 | Endometrium | uterine corpus endometrioid carcinoma | Female | <65 | I/II | Unknown | Unknown | SD |
| DNLZ | SNV | Missense_Mutation | rs770091036 | c.482N>T | p.Pro161Leu | p.P161L | Q5SXM8 | protein_coding | tolerated(0.52) | benign(0.001) | TCGA-90-A4ED-01 | Lung | lung squamous cell carcinoma | Male | >=65 | I/II | Unknown | Unknown | SD |
| DNLZ | SNV | Missense_Mutation | novel | c.481N>T | p.Pro161Ser | p.P161S | Q5SXM8 | protein_coding | tolerated(0.71) | benign(0.006) | TCGA-90-A4ED-01 | Lung | lung squamous cell carcinoma | Male | >=65 | I/II | Unknown | Unknown | SD |
| DNLZ | SNV | Missense_Mutation | rs548961606 | c.400N>A | p.Glu134Lys | p.E134K | Q5SXM8 | protein_coding | deleterious(0.02) | probably_damaging(0.913) | TCGA-BR-8372-01 | Stomach | stomach adenocarcinoma | Male | <65 | III/IV | Chemotherapy | etoposide | CR |
| Page: 1 2 |
Top |
Related drugs of malignant transformation related genes |
| Identification of chemicals and drugs interact with genes involved in malignant transfromation |
| (DGIdb 4.0) |
| Entrez ID | Symbol | Category | Interaction Types | Drug Claim Name | Drug Name | PMIDs |
| Page: 1 |

Copyright 2023-Present -The University of Texas Health Science Center at Houston |