
|
|||||
|
 | |
| |
| |
| |
| |
| |
|
Gene: DNER |
Gene summary for DNER |
| Gene information | Species | Human | Gene symbol | DNER | Gene ID | 92737 |
| Gene name | delta/notch like EGF repeat containing | |
| Gene Alias | UNQ26 | |
| Cytomap | 2q36.3 | |
| Gene Type | protein-coding | GO ID | GO:0001764 | UniProtAcc | Q8NFT8 |
Top |
Malignant transformation analysis |
| Identification of the aberrant gene expression in precancerous and cancerous lesions by comparing the gene expression of stem-like cells in diseased tissues with normal stem cells |
| Entrez ID | Symbol | Replicates | Species | Organ | Tissue | Adj P-value | Log2FC | Malignancy |
| 92737 | DNER | ATC09 | Human | Thyroid | ATC | 1.26e-19 | 5.56e-01 | 0.2871 |
| 92737 | DNER | ATC1 | Human | Thyroid | ATC | 4.87e-22 | 6.36e-01 | 0.2878 |
| 92737 | DNER | ATC3 | Human | Thyroid | ATC | 6.53e-05 | 2.93e-01 | 0.338 |
| Page: 1 |
| Tissue | Expression Dynamics | Abbreviation |
| Thyroid | 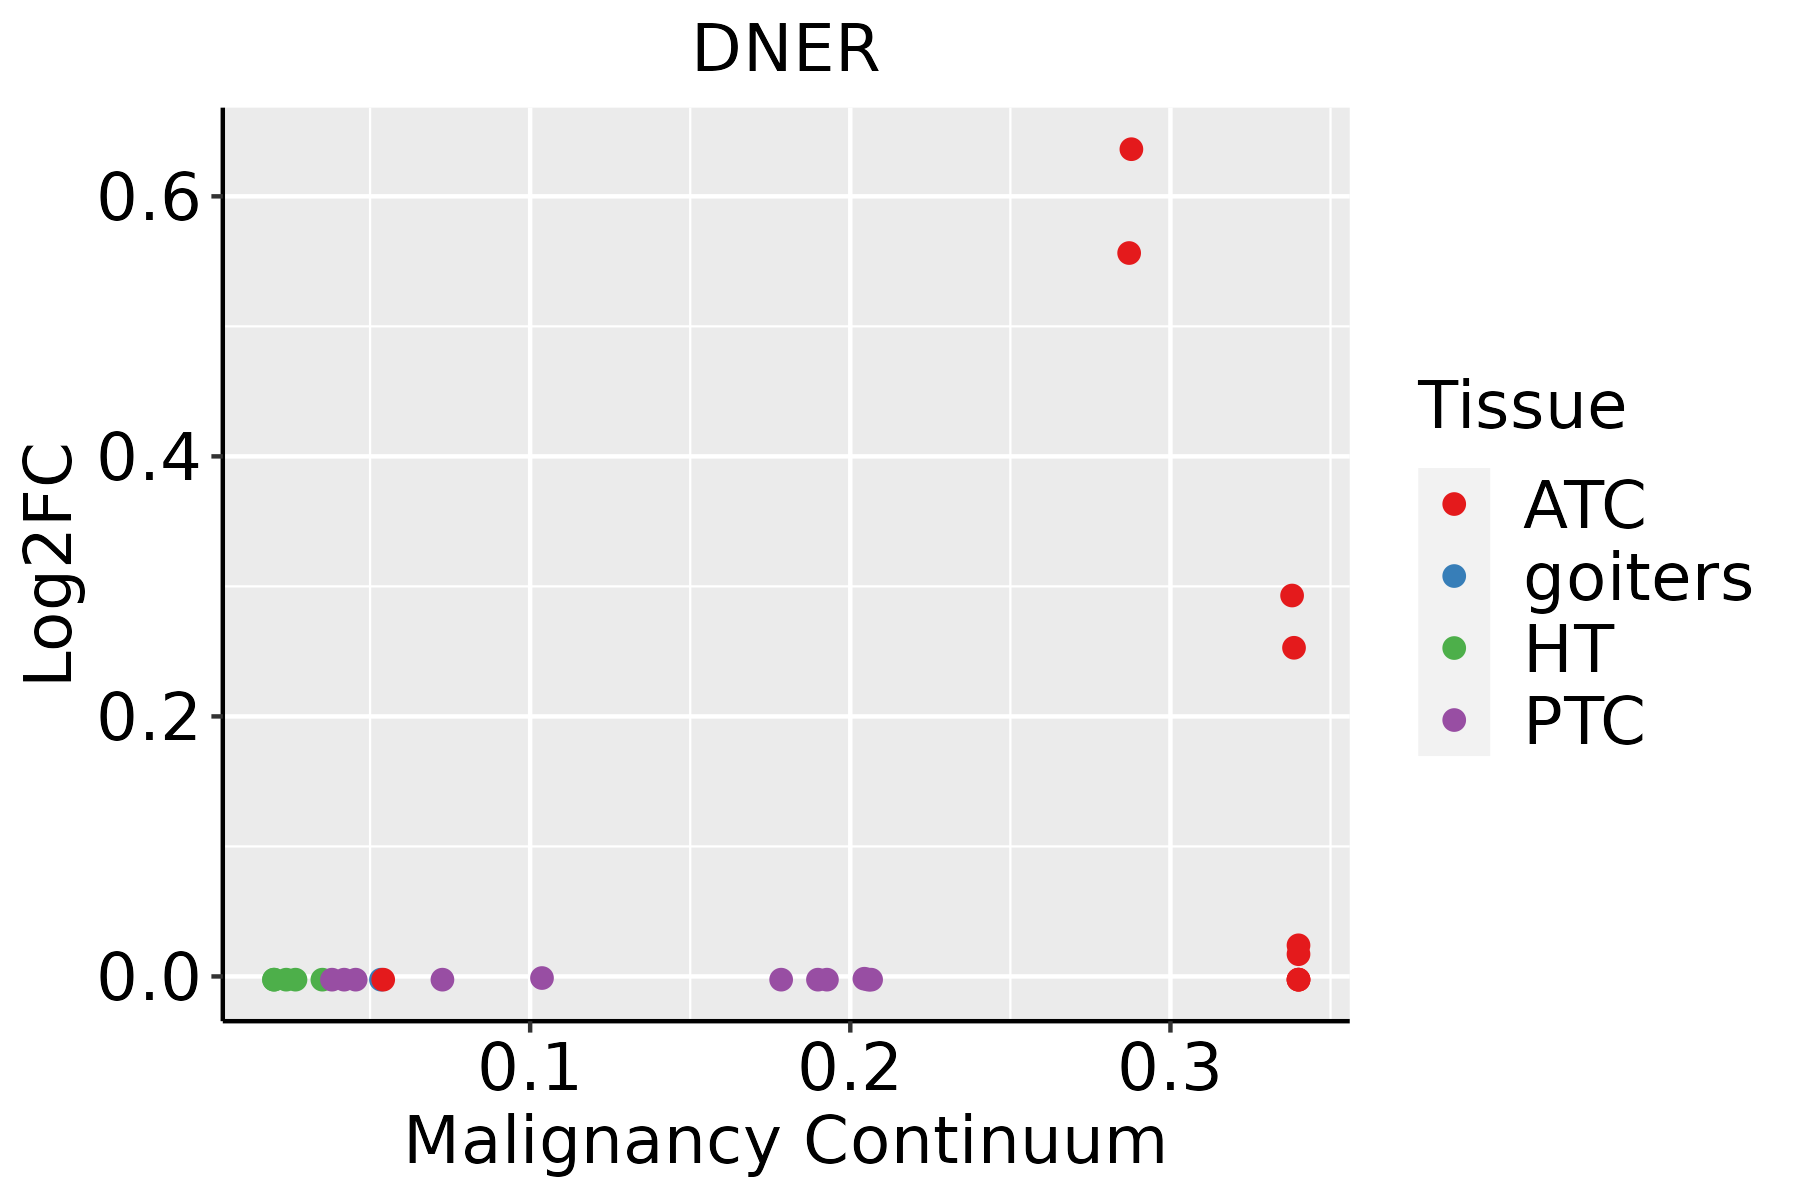 | ATC: Anaplastic thyroid cancer |
| HT: Hashimoto's thyroiditis | ||
| PTC: Papillary thyroid cancer |
| ∗log2FC in expression of this searched gene in stem-like cells from each diseased tissue sample relative to stem-like cells in normal samples in each tissue plotted against the malignancy continuum. Samples are colored based on if they are from different disease stage. |
Top |
Malignant transformation related pathway analysis |
| Find out the enriched GO biological processes and KEGG pathways involved in transition from healthy to precancer to cancer |
| Tissue | Disease Stage | Enriched GO biological Processes |
| Colorectum | AD |  |
| Colorectum | SER |  |
| Colorectum | MSS |  |
| Colorectum | MSI-H |  |
| Colorectum | FAP |  |
| ∗Top 15 enriched GO BP terms are showed in the bar plot of each disease state in each tissue. Each row represents a significant GO biological process which is colored according to the -log10(p.adjust). |
| Page: 1 2 3 4 5 6 7 8 9 |
| GO ID | Tissue | Disease Stage | Description | Gene Ratio | Bg Ratio | pvalue | p.adjust | Count |
| GO:006053724 | Thyroid | ATC | muscle tissue development | 181/6293 | 403/18723 | 1.27e-06 | 1.62e-05 | 181 |
| GO:003432924 | Thyroid | ATC | cell junction assembly | 187/6293 | 420/18723 | 1.71e-06 | 2.08e-05 | 187 |
| GO:001470622 | Thyroid | ATC | striated muscle tissue development | 168/6293 | 384/18723 | 1.91e-05 | 1.73e-04 | 168 |
| GO:004269216 | Thyroid | ATC | muscle cell differentiation | 165/6293 | 384/18723 | 7.17e-05 | 5.46e-04 | 165 |
| GO:000751716 | Thyroid | ATC | muscle organ development | 139/6293 | 327/18723 | 4.45e-04 | 2.64e-03 | 139 |
| GO:000721915 | Thyroid | ATC | Notch signaling pathway | 79/6293 | 172/18723 | 5.08e-04 | 2.96e-03 | 79 |
| GO:004206323 | Thyroid | ATC | gliogenesis | 127/6293 | 301/18723 | 1.07e-03 | 5.66e-03 | 127 |
| GO:005114617 | Thyroid | ATC | striated muscle cell differentiation | 119/6293 | 283/18723 | 1.74e-03 | 8.70e-03 | 119 |
| GO:005500112 | Thyroid | ATC | muscle cell development | 81/6293 | 184/18723 | 2.02e-03 | 9.60e-03 | 81 |
| GO:006053814 | Thyroid | ATC | skeletal muscle organ development | 71/6293 | 166/18723 | 8.39e-03 | 3.22e-02 | 71 |
| GO:000751913 | Thyroid | ATC | skeletal muscle tissue development | 66/6293 | 155/18723 | 1.20e-02 | 4.27e-02 | 66 |
| Page: 1 |
| Pathway ID | Tissue | Disease Stage | Description | Gene Ratio | Bg Ratio | pvalue | p.adjust | qvalue | Count |
| Page: 1 |
Top |
Cell-cell communication analysis |
| Identification of potential cell-cell interactions between two cell types and their ligand-receptor pairs for different disease states |
| Ligand | Receptor | LRpair | Pathway | Tissue | Disease Stage |
| Page: 1 |
Top |
Single-cell gene regulatory network inference analysis |
| Find out the significant the regulons (TFs) and the target genes of each regulon across cell types for different disease states |
| TF | Cell Type | Tissue | Disease Stage | Target Gene | RSS | Regulon Activity |
| ∗The dot plots of a searched regulon are shown for all cell subpopulations in each disease state of each tissue based on the regulon specific score inferred using pySCENIC and by calculating the average expression. |
| Page: 1 |
Top |
Somatic mutation of malignant transformation related genes |
| Annotation of somatic variants for genes involved in malignant transformation |
| Hugo Symbol | Variant Class | Variant Classification | dbSNP RS | HGVSc | HGVSp | HGVSp Short | SWISSPROT | BIOTYPE | SIFT | PolyPhen | Tumor Sample Barcode | Tissue | Histology | Sex | Age | Stage | Therapy Types | Drugs | Outcome |
| DNER | SNV | Missense_Mutation | novel | c.552N>T | p.Gln184His | p.Q184H | Q8NFT8 | protein_coding | deleterious(0.04) | probably_damaging(0.993) | TCGA-A2-A1FX-01 | Breast | breast invasive carcinoma | Female | <65 | III/IV | Chemotherapy | taxotere | SD |
| DNER | SNV | Missense_Mutation | novel | c.342N>G | p.Ser114Arg | p.S114R | Q8NFT8 | protein_coding | tolerated(0.48) | benign(0.1) | TCGA-B6-A0RS-01 | Breast | breast invasive carcinoma | Female | <65 | I/II | Unknown | Unknown | PD |
| DNER | deletion | Frame_Shift_Del | c.2064delC | p.Ser688ArgfsTer26 | p.S688Rfs*26 | Q8NFT8 | protein_coding | TCGA-D8-A27V-01 | Breast | breast invasive carcinoma | Female | <65 | I/II | Hormone Therapy | tamoxiphen | SD | |||
| DNER | SNV | Missense_Mutation | rs549129843 | c.2050N>T | p.Arg684Cys | p.R684C | Q8NFT8 | protein_coding | deleterious(0) | probably_damaging(0.996) | TCGA-A6-2684-01 | Colorectum | colon adenocarcinoma | Female | >=65 | I/II | Unknown | Unknown | PD |
| DNER | SNV | Missense_Mutation | rs749718515 | c.1996N>T | p.Arg666Cys | p.R666C | Q8NFT8 | protein_coding | deleterious(0) | probably_damaging(0.996) | TCGA-A6-2686-01 | Colorectum | colon adenocarcinoma | Female | >=65 | I/II | Unknown | Unknown | SD |
| DNER | SNV | Missense_Mutation | novel | c.1274N>A | p.Ser425Tyr | p.S425Y | Q8NFT8 | protein_coding | deleterious(0.02) | possibly_damaging(0.771) | TCGA-AA-3861-01 | Colorectum | colon adenocarcinoma | Male | >=65 | I/II | Unknown | Unknown | SD |
| DNER | SNV | Missense_Mutation | rs777616075 | c.823G>A | p.Ala275Thr | p.A275T | Q8NFT8 | protein_coding | tolerated(0.42) | benign(0) | TCGA-AA-3949-01 | Colorectum | colon adenocarcinoma | Female | >=65 | III/IV | Unknown | Unknown | SD |
| DNER | SNV | Missense_Mutation | c.1062N>C | p.Gln354His | p.Q354H | Q8NFT8 | protein_coding | tolerated(0.77) | benign(0.018) | TCGA-AA-3955-01 | Colorectum | colon adenocarcinoma | Male | <65 | III/IV | Chemotherapy | capecitabine | CR | |
| DNER | SNV | Missense_Mutation | c.1878N>A | p.His626Gln | p.H626Q | Q8NFT8 | protein_coding | tolerated(0.13) | benign(0.024) | TCGA-AA-3966-01 | Colorectum | colon adenocarcinoma | Female | >=65 | I/II | Unknown | Unknown | SD | |
| DNER | SNV | Missense_Mutation | rs749871660 | c.1162C>T | p.Leu388Phe | p.L388F | Q8NFT8 | protein_coding | tolerated(0.43) | benign(0.062) | TCGA-AA-A00N-01 | Colorectum | colon adenocarcinoma | Male | >=65 | I/II | Unknown | Unknown | PD |
| Page: 1 2 3 4 5 6 7 8 9 10 11 12 13 |
Top |
Related drugs of malignant transformation related genes |
| Identification of chemicals and drugs interact with genes involved in malignant transfromation |
| (DGIdb 4.0) |
| Entrez ID | Symbol | Category | Interaction Types | Drug Claim Name | Drug Name | PMIDs |
| 92737 | DNER | NA | Pyrimido-indole derivative 1 | |||
| 92737 | DNER | NA | FT-1101 | |||
| 92737 | DNER | NA | Dihydropyrido pyrazinone compound 1 | |||
| 92737 | DNER | NA | Isoxazole-based bicyclic compound 2 | |||
| 92737 | DNER | NA | Pyrimido-indole derivative 2 | |||
| 92737 | DNER | NA | RG6146 | |||
| 92737 | DNER | NA | PLX51107 | |||
| 92737 | DNER | NA | Tetra-hydro-quinoline derivative 3 | |||
| 92737 | DNER | NA | Isoxazole-based bicyclic compound 6 | |||
| 92737 | DNER | NA | Isoxazole-based bicyclic compound 18 |
| Page: 1 2 3 4 5 |

Copyright 2023-Present -The University of Texas Health Science Center at Houston |