
|
|||||
|
 | |
| |
| |
| |
| |
| |
|
Gene: DNASE1L1 |
Gene summary for DNASE1L1 |
| Gene information | Species | Human | Gene symbol | DNASE1L1 | Gene ID | 1774 |
| Gene name | deoxyribonuclease 1 like 1 | |
| Gene Alias | DNAS1L1 | |
| Cytomap | Xq28 | |
| Gene Type | protein-coding | GO ID | GO:0000737 | UniProtAcc | P49184 |
Top |
Malignant transformation analysis |
| Identification of the aberrant gene expression in precancerous and cancerous lesions by comparing the gene expression of stem-like cells in diseased tissues with normal stem cells |
| Entrez ID | Symbol | Replicates | Species | Organ | Tissue | Adj P-value | Log2FC | Malignancy |
| 1774 | DNASE1L1 | LZE4T | Human | Esophagus | ESCC | 4.03e-05 | 1.64e-01 | 0.0811 |
| 1774 | DNASE1L1 | LZE20T | Human | Esophagus | ESCC | 4.61e-07 | 2.53e-01 | 0.0662 |
| 1774 | DNASE1L1 | LZE22T | Human | Esophagus | ESCC | 1.08e-08 | 4.27e-01 | 0.068 |
| 1774 | DNASE1L1 | LZE24T | Human | Esophagus | ESCC | 4.97e-06 | 1.67e-01 | 0.0596 |
| 1774 | DNASE1L1 | LZE6T | Human | Esophagus | ESCC | 2.38e-04 | 1.97e-01 | 0.0845 |
| 1774 | DNASE1L1 | P1T-E | Human | Esophagus | ESCC | 1.63e-12 | 4.87e-01 | 0.0875 |
| 1774 | DNASE1L1 | P2T-E | Human | Esophagus | ESCC | 4.15e-07 | 1.08e-01 | 0.1177 |
| 1774 | DNASE1L1 | P4T-E | Human | Esophagus | ESCC | 2.03e-05 | 1.44e-01 | 0.1323 |
| 1774 | DNASE1L1 | P5T-E | Human | Esophagus | ESCC | 1.87e-06 | 2.07e-01 | 0.1327 |
| 1774 | DNASE1L1 | P8T-E | Human | Esophagus | ESCC | 3.10e-18 | 3.30e-01 | 0.0889 |
| 1774 | DNASE1L1 | P9T-E | Human | Esophagus | ESCC | 3.21e-07 | 2.02e-01 | 0.1131 |
| 1774 | DNASE1L1 | P10T-E | Human | Esophagus | ESCC | 7.52e-08 | 1.39e-01 | 0.116 |
| 1774 | DNASE1L1 | P11T-E | Human | Esophagus | ESCC | 1.89e-16 | 5.23e-01 | 0.1426 |
| 1774 | DNASE1L1 | P15T-E | Human | Esophagus | ESCC | 2.07e-09 | 1.53e-01 | 0.1149 |
| 1774 | DNASE1L1 | P17T-E | Human | Esophagus | ESCC | 1.26e-05 | 3.20e-01 | 0.1278 |
| 1774 | DNASE1L1 | P19T-E | Human | Esophagus | ESCC | 4.37e-04 | 4.80e-01 | 0.1662 |
| 1774 | DNASE1L1 | P20T-E | Human | Esophagus | ESCC | 1.33e-12 | 2.92e-01 | 0.1124 |
| 1774 | DNASE1L1 | P21T-E | Human | Esophagus | ESCC | 5.19e-17 | 4.21e-01 | 0.1617 |
| 1774 | DNASE1L1 | P22T-E | Human | Esophagus | ESCC | 5.36e-30 | 5.07e-01 | 0.1236 |
| 1774 | DNASE1L1 | P23T-E | Human | Esophagus | ESCC | 7.42e-30 | 7.10e-01 | 0.108 |
| Page: 1 2 3 4 5 |
| Tissue | Expression Dynamics | Abbreviation |
| Esophagus | 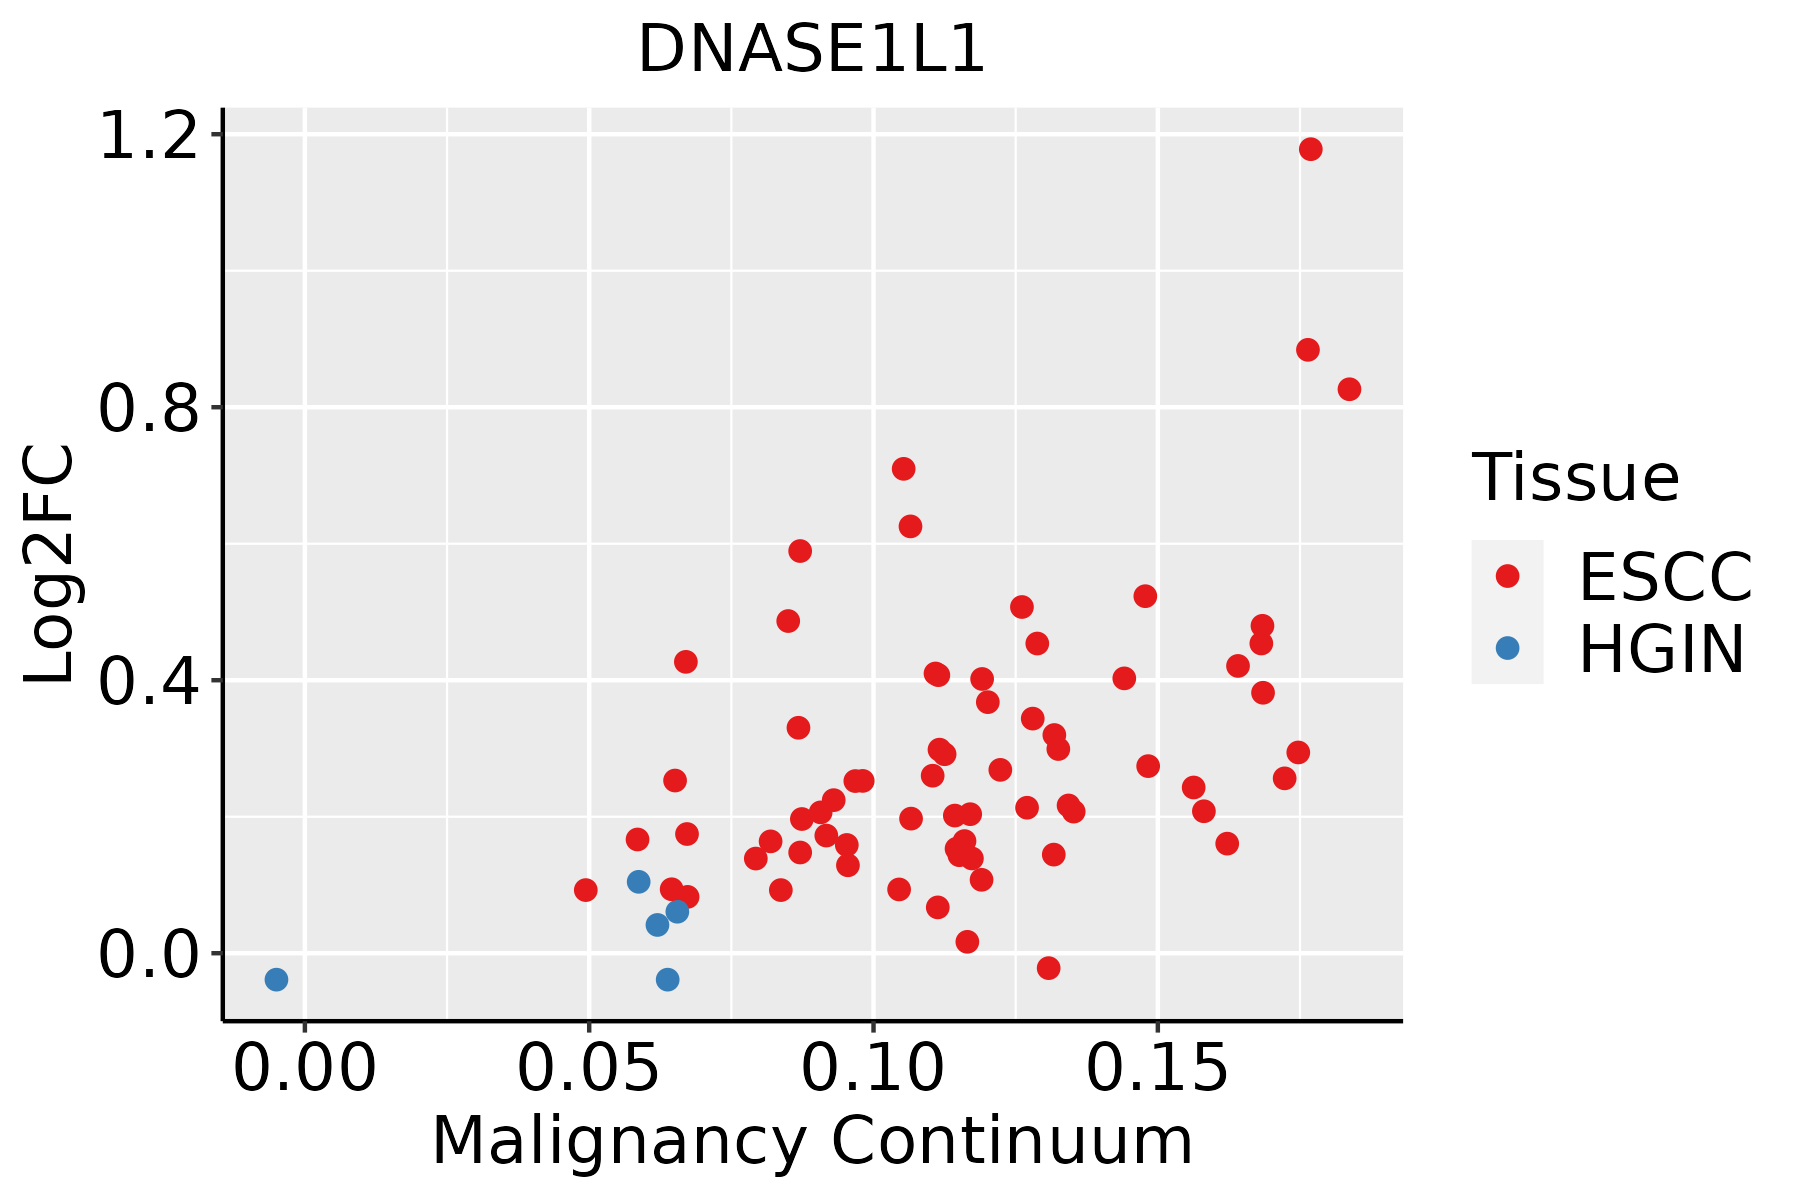 | ESCC: Esophageal squamous cell carcinoma |
| HGIN: High-grade intraepithelial neoplasias | ||
| LGIN: Low-grade intraepithelial neoplasias | ||
| Liver | 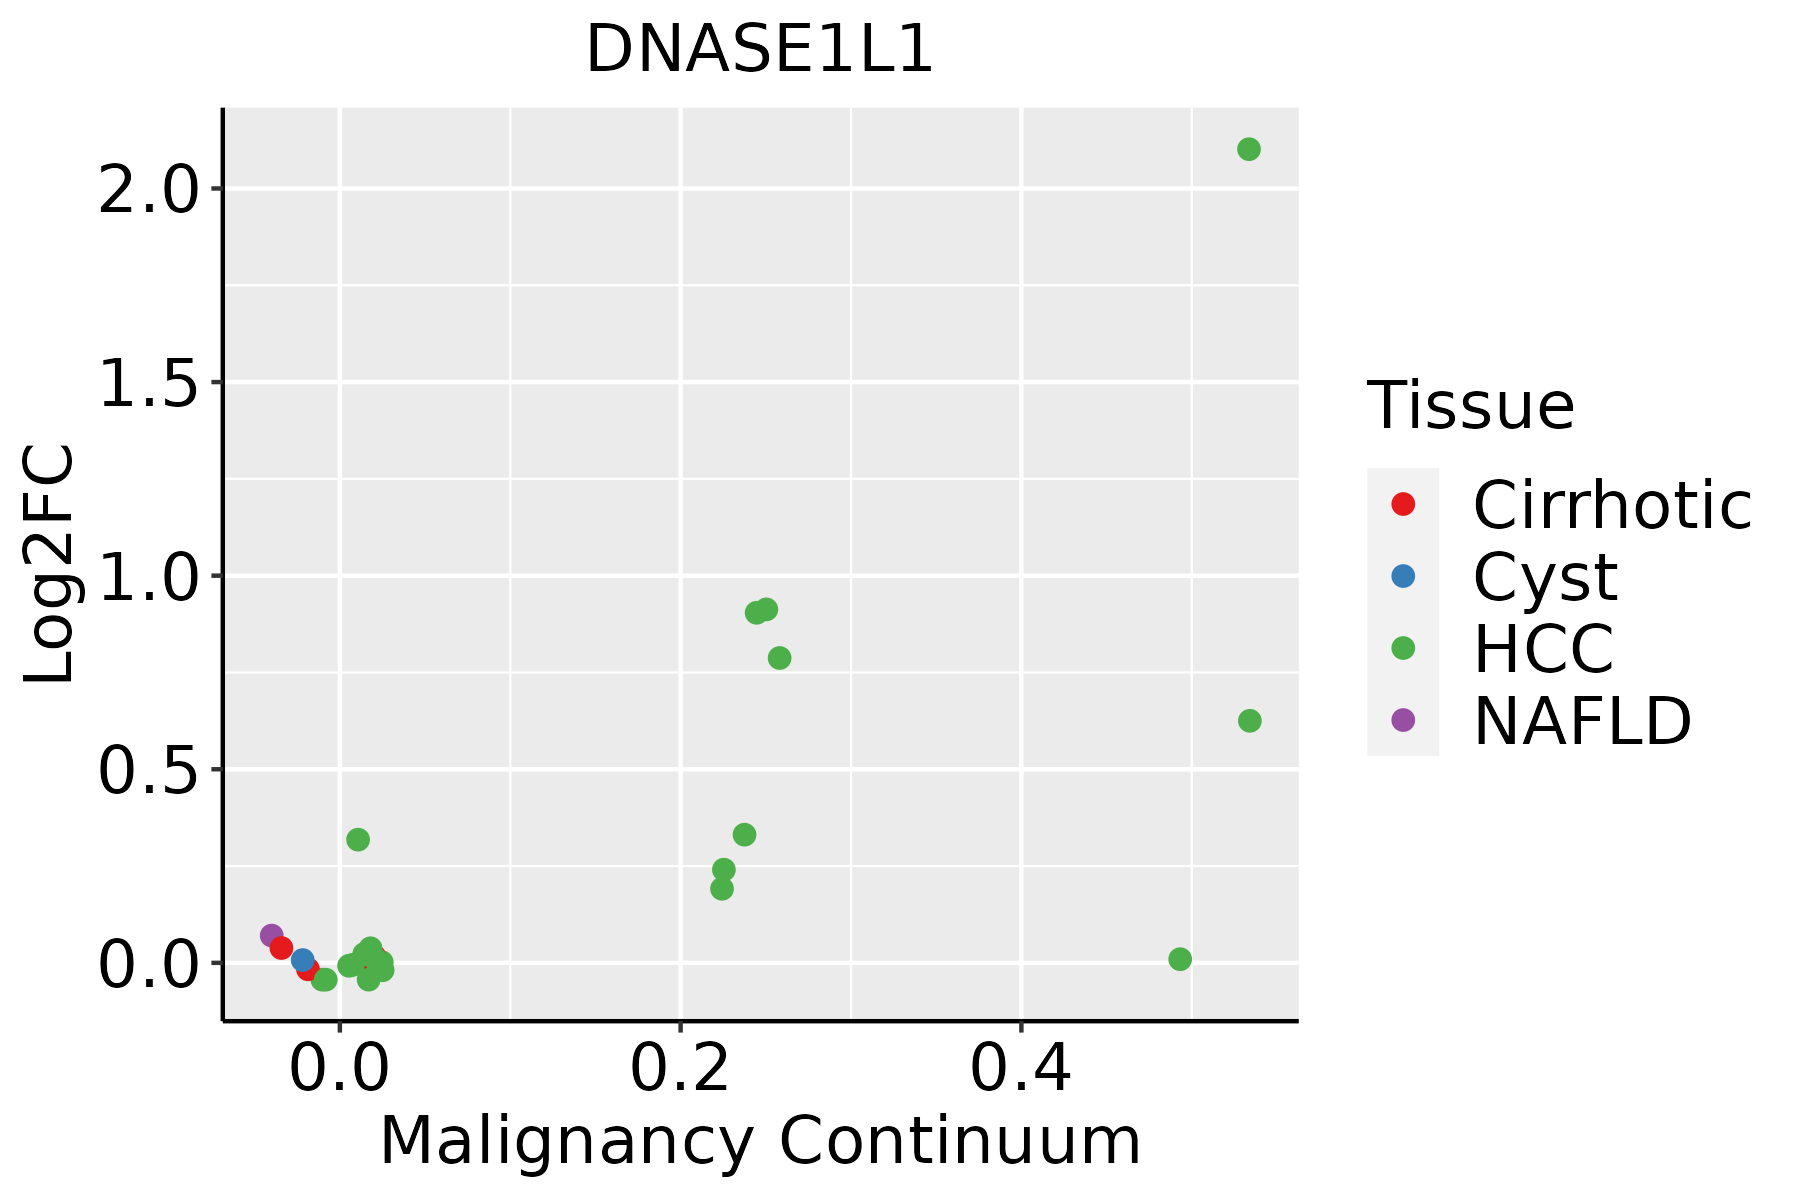 | HCC: Hepatocellular carcinoma |
| NAFLD: Non-alcoholic fatty liver disease | ||
| Oral Cavity | 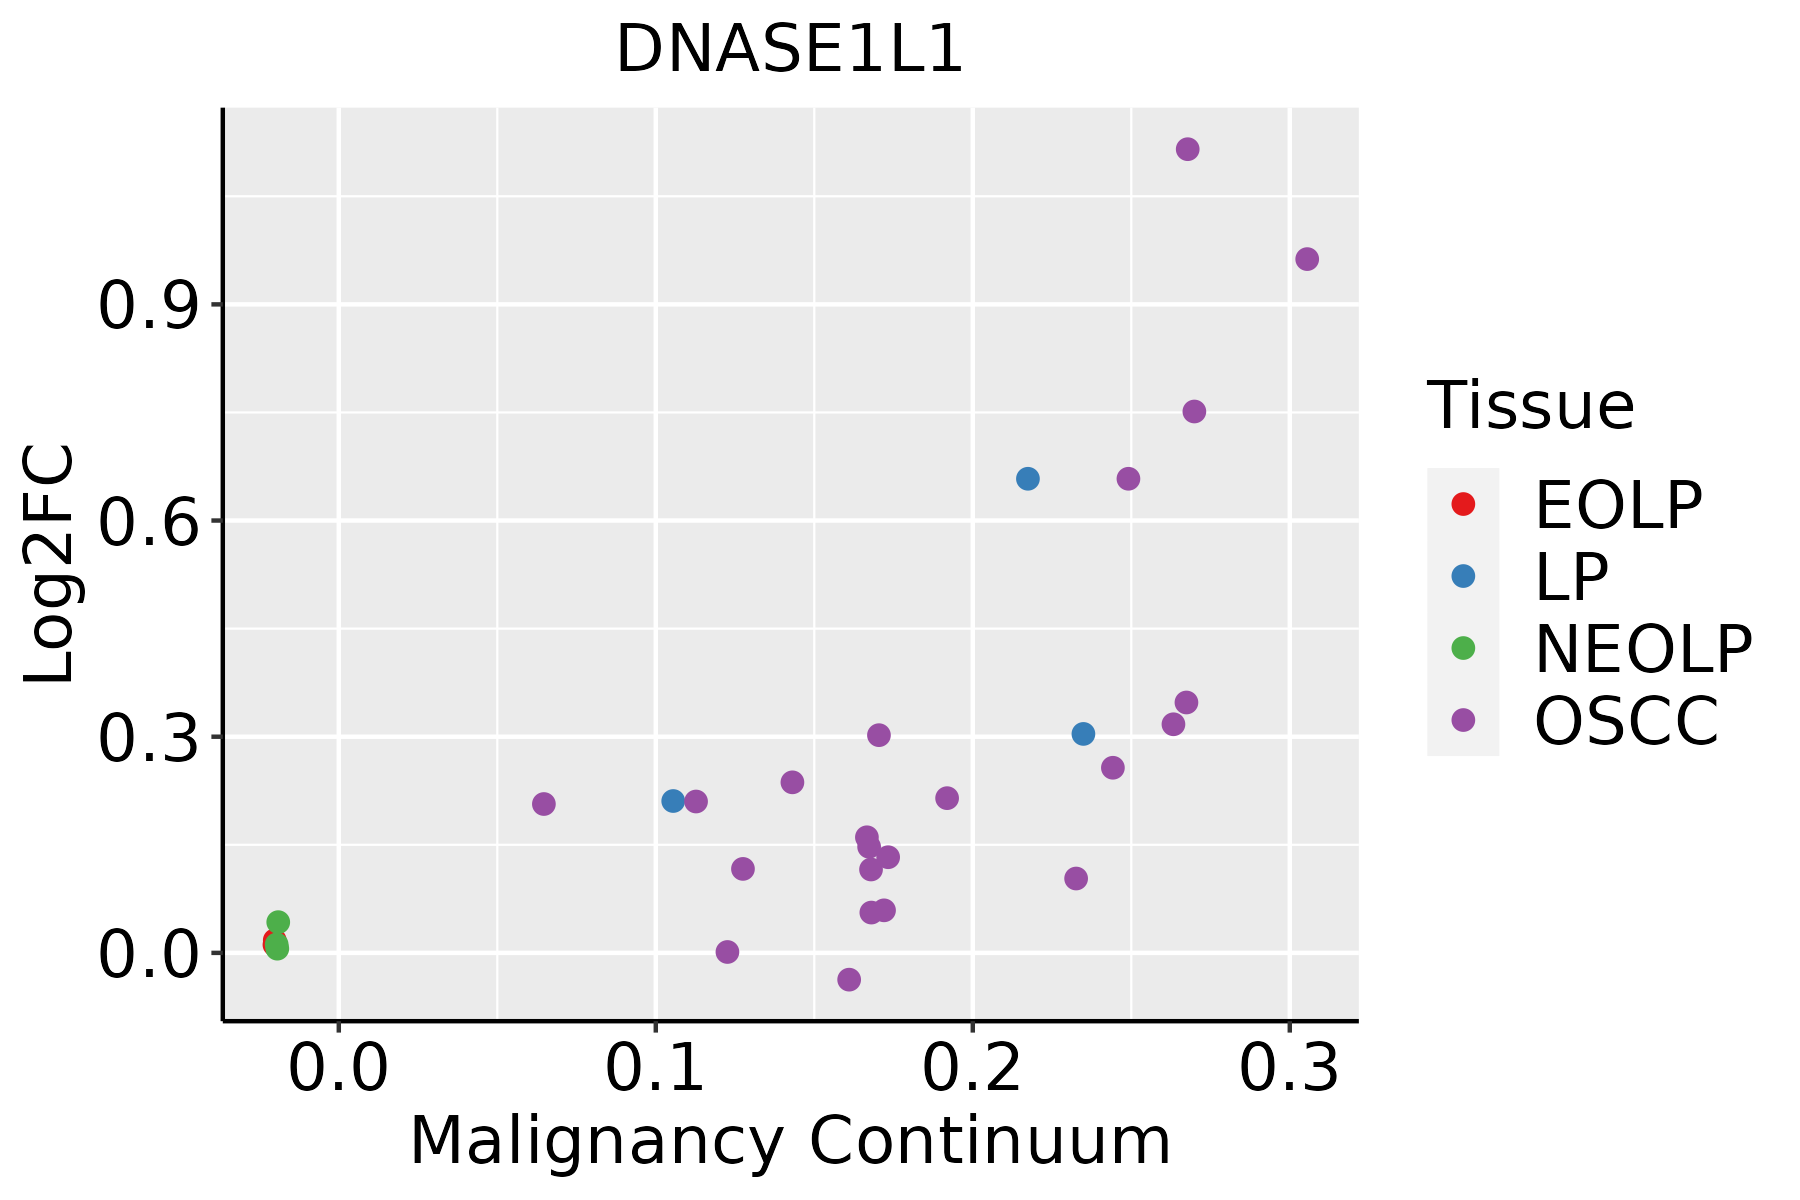 | EOLP: Erosive Oral lichen planus |
| LP: leukoplakia | ||
| NEOLP: Non-erosive oral lichen planus | ||
| OSCC: Oral squamous cell carcinoma |
| ∗log2FC in expression of this searched gene in stem-like cells from each diseased tissue sample relative to stem-like cells in normal samples in each tissue plotted against the malignancy continuum. Samples are colored based on if they are from different disease stage. |
Top |
Malignant transformation related pathway analysis |
| Find out the enriched GO biological processes and KEGG pathways involved in transition from healthy to precancer to cancer |
| Tissue | Disease Stage | Enriched GO biological Processes |
| Colorectum | AD |  |
| Colorectum | SER |  |
| Colorectum | MSS |  |
| Colorectum | MSI-H |  |
| Colorectum | FAP |  |
| ∗Top 15 enriched GO BP terms are showed in the bar plot of each disease state in each tissue. Each row represents a significant GO biological process which is colored according to the -log10(p.adjust). |
| Page: 1 2 3 4 5 6 7 8 9 |
| GO ID | Tissue | Disease Stage | Description | Gene Ratio | Bg Ratio | pvalue | p.adjust | Count |
| GO:0034655110 | Esophagus | ESCC | nucleobase-containing compound catabolic process | 272/8552 | 407/18723 | 2.92e-18 | 2.90e-16 | 272 |
| GO:004670018 | Esophagus | ESCC | heterocycle catabolic process | 286/8552 | 445/18723 | 1.12e-15 | 7.47e-14 | 286 |
| GO:004427019 | Esophagus | ESCC | cellular nitrogen compound catabolic process | 288/8552 | 451/18723 | 3.03e-15 | 1.79e-13 | 288 |
| GO:001943918 | Esophagus | ESCC | aromatic compound catabolic process | 295/8552 | 467/18723 | 1.09e-14 | 5.98e-13 | 295 |
| GO:190136118 | Esophagus | ESCC | organic cyclic compound catabolic process | 307/8552 | 495/18723 | 9.99e-14 | 4.80e-12 | 307 |
| GO:00903053 | Esophagus | ESCC | nucleic acid phosphodiester bond hydrolysis | 163/8552 | 261/18723 | 3.07e-08 | 5.73e-07 | 163 |
| GO:004427021 | Liver | HCC | cellular nitrogen compound catabolic process | 303/7958 | 451/18723 | 9.76e-27 | 3.64e-24 | 303 |
| GO:004670021 | Liver | HCC | heterocycle catabolic process | 299/7958 | 445/18723 | 2.07e-26 | 7.29e-24 | 299 |
| GO:190136121 | Liver | HCC | organic cyclic compound catabolic process | 325/7958 | 495/18723 | 6.52e-26 | 2.18e-23 | 325 |
| GO:001943921 | Liver | HCC | aromatic compound catabolic process | 309/7958 | 467/18723 | 1.56e-25 | 4.94e-23 | 309 |
| GO:003465521 | Liver | HCC | nucleobase-containing compound catabolic process | 273/7958 | 407/18723 | 4.84e-24 | 1.23e-21 | 273 |
| GO:0090305 | Liver | HCC | nucleic acid phosphodiester bond hydrolysis | 152/7958 | 261/18723 | 1.90e-07 | 3.46e-06 | 152 |
| GO:003465517 | Oral cavity | OSCC | nucleobase-containing compound catabolic process | 244/7305 | 407/18723 | 5.38e-18 | 5.49e-16 | 244 |
| GO:004670015 | Oral cavity | OSCC | heterocycle catabolic process | 254/7305 | 445/18723 | 5.07e-15 | 3.31e-13 | 254 |
| GO:004427016 | Oral cavity | OSCC | cellular nitrogen compound catabolic process | 256/7305 | 451/18723 | 9.67e-15 | 5.88e-13 | 256 |
| GO:001943915 | Oral cavity | OSCC | aromatic compound catabolic process | 263/7305 | 467/18723 | 1.49e-14 | 8.84e-13 | 263 |
| GO:190136115 | Oral cavity | OSCC | organic cyclic compound catabolic process | 272/7305 | 495/18723 | 2.73e-13 | 1.36e-11 | 272 |
| GO:00903052 | Oral cavity | OSCC | nucleic acid phosphodiester bond hydrolysis | 142/7305 | 261/18723 | 2.90e-07 | 4.43e-06 | 142 |
| GO:003465518 | Oral cavity | LP | nucleobase-containing compound catabolic process | 161/4623 | 407/18723 | 1.61e-11 | 1.15e-09 | 161 |
| GO:001943916 | Oral cavity | LP | aromatic compound catabolic process | 176/4623 | 467/18723 | 1.96e-10 | 1.08e-08 | 176 |
| Page: 1 2 |
| Pathway ID | Tissue | Disease Stage | Description | Gene Ratio | Bg Ratio | pvalue | p.adjust | qvalue | Count |
| Page: 1 |
Top |
Cell-cell communication analysis |
| Identification of potential cell-cell interactions between two cell types and their ligand-receptor pairs for different disease states |
| Ligand | Receptor | LRpair | Pathway | Tissue | Disease Stage |
| Page: 1 |
Top |
Single-cell gene regulatory network inference analysis |
| Find out the significant the regulons (TFs) and the target genes of each regulon across cell types for different disease states |
| TF | Cell Type | Tissue | Disease Stage | Target Gene | RSS | Regulon Activity |
| ∗The dot plots of a searched regulon are shown for all cell subpopulations in each disease state of each tissue based on the regulon specific score inferred using pySCENIC and by calculating the average expression. |
| Page: 1 |
Top |
Somatic mutation of malignant transformation related genes |
| Annotation of somatic variants for genes involved in malignant transformation |
| Hugo Symbol | Variant Class | Variant Classification | dbSNP RS | HGVSc | HGVSp | HGVSp Short | SWISSPROT | BIOTYPE | SIFT | PolyPhen | Tumor Sample Barcode | Tissue | Histology | Sex | Age | Stage | Therapy Types | Drugs | Outcome |
| DNASE1L1 | SNV | Missense_Mutation | c.756C>G | p.Phe252Leu | p.F252L | P49184 | protein_coding | deleterious(0.01) | benign(0.133) | TCGA-D8-A1XW-01 | Breast | breast invasive carcinoma | Female | <65 | I/II | Chemotherapy | adriamycin+cyclophosphamide | SD | |
| DNASE1L1 | SNV | Missense_Mutation | c.634G>A | p.Asp212Asn | p.D212N | P49184 | protein_coding | deleterious(0.02) | probably_damaging(0.994) | TCGA-EK-A3GK-01 | Cervix | cervical & endocervical cancer | Female | <65 | I/II | Unknown | Unknown | SD | |
| DNASE1L1 | SNV | Missense_Mutation | c.634G>A | p.Asp212Asn | p.D212N | P49184 | protein_coding | deleterious(0.02) | probably_damaging(0.994) | TCGA-EX-A1H6-01 | Cervix | cervical & endocervical cancer | Female | <65 | I/II | Unknown | Unknown | SD | |
| DNASE1L1 | SNV | Missense_Mutation | rs782017649 | c.562G>A | p.Ala188Thr | p.A188T | P49184 | protein_coding | tolerated(0.28) | benign(0.04) | TCGA-A5-A1OF-01 | Endometrium | uterine corpus endometrioid carcinoma | Female | <65 | I/II | Unknown | Unknown | SD |
| DNASE1L1 | SNV | Missense_Mutation | rs781814446 | c.487G>A | p.Asp163Asn | p.D163N | P49184 | protein_coding | deleterious(0.05) | benign(0.012) | TCGA-A5-A1OF-01 | Endometrium | uterine corpus endometrioid carcinoma | Female | <65 | I/II | Unknown | Unknown | SD |
| DNASE1L1 | SNV | Missense_Mutation | c.295N>C | p.Tyr99His | p.Y99H | P49184 | protein_coding | deleterious(0) | probably_damaging(0.999) | TCGA-AX-A063-01 | Endometrium | uterine corpus endometrioid carcinoma | Female | <65 | I/II | Unknown | Unknown | SD | |
| DNASE1L1 | SNV | Missense_Mutation | novel | c.190A>G | p.Ser64Gly | p.S64G | P49184 | protein_coding | tolerated(0.25) | benign(0.039) | TCGA-B5-A3FA-01 | Endometrium | uterine corpus endometrioid carcinoma | Female | >=65 | I/II | Unknown | Unknown | SD |
| DNASE1L1 | SNV | Missense_Mutation | rs782331239 | c.710N>A | p.Arg237Gln | p.R237Q | P49184 | protein_coding | tolerated(0.51) | benign(0) | TCGA-B5-A5OC-01 | Endometrium | uterine corpus endometrioid carcinoma | Female | >=65 | III/IV | Chemotherapy | cisplatin | SD |
| DNASE1L1 | SNV | Missense_Mutation | novel | c.371N>T | p.Ala124Val | p.A124V | P49184 | protein_coding | deleterious(0.04) | possibly_damaging(0.686) | TCGA-DF-A2KU-01 | Endometrium | uterine corpus endometrioid carcinoma | Female | Unknown | I/II | Unknown | Unknown | SD |
| DNASE1L1 | SNV | Missense_Mutation | rs372745600 | c.460G>A | p.Val154Ile | p.V154I | P49184 | protein_coding | tolerated(0.09) | possibly_damaging(0.899) | TCGA-EO-A22R-01 | Endometrium | uterine corpus endometrioid carcinoma | Female | <65 | I/II | Unknown | Unknown | SD |
| Page: 1 2 3 |
Top |
Related drugs of malignant transformation related genes |
| Identification of chemicals and drugs interact with genes involved in malignant transfromation |
| (DGIdb 4.0) |
| Entrez ID | Symbol | Category | Interaction Types | Drug Claim Name | Drug Name | PMIDs |
| Page: 1 |

Copyright 2023-Present -The University of Texas Health Science Center at Houston |