
|
|||||
|
 | |
| |
| |
| |
| |
| |
|
Gene: DNALI1 |
Gene summary for DNALI1 |
| Gene information | Species | Human | Gene symbol | DNALI1 | Gene ID | 7802 |
| Gene name | dynein axonemal light intermediate chain 1 | |
| Gene Alias | P28 | |
| Cytomap | 1p34.3 | |
| Gene Type | protein-coding | GO ID | GO:0005575 | UniProtAcc | O14645 |
Top |
Malignant transformation analysis |
| Identification of the aberrant gene expression in precancerous and cancerous lesions by comparing the gene expression of stem-like cells in diseased tissues with normal stem cells |
| Entrez ID | Symbol | Replicates | Species | Organ | Tissue | Adj P-value | Log2FC | Malignancy |
| 7802 | DNALI1 | P16T-E | Human | Esophagus | ESCC | 2.86e-04 | 1.05e-01 | 0.1153 |
| 7802 | DNALI1 | P57T-E | Human | Esophagus | ESCC | 5.46e-05 | 1.02e-01 | 0.0926 |
| 7802 | DNALI1 | P76T-E | Human | Esophagus | ESCC | 2.77e-10 | 2.73e-01 | 0.1207 |
| 7802 | DNALI1 | P82T-E | Human | Esophagus | ESCC | 5.04e-05 | 3.47e-01 | 0.1072 |
| 7802 | DNALI1 | P128T-E | Human | Esophagus | ESCC | 1.01e-26 | 8.94e-01 | 0.1241 |
| 7802 | DNALI1 | P130T-E | Human | Esophagus | ESCC | 7.16e-17 | 5.01e-01 | 0.1676 |
| 7802 | DNALI1 | HCC1_Meng | Human | Liver | HCC | 2.35e-61 | 3.74e-02 | 0.0246 |
| 7802 | DNALI1 | HCC2_Meng | Human | Liver | HCC | 1.38e-15 | -5.93e-02 | 0.0107 |
| 7802 | DNALI1 | cirrhotic2 | Human | Liver | Cirrhotic | 5.28e-03 | 9.83e-02 | 0.0201 |
| 7802 | DNALI1 | S014 | Human | Liver | HCC | 1.36e-11 | 5.76e-01 | 0.2254 |
| 7802 | DNALI1 | S015 | Human | Liver | HCC | 1.24e-13 | 8.34e-01 | 0.2375 |
| 7802 | DNALI1 | S016 | Human | Liver | HCC | 6.20e-18 | 7.80e-01 | 0.2243 |
| 7802 | DNALI1 | S027 | Human | Liver | HCC | 2.71e-04 | 7.32e-01 | 0.2446 |
| 7802 | DNALI1 | S028 | Human | Liver | HCC | 1.23e-15 | 8.81e-01 | 0.2503 |
| 7802 | DNALI1 | S029 | Human | Liver | HCC | 1.04e-17 | 1.13e+00 | 0.2581 |
| Page: 1 |
| Tissue | Expression Dynamics | Abbreviation |
| Esophagus | 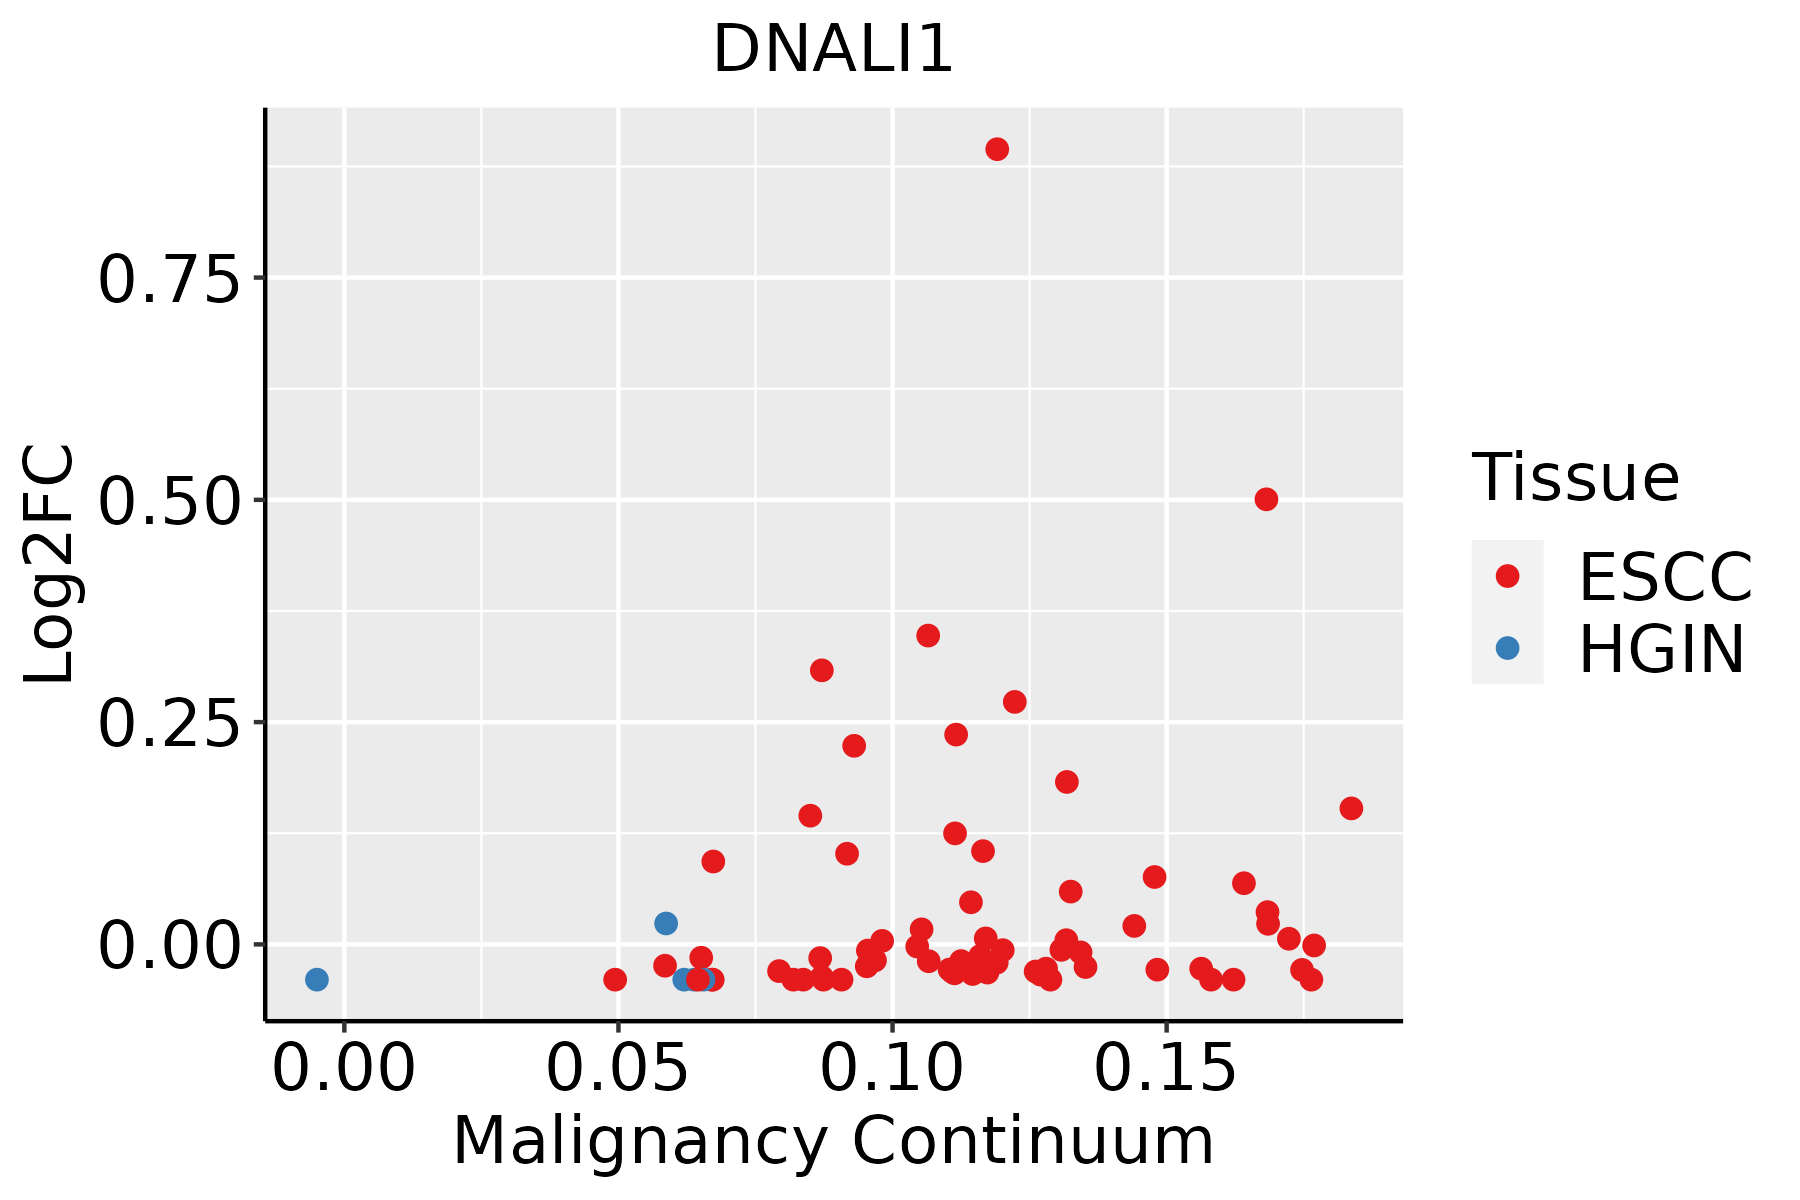 | ESCC: Esophageal squamous cell carcinoma |
| HGIN: High-grade intraepithelial neoplasias | ||
| LGIN: Low-grade intraepithelial neoplasias | ||
| Liver | 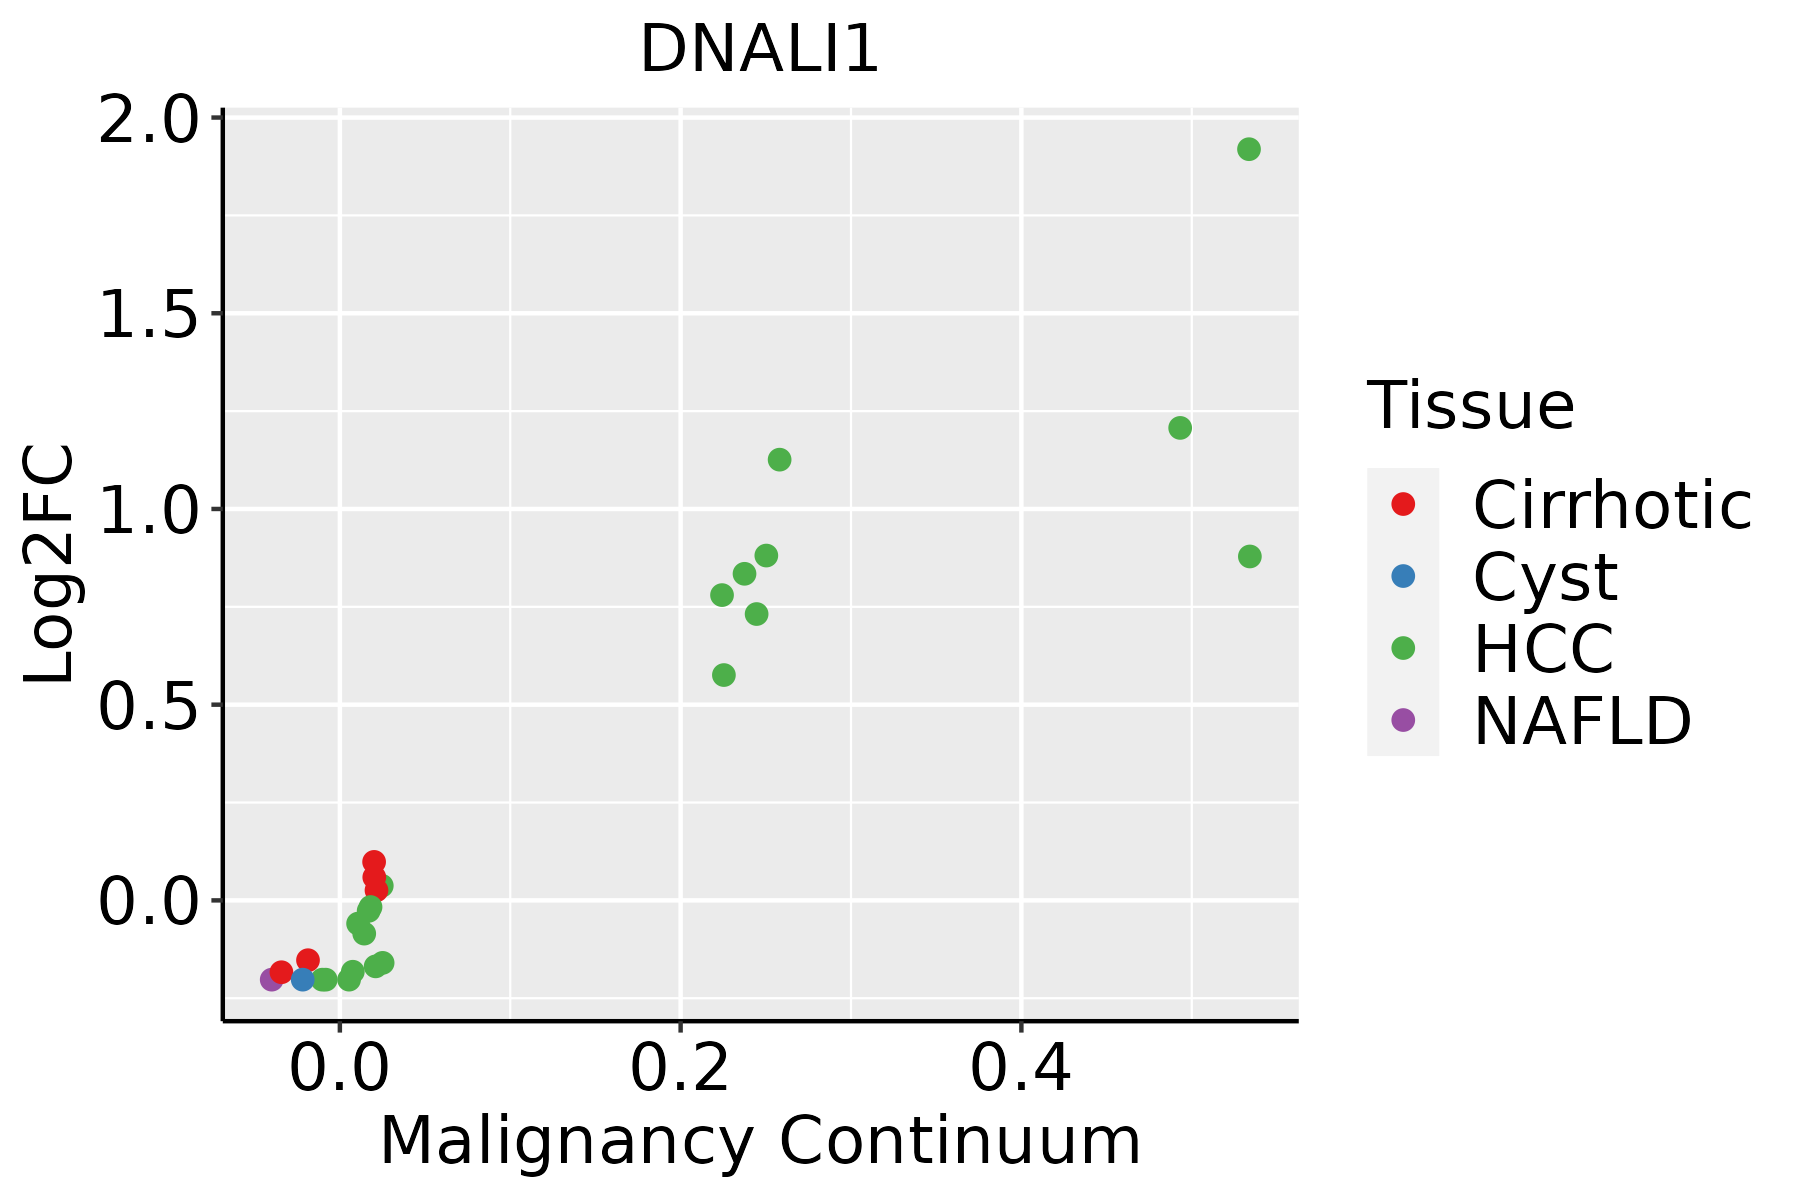 | HCC: Hepatocellular carcinoma |
| NAFLD: Non-alcoholic fatty liver disease |
| ∗log2FC in expression of this searched gene in stem-like cells from each diseased tissue sample relative to stem-like cells in normal samples in each tissue plotted against the malignancy continuum. Samples are colored based on if they are from different disease stage. |
Top |
Malignant transformation related pathway analysis |
| Find out the enriched GO biological processes and KEGG pathways involved in transition from healthy to precancer to cancer |
| Tissue | Disease Stage | Enriched GO biological Processes |
| Colorectum | AD |  |
| Colorectum | SER |  |
| Colorectum | MSS |  |
| Colorectum | MSI-H |  |
| Colorectum | FAP |  |
| ∗Top 15 enriched GO BP terms are showed in the bar plot of each disease state in each tissue. Each row represents a significant GO biological process which is colored according to the -log10(p.adjust). |
| Page: 1 2 3 4 5 6 7 8 9 |
| GO ID | Tissue | Disease Stage | Description | Gene Ratio | Bg Ratio | pvalue | p.adjust | Count |
| Page: 1 |
| Pathway ID | Tissue | Disease Stage | Description | Gene Ratio | Bg Ratio | pvalue | p.adjust | qvalue | Count |
| hsa05022210 | Esophagus | ESCC | Pathways of neurodegeneration - multiple diseases | 318/4205 | 476/8465 | 6.10e-15 | 2.04e-13 | 1.05e-13 | 318 |
| hsa0502238 | Esophagus | ESCC | Pathways of neurodegeneration - multiple diseases | 318/4205 | 476/8465 | 6.10e-15 | 2.04e-13 | 1.05e-13 | 318 |
| hsa0501614 | Liver | Cirrhotic | Huntington disease | 172/2530 | 306/8465 | 1.65e-22 | 1.10e-20 | 6.77e-21 | 172 |
| hsa0501414 | Liver | Cirrhotic | Amyotrophic lateral sclerosis | 187/2530 | 364/8465 | 1.56e-18 | 6.50e-17 | 4.01e-17 | 187 |
| hsa0502214 | Liver | Cirrhotic | Pathways of neurodegeneration - multiple diseases | 217/2530 | 476/8465 | 7.30e-14 | 2.03e-12 | 1.25e-12 | 217 |
| hsa0501615 | Liver | Cirrhotic | Huntington disease | 172/2530 | 306/8465 | 1.65e-22 | 1.10e-20 | 6.77e-21 | 172 |
| hsa0501415 | Liver | Cirrhotic | Amyotrophic lateral sclerosis | 187/2530 | 364/8465 | 1.56e-18 | 6.50e-17 | 4.01e-17 | 187 |
| hsa0502215 | Liver | Cirrhotic | Pathways of neurodegeneration - multiple diseases | 217/2530 | 476/8465 | 7.30e-14 | 2.03e-12 | 1.25e-12 | 217 |
| hsa0501622 | Liver | HCC | Huntington disease | 219/4020 | 306/8465 | 3.06e-18 | 3.42e-16 | 1.90e-16 | 219 |
| hsa0501422 | Liver | HCC | Amyotrophic lateral sclerosis | 252/4020 | 364/8465 | 8.85e-18 | 7.41e-16 | 4.12e-16 | 252 |
| hsa0502222 | Liver | HCC | Pathways of neurodegeneration - multiple diseases | 298/4020 | 476/8465 | 6.59e-12 | 1.30e-10 | 7.22e-11 | 298 |
| hsa0501632 | Liver | HCC | Huntington disease | 219/4020 | 306/8465 | 3.06e-18 | 3.42e-16 | 1.90e-16 | 219 |
| hsa0501432 | Liver | HCC | Amyotrophic lateral sclerosis | 252/4020 | 364/8465 | 8.85e-18 | 7.41e-16 | 4.12e-16 | 252 |
| hsa0502232 | Liver | HCC | Pathways of neurodegeneration - multiple diseases | 298/4020 | 476/8465 | 6.59e-12 | 1.30e-10 | 7.22e-11 | 298 |
| Page: 1 |
Top |
Cell-cell communication analysis |
| Identification of potential cell-cell interactions between two cell types and their ligand-receptor pairs for different disease states |
| Ligand | Receptor | LRpair | Pathway | Tissue | Disease Stage |
| Page: 1 |
Top |
Single-cell gene regulatory network inference analysis |
| Find out the significant the regulons (TFs) and the target genes of each regulon across cell types for different disease states |
| TF | Cell Type | Tissue | Disease Stage | Target Gene | RSS | Regulon Activity |
| ∗The dot plots of a searched regulon are shown for all cell subpopulations in each disease state of each tissue based on the regulon specific score inferred using pySCENIC and by calculating the average expression. |
| Page: 1 |
Top |
Somatic mutation of malignant transformation related genes |
| Annotation of somatic variants for genes involved in malignant transformation |
| Hugo Symbol | Variant Class | Variant Classification | dbSNP RS | HGVSc | HGVSp | HGVSp Short | SWISSPROT | BIOTYPE | SIFT | PolyPhen | Tumor Sample Barcode | Tissue | Histology | Sex | Age | Stage | Therapy Types | Drugs | Outcome |
| DNALI1 | SNV | Missense_Mutation | c.824T>C | p.Ile275Thr | p.I275T | O14645 | protein_coding | deleterious(0) | possibly_damaging(0.667) | TCGA-A2-A0T0-01 | Breast | breast invasive carcinoma | Female | <65 | I/II | Chemotherapy | taxotere | SD | |
| DNALI1 | insertion | In_Frame_Ins | novel | c.636_637insGGCCTTTCTCTT | p.Glu212_Arg213insGlyLeuSerLeu | p.E212_R213insGLSL | O14645 | protein_coding | TCGA-A2-A0D2-01 | Breast | breast invasive carcinoma | Female | <65 | I/II | Chemotherapy | adriamycin | SD | ||
| DNALI1 | insertion | Frame_Shift_Ins | novel | c.637_638insTCTCAAC | p.Arg213IlefsTer27 | p.R213Ifs*27 | O14645 | protein_coding | TCGA-A2-A0D2-01 | Breast | breast invasive carcinoma | Female | <65 | I/II | Chemotherapy | adriamycin | SD | ||
| DNALI1 | SNV | Missense_Mutation | novel | c.297N>T | p.Glu99Asp | p.E99D | O14645 | protein_coding | deleterious(0.03) | benign(0.379) | TCGA-5M-AAT4-01 | Colorectum | colon adenocarcinoma | Male | >=65 | III/IV | Unknown | Unknown | PD |
| DNALI1 | SNV | Missense_Mutation | rs202055051 | c.584C>T | p.Ala195Val | p.A195V | O14645 | protein_coding | deleterious(0) | possibly_damaging(0.476) | TCGA-AA-A00N-01 | Colorectum | colon adenocarcinoma | Male | >=65 | I/II | Unknown | Unknown | PD |
| DNALI1 | SNV | Missense_Mutation | novel | c.132G>T | p.Glu44Asp | p.E44D | O14645 | protein_coding | tolerated(0.67) | benign(0.026) | TCGA-AZ-4315-01 | Colorectum | colon adenocarcinoma | Male | <65 | I/II | Unknown | Unknown | SD |
| DNALI1 | deletion | In_Frame_Del | c.100_102delGAC | p.Asp34del | p.D34del | O14645 | protein_coding | TCGA-CM-4743-01 | Colorectum | colon adenocarcinoma | Male | >=65 | I/II | Chemotherapy | capecitabine | SD | |||
| DNALI1 | SNV | Missense_Mutation | novel | c.764A>G | p.Asn255Ser | p.N255S | O14645 | protein_coding | tolerated(0.74) | benign(0) | TCGA-A5-A1OF-01 | Endometrium | uterine corpus endometrioid carcinoma | Female | <65 | I/II | Unknown | Unknown | SD |
| DNALI1 | SNV | Missense_Mutation | novel | c.190G>T | p.Gly64Cys | p.G64C | O14645 | protein_coding | deleterious(0.02) | possibly_damaging(0.462) | TCGA-AX-A1CE-01 | Endometrium | uterine corpus endometrioid carcinoma | Female | <65 | I/II | Unspecific | Paclitaxel | SD |
| DNALI1 | SNV | Missense_Mutation | novel | c.160A>C | p.Lys54Gln | p.K54Q | O14645 | protein_coding | tolerated(0.15) | benign(0.187) | TCGA-EO-A22X-01 | Endometrium | uterine corpus endometrioid carcinoma | Female | <65 | III/IV | Unspecific | Carboplatin | Complete Response |
| Page: 1 2 |
Top |
Related drugs of malignant transformation related genes |
| Identification of chemicals and drugs interact with genes involved in malignant transfromation |
| (DGIdb 4.0) |
| Entrez ID | Symbol | Category | Interaction Types | Drug Claim Name | Drug Name | PMIDs |
| Page: 1 |

Copyright 2023-Present -The University of Texas Health Science Center at Houston |