
|
|||||
|
 | |
| |
| |
| |
| |
| |
|
Gene: DNAL4 |
Gene summary for DNAL4 |
| Gene information | Species | Human | Gene symbol | DNAL4 | Gene ID | 10126 |
| Gene name | dynein axonemal light chain 4 | |
| Gene Alias | MRMV3 | |
| Cytomap | 22q13.1 | |
| Gene Type | protein-coding | GO ID | GO:0006928 | UniProtAcc | O96015 |
Top |
Malignant transformation analysis |
| Identification of the aberrant gene expression in precancerous and cancerous lesions by comparing the gene expression of stem-like cells in diseased tissues with normal stem cells |
| Entrez ID | Symbol | Replicates | Species | Organ | Tissue | Adj P-value | Log2FC | Malignancy |
| 10126 | DNAL4 | HTA11_3410_2000001011 | Human | Colorectum | AD | 1.81e-06 | 1.64e-01 | 0.0155 |
| 10126 | DNAL4 | HTA11_2487_2000001011 | Human | Colorectum | SER | 2.44e-05 | 1.89e-01 | -0.1808 |
| 10126 | DNAL4 | HTA11_1938_2000001011 | Human | Colorectum | AD | 6.59e-07 | 2.32e-01 | -0.0811 |
| 10126 | DNAL4 | HTA11_78_2000001011 | Human | Colorectum | AD | 1.66e-02 | 1.14e-01 | -0.1088 |
| 10126 | DNAL4 | HTA11_347_2000001011 | Human | Colorectum | AD | 2.51e-09 | 2.27e-01 | -0.1954 |
| 10126 | DNAL4 | HTA11_2112_2000001011 | Human | Colorectum | SER | 1.90e-02 | 2.44e-01 | -0.2196 |
| 10126 | DNAL4 | HTA11_3361_2000001011 | Human | Colorectum | AD | 1.91e-05 | 1.91e-01 | -0.1207 |
| 10126 | DNAL4 | HTA11_83_2000001011 | Human | Colorectum | SER | 5.74e-08 | 3.09e-01 | -0.1526 |
| 10126 | DNAL4 | HTA11_696_2000001011 | Human | Colorectum | AD | 3.52e-13 | 2.76e-01 | -0.1464 |
| 10126 | DNAL4 | HTA11_866_2000001011 | Human | Colorectum | AD | 9.04e-05 | 1.35e-01 | -0.1001 |
| 10126 | DNAL4 | HTA11_1391_2000001011 | Human | Colorectum | AD | 4.63e-07 | 1.75e-01 | -0.059 |
| 10126 | DNAL4 | HTA11_2992_2000001011 | Human | Colorectum | SER | 1.09e-02 | 2.14e-01 | -0.1706 |
| 10126 | DNAL4 | HTA11_546_2000001011 | Human | Colorectum | AD | 8.71e-06 | 2.30e-01 | -0.0842 |
| 10126 | DNAL4 | HTA11_7862_2000001011 | Human | Colorectum | AD | 1.24e-02 | 1.60e-01 | -0.0179 |
| 10126 | DNAL4 | HTA11_866_3004761011 | Human | Colorectum | AD | 5.28e-08 | 2.28e-01 | 0.096 |
| 10126 | DNAL4 | HTA11_8622_2000001021 | Human | Colorectum | SER | 3.19e-02 | 1.83e-01 | 0.0528 |
| 10126 | DNAL4 | HTA11_7663_2000001011 | Human | Colorectum | SER | 7.58e-06 | 3.59e-01 | 0.0131 |
| 10126 | DNAL4 | HTA11_10623_2000001011 | Human | Colorectum | AD | 8.98e-03 | 1.87e-01 | -0.0177 |
| 10126 | DNAL4 | HTA11_10711_2000001011 | Human | Colorectum | AD | 7.11e-07 | 2.02e-01 | 0.0338 |
| 10126 | DNAL4 | HTA11_7696_3000711011 | Human | Colorectum | AD | 1.96e-10 | 2.68e-01 | 0.0674 |
| Page: 1 2 3 4 5 6 |
| Tissue | Expression Dynamics | Abbreviation |
| Colorectum (GSE201348) |  | FAP: Familial adenomatous polyposis |
| CRC: Colorectal cancer | ||
| Colorectum (HTA11) | 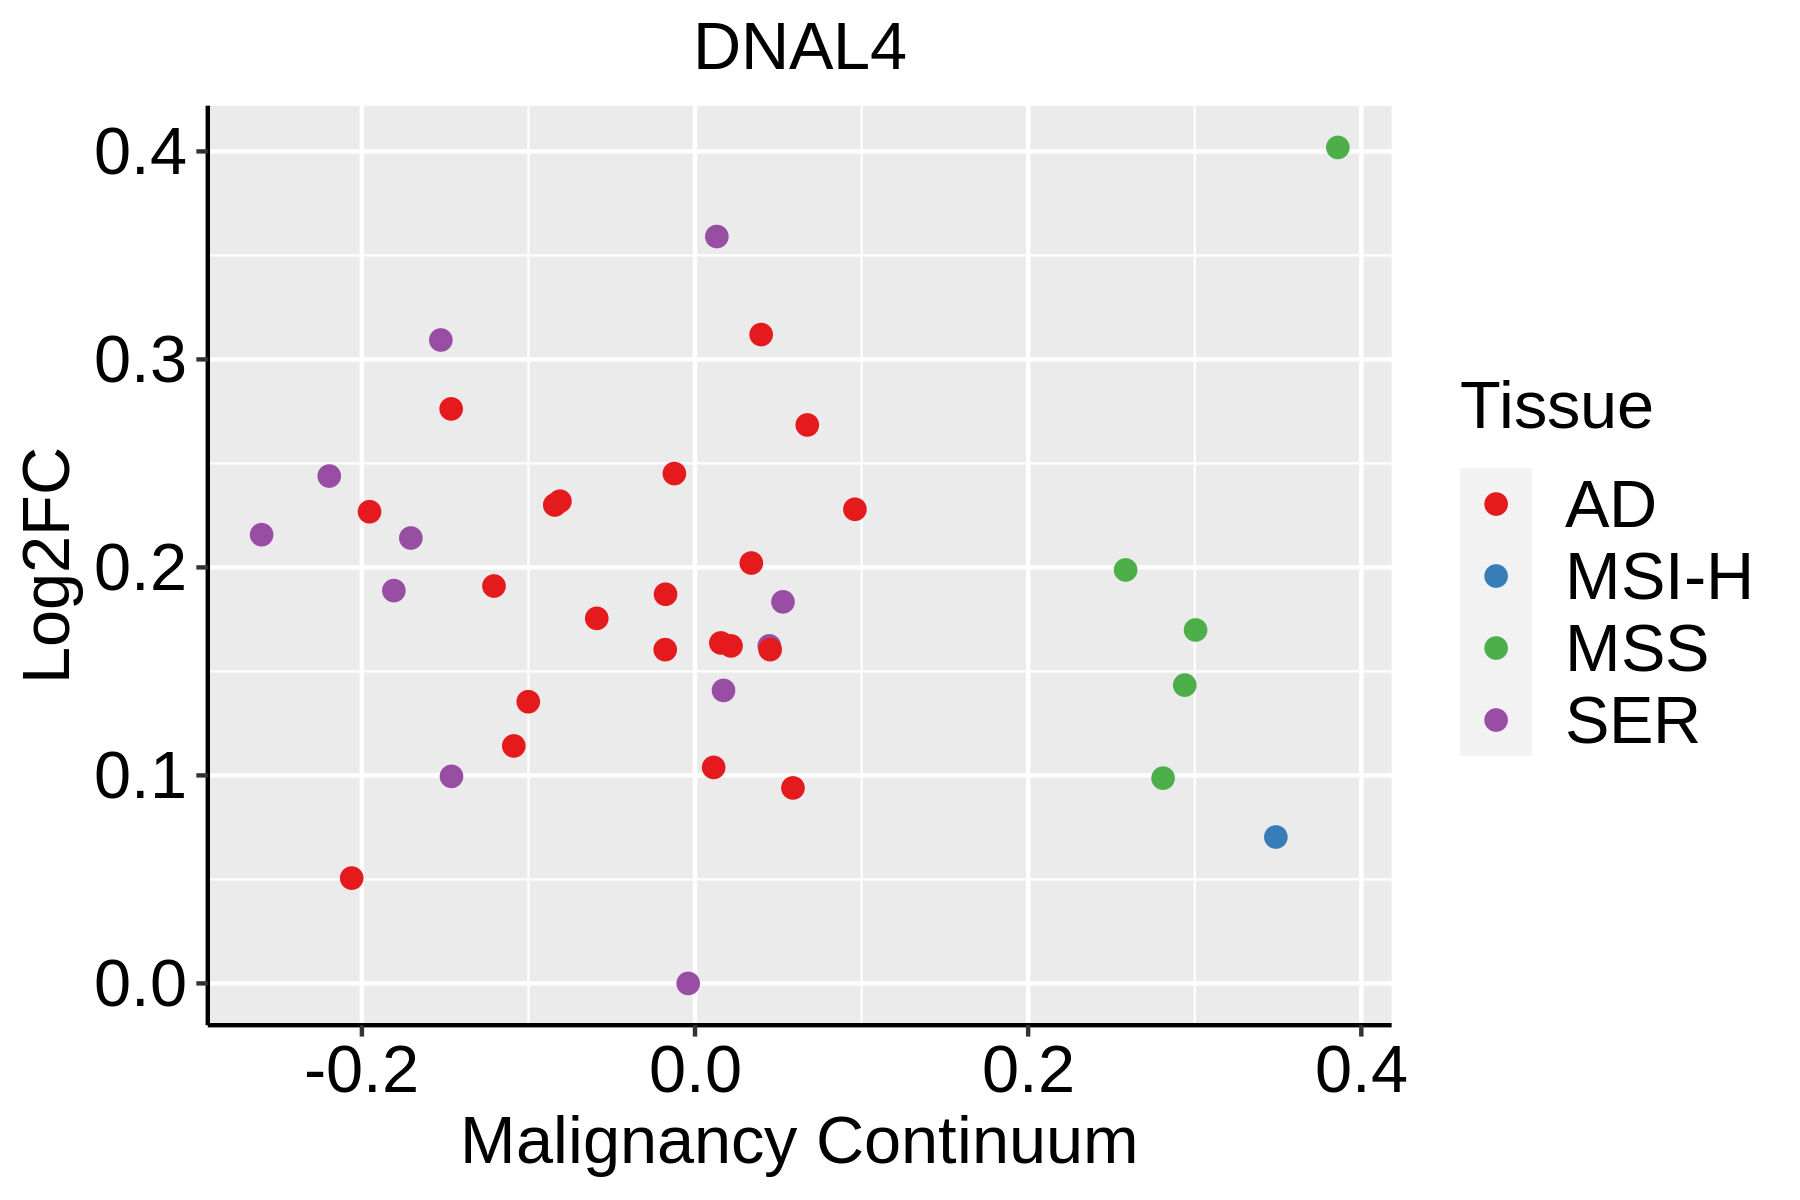 | AD: Adenomas |
| SER: Sessile serrated lesions | ||
| MSI-H: Microsatellite-high colorectal cancer | ||
| MSS: Microsatellite stable colorectal cancer | ||
| Esophagus | 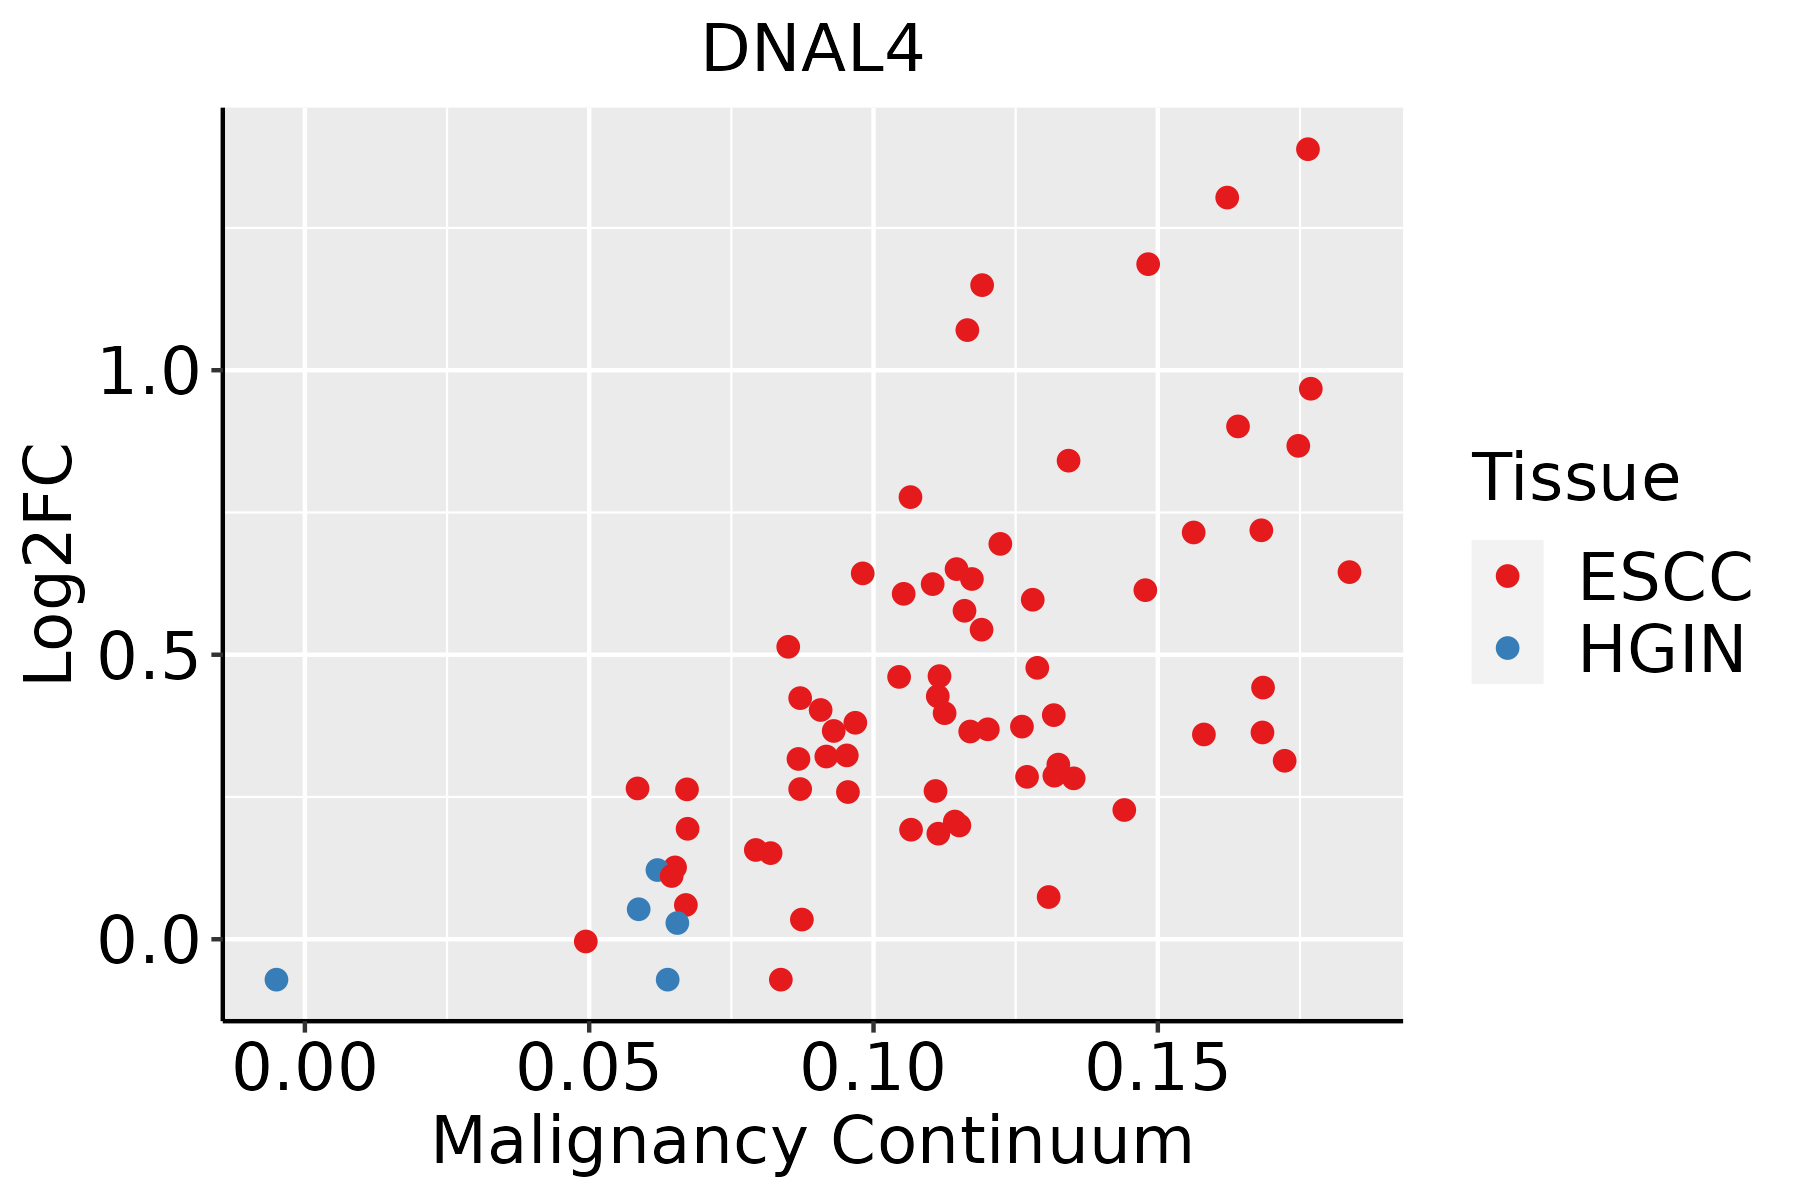 | ESCC: Esophageal squamous cell carcinoma |
| HGIN: High-grade intraepithelial neoplasias | ||
| LGIN: Low-grade intraepithelial neoplasias | ||
| Liver |  | HCC: Hepatocellular carcinoma |
| NAFLD: Non-alcoholic fatty liver disease | ||
| Oral Cavity | 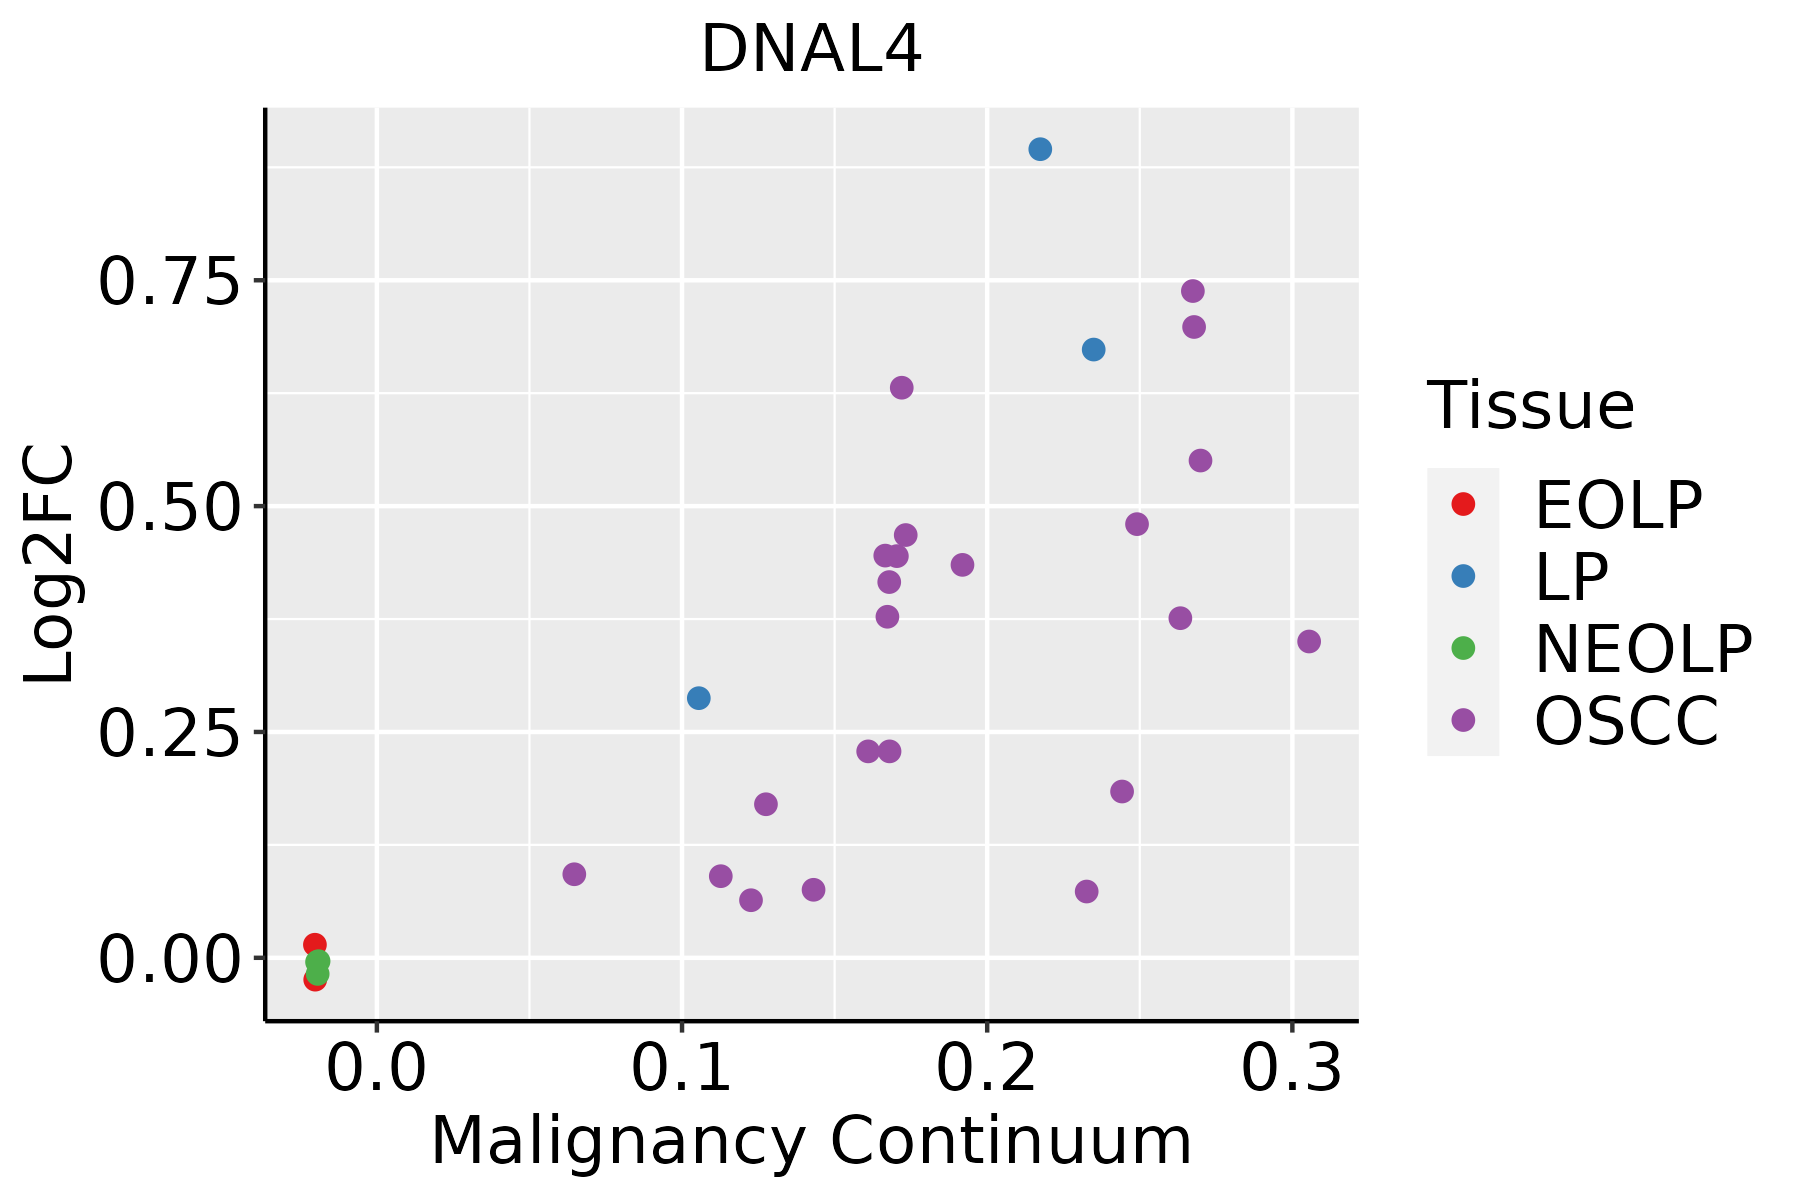 | EOLP: Erosive Oral lichen planus |
| LP: leukoplakia | ||
| NEOLP: Non-erosive oral lichen planus | ||
| OSCC: Oral squamous cell carcinoma |
| ∗log2FC in expression of this searched gene in stem-like cells from each diseased tissue sample relative to stem-like cells in normal samples in each tissue plotted against the malignancy continuum. Samples are colored based on if they are from different disease stage. |
Top |
Malignant transformation related pathway analysis |
| Find out the enriched GO biological processes and KEGG pathways involved in transition from healthy to precancer to cancer |
| Tissue | Disease Stage | Enriched GO biological Processes |
| Colorectum | AD |  |
| Colorectum | SER |  |
| Colorectum | MSS |  |
| Colorectum | MSI-H |  |
| Colorectum | FAP |  |
| ∗Top 15 enriched GO BP terms are showed in the bar plot of each disease state in each tissue. Each row represents a significant GO biological process which is colored according to the -log10(p.adjust). |
| Page: 1 2 3 4 5 6 7 8 9 |
| GO ID | Tissue | Disease Stage | Description | Gene Ratio | Bg Ratio | pvalue | p.adjust | Count |
| Page: 1 |
| Pathway ID | Tissue | Disease Stage | Description | Gene Ratio | Bg Ratio | pvalue | p.adjust | qvalue | Count |
| hsa05016 | Colorectum | AD | Huntington disease | 147/2092 | 306/8465 | 1.93e-19 | 9.26e-18 | 5.91e-18 | 147 |
| hsa05014 | Colorectum | AD | Amyotrophic lateral sclerosis | 164/2092 | 364/8465 | 4.28e-18 | 1.27e-16 | 8.09e-17 | 164 |
| hsa05022 | Colorectum | AD | Pathways of neurodegeneration - multiple diseases | 201/2092 | 476/8465 | 4.54e-18 | 1.27e-16 | 8.09e-17 | 201 |
| hsa050161 | Colorectum | AD | Huntington disease | 147/2092 | 306/8465 | 1.93e-19 | 9.26e-18 | 5.91e-18 | 147 |
| hsa050141 | Colorectum | AD | Amyotrophic lateral sclerosis | 164/2092 | 364/8465 | 4.28e-18 | 1.27e-16 | 8.09e-17 | 164 |
| hsa050221 | Colorectum | AD | Pathways of neurodegeneration - multiple diseases | 201/2092 | 476/8465 | 4.54e-18 | 1.27e-16 | 8.09e-17 | 201 |
| hsa050162 | Colorectum | SER | Huntington disease | 127/1580 | 306/8465 | 3.29e-21 | 1.37e-19 | 9.92e-20 | 127 |
| hsa050222 | Colorectum | SER | Pathways of neurodegeneration - multiple diseases | 168/1580 | 476/8465 | 6.23e-19 | 2.07e-17 | 1.50e-17 | 168 |
| hsa050142 | Colorectum | SER | Amyotrophic lateral sclerosis | 138/1580 | 364/8465 | 9.89e-19 | 2.99e-17 | 2.17e-17 | 138 |
| hsa050163 | Colorectum | SER | Huntington disease | 127/1580 | 306/8465 | 3.29e-21 | 1.37e-19 | 9.92e-20 | 127 |
| hsa050223 | Colorectum | SER | Pathways of neurodegeneration - multiple diseases | 168/1580 | 476/8465 | 6.23e-19 | 2.07e-17 | 1.50e-17 | 168 |
| hsa050143 | Colorectum | SER | Amyotrophic lateral sclerosis | 138/1580 | 364/8465 | 9.89e-19 | 2.99e-17 | 2.17e-17 | 138 |
| hsa050164 | Colorectum | MSS | Huntington disease | 141/1875 | 306/8465 | 2.90e-21 | 1.62e-19 | 9.92e-20 | 141 |
| hsa050224 | Colorectum | MSS | Pathways of neurodegeneration - multiple diseases | 192/1875 | 476/8465 | 2.79e-20 | 1.04e-18 | 6.36e-19 | 192 |
| hsa050144 | Colorectum | MSS | Amyotrophic lateral sclerosis | 156/1875 | 364/8465 | 1.43e-19 | 4.62e-18 | 2.83e-18 | 156 |
| hsa050165 | Colorectum | MSS | Huntington disease | 141/1875 | 306/8465 | 2.90e-21 | 1.62e-19 | 9.92e-20 | 141 |
| hsa050225 | Colorectum | MSS | Pathways of neurodegeneration - multiple diseases | 192/1875 | 476/8465 | 2.79e-20 | 1.04e-18 | 6.36e-19 | 192 |
| hsa050145 | Colorectum | MSS | Amyotrophic lateral sclerosis | 156/1875 | 364/8465 | 1.43e-19 | 4.62e-18 | 2.83e-18 | 156 |
| hsa05014210 | Esophagus | ESCC | Amyotrophic lateral sclerosis | 266/4205 | 364/8465 | 1.31e-20 | 2.20e-18 | 1.13e-18 | 266 |
| hsa05016210 | Esophagus | ESCC | Huntington disease | 226/4205 | 306/8465 | 1.38e-18 | 8.72e-17 | 4.46e-17 | 226 |
| Page: 1 2 3 |
Top |
Cell-cell communication analysis |
| Identification of potential cell-cell interactions between two cell types and their ligand-receptor pairs for different disease states |
| Ligand | Receptor | LRpair | Pathway | Tissue | Disease Stage |
| Page: 1 |
Top |
Single-cell gene regulatory network inference analysis |
| Find out the significant the regulons (TFs) and the target genes of each regulon across cell types for different disease states |
| TF | Cell Type | Tissue | Disease Stage | Target Gene | RSS | Regulon Activity |
| ∗The dot plots of a searched regulon are shown for all cell subpopulations in each disease state of each tissue based on the regulon specific score inferred using pySCENIC and by calculating the average expression. |
| Page: 1 |
Top |
Somatic mutation of malignant transformation related genes |
| Annotation of somatic variants for genes involved in malignant transformation |
| Hugo Symbol | Variant Class | Variant Classification | dbSNP RS | HGVSc | HGVSp | HGVSp Short | SWISSPROT | BIOTYPE | SIFT | PolyPhen | Tumor Sample Barcode | Tissue | Histology | Sex | Age | Stage | Therapy Types | Drugs | Outcome |
| DNAL4 | SNV | Missense_Mutation | c.171N>G | p.Ile57Met | p.I57M | O96015 | protein_coding | deleterious(0) | probably_damaging(0.983) | TCGA-IR-A3LI-01 | Cervix | cervical & endocervical cancer | Female | <65 | I/II | Chemotherapy | cisplatin | CR | |
| DNAL4 | SNV | Missense_Mutation | rs369970815 | c.94N>T | p.Arg32Cys | p.R32C | O96015 | protein_coding | tolerated(0.1) | possibly_damaging(0.893) | TCGA-D5-6540-01 | Colorectum | colon adenocarcinoma | Male | >=65 | I/II | Unknown | Unknown | SD |
| DNAL4 | SNV | Missense_Mutation | rs369007384 | c.211N>A | p.Val71Met | p.V71M | O96015 | protein_coding | deleterious(0.01) | probably_damaging(0.973) | TCGA-QG-A5Z2-01 | Colorectum | colon adenocarcinoma | Male | <65 | I/II | Unknown | Unknown | SD |
| DNAL4 | SNV | Missense_Mutation | c.52N>G | p.Thr18Ala | p.T18A | O96015 | protein_coding | tolerated(0.05) | benign(0.047) | TCGA-WS-AB45-01 | Colorectum | colon adenocarcinoma | Female | <65 | I/II | Unknown | Unknown | SD | |
| DNAL4 | SNV | Missense_Mutation | rs369970815 | c.94N>T | p.Arg32Cys | p.R32C | O96015 | protein_coding | tolerated(0.1) | possibly_damaging(0.893) | TCGA-F5-6814-01 | Colorectum | rectum adenocarcinoma | Male | <65 | I/II | Unknown | Unknown | SD |
| DNAL4 | SNV | Missense_Mutation | rs369970815 | c.94N>T | p.Arg32Cys | p.R32C | O96015 | protein_coding | tolerated(0.1) | possibly_damaging(0.893) | TCGA-EO-A22T-01 | Endometrium | uterine corpus endometrioid carcinoma | Female | <65 | I/II | Unknown | Unknown | SD |
| DNAL4 | SNV | Missense_Mutation | novel | c.132N>T | p.Glu44Asp | p.E44D | O96015 | protein_coding | tolerated(0.07) | probably_damaging(1) | TCGA-EO-A22X-01 | Endometrium | uterine corpus endometrioid carcinoma | Female | <65 | III/IV | Unspecific | Carboplatin | Complete Response |
| DNAL4 | SNV | Missense_Mutation | novel | c.101N>C | p.Glu34Ala | p.E34A | O96015 | protein_coding | deleterious(0) | probably_damaging(0.999) | TCGA-95-7567-01 | Lung | lung adenocarcinoma | Male | <65 | I/II | Chemotherapy | cisplatin | SD |
| DNAL4 | SNV | Missense_Mutation | novel | c.25N>T | p.Asp9Tyr | p.D9Y | O96015 | protein_coding | deleterious(0.01) | benign(0.021) | TCGA-85-A512-01 | Lung | lung squamous cell carcinoma | Male | <65 | I/II | Chemotherapy | etoposide | CR |
| Page: 1 |
Top |
Related drugs of malignant transformation related genes |
| Identification of chemicals and drugs interact with genes involved in malignant transfromation |
| (DGIdb 4.0) |
| Entrez ID | Symbol | Category | Interaction Types | Drug Claim Name | Drug Name | PMIDs |
| Page: 1 |

Copyright 2023-Present -The University of Texas Health Science Center at Houston |