
|
|||||
|
 | |
| |
| |
| |
| |
| |
|
Gene: DNAL1 |
Gene summary for DNAL1 |
| Gene information | Species | Human | Gene symbol | DNAL1 | Gene ID | 83544 |
| Gene name | dynein axonemal light chain 1 | |
| Gene Alias | C14orf168 | |
| Cytomap | 14q24.3 | |
| Gene Type | protein-coding | GO ID | GO:0000226 | UniProtAcc | Q4LDG9 |
Top |
Malignant transformation analysis |
| Identification of the aberrant gene expression in precancerous and cancerous lesions by comparing the gene expression of stem-like cells in diseased tissues with normal stem cells |
| Entrez ID | Symbol | Replicates | Species | Organ | Tissue | Adj P-value | Log2FC | Malignancy |
| 83544 | DNAL1 | LZE24T | Human | Esophagus | ESCC | 8.79e-08 | 2.65e-01 | 0.0596 |
| 83544 | DNAL1 | P2T-E | Human | Esophagus | ESCC | 1.66e-11 | 2.32e-01 | 0.1177 |
| 83544 | DNAL1 | P4T-E | Human | Esophagus | ESCC | 1.58e-16 | 3.78e-01 | 0.1323 |
| 83544 | DNAL1 | P5T-E | Human | Esophagus | ESCC | 1.66e-04 | 1.23e-01 | 0.1327 |
| 83544 | DNAL1 | P8T-E | Human | Esophagus | ESCC | 7.65e-10 | 2.20e-01 | 0.0889 |
| 83544 | DNAL1 | P10T-E | Human | Esophagus | ESCC | 4.18e-12 | 2.15e-01 | 0.116 |
| 83544 | DNAL1 | P11T-E | Human | Esophagus | ESCC | 1.46e-10 | 4.07e-01 | 0.1426 |
| 83544 | DNAL1 | P12T-E | Human | Esophagus | ESCC | 2.09e-05 | 1.94e-01 | 0.1122 |
| 83544 | DNAL1 | P15T-E | Human | Esophagus | ESCC | 4.64e-17 | 3.75e-01 | 0.1149 |
| 83544 | DNAL1 | P16T-E | Human | Esophagus | ESCC | 6.41e-06 | 1.74e-01 | 0.1153 |
| 83544 | DNAL1 | P17T-E | Human | Esophagus | ESCC | 4.67e-04 | 2.49e-01 | 0.1278 |
| 83544 | DNAL1 | P19T-E | Human | Esophagus | ESCC | 1.04e-05 | 3.55e-01 | 0.1662 |
| 83544 | DNAL1 | P20T-E | Human | Esophagus | ESCC | 4.77e-04 | 1.51e-01 | 0.1124 |
| 83544 | DNAL1 | P21T-E | Human | Esophagus | ESCC | 2.21e-09 | 1.82e-01 | 0.1617 |
| 83544 | DNAL1 | P22T-E | Human | Esophagus | ESCC | 2.42e-10 | 2.25e-01 | 0.1236 |
| 83544 | DNAL1 | P23T-E | Human | Esophagus | ESCC | 1.16e-06 | 1.65e-01 | 0.108 |
| 83544 | DNAL1 | P24T-E | Human | Esophagus | ESCC | 5.18e-05 | 1.52e-01 | 0.1287 |
| 83544 | DNAL1 | P26T-E | Human | Esophagus | ESCC | 3.42e-09 | 1.52e-01 | 0.1276 |
| 83544 | DNAL1 | P27T-E | Human | Esophagus | ESCC | 1.99e-10 | 2.94e-01 | 0.1055 |
| 83544 | DNAL1 | P28T-E | Human | Esophagus | ESCC | 3.60e-05 | 1.16e-01 | 0.1149 |
| Page: 1 2 3 4 |
| Tissue | Expression Dynamics | Abbreviation |
| Esophagus |  | ESCC: Esophageal squamous cell carcinoma |
| HGIN: High-grade intraepithelial neoplasias | ||
| LGIN: Low-grade intraepithelial neoplasias | ||
| Liver | 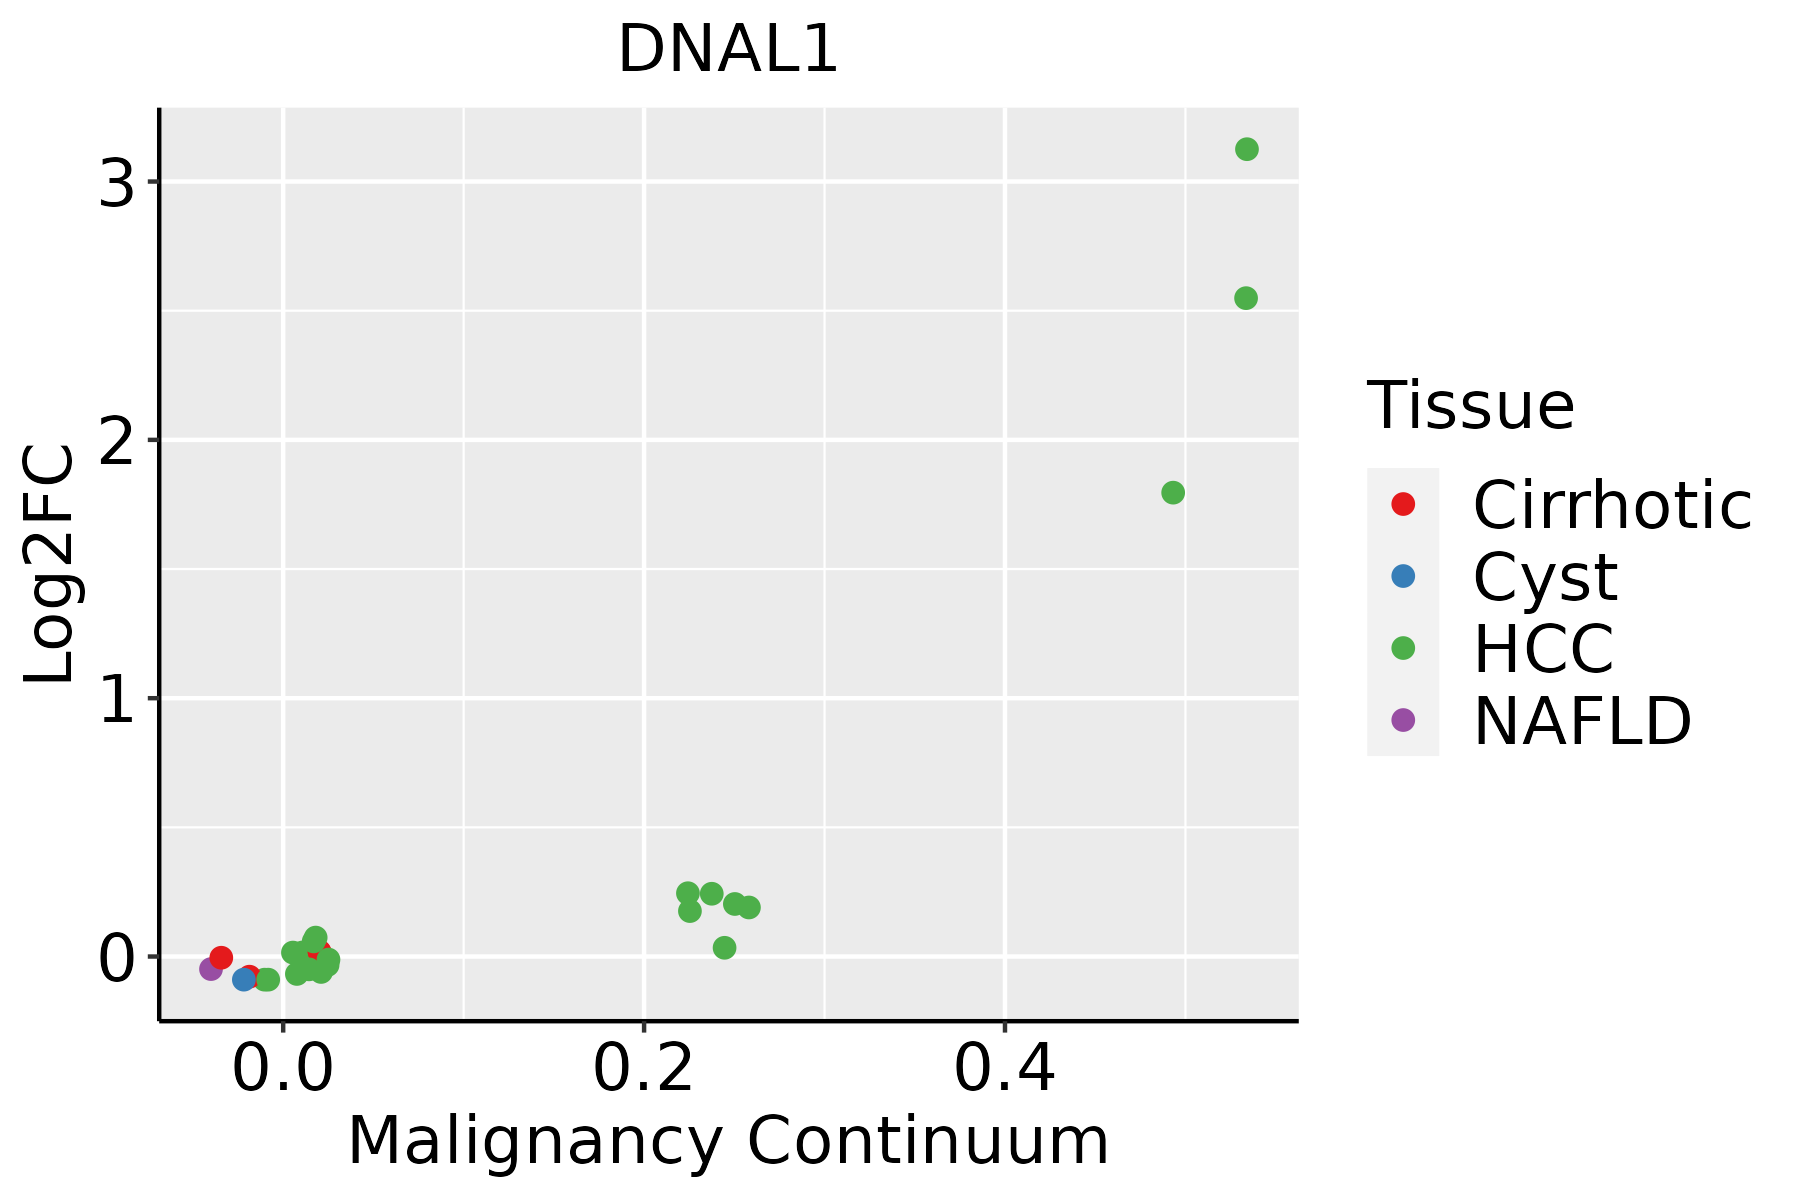 | HCC: Hepatocellular carcinoma |
| NAFLD: Non-alcoholic fatty liver disease | ||
| Oral Cavity |  | EOLP: Erosive Oral lichen planus |
| LP: leukoplakia | ||
| NEOLP: Non-erosive oral lichen planus | ||
| OSCC: Oral squamous cell carcinoma |
| ∗log2FC in expression of this searched gene in stem-like cells from each diseased tissue sample relative to stem-like cells in normal samples in each tissue plotted against the malignancy continuum. Samples are colored based on if they are from different disease stage. |
Top |
Malignant transformation related pathway analysis |
| Find out the enriched GO biological processes and KEGG pathways involved in transition from healthy to precancer to cancer |
| Tissue | Disease Stage | Enriched GO biological Processes |
| Colorectum | AD |  |
| Colorectum | SER |  |
| Colorectum | MSS |  |
| Colorectum | MSI-H |  |
| Colorectum | FAP |  |
| ∗Top 15 enriched GO BP terms are showed in the bar plot of each disease state in each tissue. Each row represents a significant GO biological process which is colored according to the -log10(p.adjust). |
| Page: 1 2 3 4 5 6 7 8 9 |
| GO ID | Tissue | Disease Stage | Description | Gene Ratio | Bg Ratio | pvalue | p.adjust | Count |
| Page: 1 |
| Pathway ID | Tissue | Disease Stage | Description | Gene Ratio | Bg Ratio | pvalue | p.adjust | qvalue | Count |
| hsa05014210 | Esophagus | ESCC | Amyotrophic lateral sclerosis | 266/4205 | 364/8465 | 1.31e-20 | 2.20e-18 | 1.13e-18 | 266 |
| hsa05016210 | Esophagus | ESCC | Huntington disease | 226/4205 | 306/8465 | 1.38e-18 | 8.72e-17 | 4.46e-17 | 226 |
| hsa05022210 | Esophagus | ESCC | Pathways of neurodegeneration - multiple diseases | 318/4205 | 476/8465 | 6.10e-15 | 2.04e-13 | 1.05e-13 | 318 |
| hsa0501438 | Esophagus | ESCC | Amyotrophic lateral sclerosis | 266/4205 | 364/8465 | 1.31e-20 | 2.20e-18 | 1.13e-18 | 266 |
| hsa0501638 | Esophagus | ESCC | Huntington disease | 226/4205 | 306/8465 | 1.38e-18 | 8.72e-17 | 4.46e-17 | 226 |
| hsa0502238 | Esophagus | ESCC | Pathways of neurodegeneration - multiple diseases | 318/4205 | 476/8465 | 6.10e-15 | 2.04e-13 | 1.05e-13 | 318 |
| hsa0501622 | Liver | HCC | Huntington disease | 219/4020 | 306/8465 | 3.06e-18 | 3.42e-16 | 1.90e-16 | 219 |
| hsa0501422 | Liver | HCC | Amyotrophic lateral sclerosis | 252/4020 | 364/8465 | 8.85e-18 | 7.41e-16 | 4.12e-16 | 252 |
| hsa0502222 | Liver | HCC | Pathways of neurodegeneration - multiple diseases | 298/4020 | 476/8465 | 6.59e-12 | 1.30e-10 | 7.22e-11 | 298 |
| hsa0501632 | Liver | HCC | Huntington disease | 219/4020 | 306/8465 | 3.06e-18 | 3.42e-16 | 1.90e-16 | 219 |
| hsa0501432 | Liver | HCC | Amyotrophic lateral sclerosis | 252/4020 | 364/8465 | 8.85e-18 | 7.41e-16 | 4.12e-16 | 252 |
| hsa0502232 | Liver | HCC | Pathways of neurodegeneration - multiple diseases | 298/4020 | 476/8465 | 6.59e-12 | 1.30e-10 | 7.22e-11 | 298 |
| hsa0501428 | Oral cavity | OSCC | Amyotrophic lateral sclerosis | 246/3704 | 364/8465 | 6.65e-21 | 1.11e-18 | 5.67e-19 | 246 |
| hsa0501628 | Oral cavity | OSCC | Huntington disease | 204/3704 | 306/8465 | 1.70e-16 | 7.13e-15 | 3.63e-15 | 204 |
| hsa0502228 | Oral cavity | OSCC | Pathways of neurodegeneration - multiple diseases | 292/3704 | 476/8465 | 1.60e-15 | 4.47e-14 | 2.28e-14 | 292 |
| hsa05014112 | Oral cavity | OSCC | Amyotrophic lateral sclerosis | 246/3704 | 364/8465 | 6.65e-21 | 1.11e-18 | 5.67e-19 | 246 |
| hsa05016112 | Oral cavity | OSCC | Huntington disease | 204/3704 | 306/8465 | 1.70e-16 | 7.13e-15 | 3.63e-15 | 204 |
| hsa05022112 | Oral cavity | OSCC | Pathways of neurodegeneration - multiple diseases | 292/3704 | 476/8465 | 1.60e-15 | 4.47e-14 | 2.28e-14 | 292 |
| Page: 1 |
Top |
Cell-cell communication analysis |
| Identification of potential cell-cell interactions between two cell types and their ligand-receptor pairs for different disease states |
| Ligand | Receptor | LRpair | Pathway | Tissue | Disease Stage |
| Page: 1 |
Top |
Single-cell gene regulatory network inference analysis |
| Find out the significant the regulons (TFs) and the target genes of each regulon across cell types for different disease states |
| TF | Cell Type | Tissue | Disease Stage | Target Gene | RSS | Regulon Activity |
| ∗The dot plots of a searched regulon are shown for all cell subpopulations in each disease state of each tissue based on the regulon specific score inferred using pySCENIC and by calculating the average expression. |
| Page: 1 |
Top |
Somatic mutation of malignant transformation related genes |
| Annotation of somatic variants for genes involved in malignant transformation |
| Hugo Symbol | Variant Class | Variant Classification | dbSNP RS | HGVSc | HGVSp | HGVSp Short | SWISSPROT | BIOTYPE | SIFT | PolyPhen | Tumor Sample Barcode | Tissue | Histology | Sex | Age | Stage | Therapy Types | Drugs | Outcome |
| DNAL1 | SNV | Missense_Mutation | c.226N>G | p.Ser76Ala | p.S76A | Q4LDG9 | protein_coding | deleterious(0.03) | possibly_damaging(0.576) | TCGA-AC-A23H-01 | Breast | breast invasive carcinoma | Female | >=65 | I/II | Unknown | Unknown | PD | |
| DNAL1 | SNV | Missense_Mutation | c.86N>C | p.Lys29Thr | p.K29T | Q4LDG9 | protein_coding | tolerated(0.32) | benign(0.355) | TCGA-C8-A134-01 | Breast | breast invasive carcinoma | Female | <65 | I/II | Chemotherapy | 5-fluorouracil | CR | |
| DNAL1 | SNV | Missense_Mutation | rs387907021 | c.449A>G | p.Asn150Ser | p.N150S | Q4LDG9 | protein_coding | deleterious(0) | probably_damaging(1) | TCGA-E9-A228-01 | Breast | breast invasive carcinoma | Female | <65 | I/II | Chemotherapy | doxorubicin | SD |
| DNAL1 | SNV | Missense_Mutation | c.218N>T | p.Arg73Met | p.R73M | Q4LDG9 | protein_coding | deleterious(0) | possibly_damaging(0.75) | TCGA-NH-A5IV-01 | Colorectum | colon adenocarcinoma | Female | >=65 | I/II | Unknown | Unknown | SD | |
| DNAL1 | SNV | Missense_Mutation | c.536N>A | p.Thr179Asn | p.T179N | Q4LDG9 | protein_coding | tolerated(0.48) | benign(0.005) | TCGA-EI-6509-01 | Colorectum | rectum adenocarcinoma | Male | <65 | III/IV | Chemotherapy | folfox | PD | |
| DNAL1 | SNV | Missense_Mutation | novel | c.512N>T | p.Pro171Leu | p.P171L | Q4LDG9 | protein_coding | deleterious(0.03) | possibly_damaging(0.493) | TCGA-AP-A1DV-01 | Endometrium | uterine corpus endometrioid carcinoma | Female | <65 | I/II | Unknown | Unknown | SD |
| DNAL1 | SNV | Missense_Mutation | c.249N>T | p.Lys83Asn | p.K83N | Q4LDG9 | protein_coding | deleterious(0) | possibly_damaging(0.788) | TCGA-AX-A0J0-01 | Endometrium | uterine corpus endometrioid carcinoma | Female | <65 | I/II | Unknown | Unknown | SD | |
| DNAL1 | SNV | Missense_Mutation | novel | c.64C>T | p.Pro22Ser | p.P22S | Q4LDG9 | protein_coding | tolerated(0.14) | benign(0.009) | TCGA-AX-A1CE-01 | Endometrium | uterine corpus endometrioid carcinoma | Female | <65 | I/II | Unspecific | Paclitaxel | SD |
| DNAL1 | SNV | Missense_Mutation | c.362A>G | p.Tyr121Cys | p.Y121C | Q4LDG9 | protein_coding | deleterious(0) | probably_damaging(0.954) | TCGA-B5-A0JY-01 | Endometrium | uterine corpus endometrioid carcinoma | Female | <65 | III/IV | Chemotherapy | doxorubicin | SD | |
| DNAL1 | SNV | Missense_Mutation | novel | c.227N>A | p.Ser76Tyr | p.S76Y | Q4LDG9 | protein_coding | deleterious(0) | probably_damaging(0.914) | TCGA-B5-A1MR-01 | Endometrium | uterine corpus endometrioid carcinoma | Female | >=65 | III/IV | Unknown | Unknown | SD |
| Page: 1 2 |
Top |
Related drugs of malignant transformation related genes |
| Identification of chemicals and drugs interact with genes involved in malignant transfromation |
| (DGIdb 4.0) |
| Entrez ID | Symbol | Category | Interaction Types | Drug Claim Name | Drug Name | PMIDs |
| Page: 1 |

Copyright 2023-Present -The University of Texas Health Science Center at Houston |