
|
|||||
|
 | |
| |
| |
| |
| |
| |
|
Gene: DNAJC9 |
Gene summary for DNAJC9 |
| Gene information | Species | Human | Gene symbol | DNAJC9 | Gene ID | 23234 |
| Gene name | DnaJ heat shock protein family (Hsp40) member C9 | |
| Gene Alias | HDJC9 | |
| Cytomap | 10q22.2 | |
| Gene Type | protein-coding | GO ID | GO:0006323 | UniProtAcc | A0A024QZN2 |
Top |
Malignant transformation analysis |
| Identification of the aberrant gene expression in precancerous and cancerous lesions by comparing the gene expression of stem-like cells in diseased tissues with normal stem cells |
| Entrez ID | Symbol | Replicates | Species | Organ | Tissue | Adj P-value | Log2FC | Malignancy |
| 23234 | DNAJC9 | LZE2T | Human | Esophagus | ESCC | 4.95e-03 | 3.58e-01 | 0.082 |
| 23234 | DNAJC9 | LZE4T | Human | Esophagus | ESCC | 1.18e-07 | 3.75e-01 | 0.0811 |
| 23234 | DNAJC9 | LZE7T | Human | Esophagus | ESCC | 5.04e-09 | 4.42e-01 | 0.0667 |
| 23234 | DNAJC9 | LZE8T | Human | Esophagus | ESCC | 7.11e-04 | 1.89e-01 | 0.067 |
| 23234 | DNAJC9 | LZE20T | Human | Esophagus | ESCC | 8.80e-03 | 1.43e-01 | 0.0662 |
| 23234 | DNAJC9 | LZE24T | Human | Esophagus | ESCC | 1.08e-22 | 7.21e-01 | 0.0596 |
| 23234 | DNAJC9 | LZE21T | Human | Esophagus | ESCC | 1.64e-02 | 3.82e-01 | 0.0655 |
| 23234 | DNAJC9 | LZE6T | Human | Esophagus | ESCC | 5.19e-05 | 4.34e-01 | 0.0845 |
| 23234 | DNAJC9 | P1T-E | Human | Esophagus | ESCC | 2.45e-07 | 2.58e-01 | 0.0875 |
| 23234 | DNAJC9 | P2T-E | Human | Esophagus | ESCC | 2.42e-43 | 1.05e+00 | 0.1177 |
| 23234 | DNAJC9 | P4T-E | Human | Esophagus | ESCC | 2.01e-27 | 8.93e-01 | 0.1323 |
| 23234 | DNAJC9 | P5T-E | Human | Esophagus | ESCC | 8.65e-30 | 7.83e-01 | 0.1327 |
| 23234 | DNAJC9 | P8T-E | Human | Esophagus | ESCC | 9.16e-13 | 3.36e-01 | 0.0889 |
| 23234 | DNAJC9 | P9T-E | Human | Esophagus | ESCC | 3.18e-15 | 3.61e-01 | 0.1131 |
| 23234 | DNAJC9 | P10T-E | Human | Esophagus | ESCC | 5.79e-19 | 3.97e-01 | 0.116 |
| 23234 | DNAJC9 | P11T-E | Human | Esophagus | ESCC | 1.10e-06 | 4.66e-01 | 0.1426 |
| 23234 | DNAJC9 | P12T-E | Human | Esophagus | ESCC | 3.10e-22 | 5.29e-01 | 0.1122 |
| 23234 | DNAJC9 | P15T-E | Human | Esophagus | ESCC | 2.84e-17 | 4.63e-01 | 0.1149 |
| 23234 | DNAJC9 | P16T-E | Human | Esophagus | ESCC | 8.10e-29 | 5.95e-01 | 0.1153 |
| 23234 | DNAJC9 | P17T-E | Human | Esophagus | ESCC | 3.36e-10 | 6.63e-01 | 0.1278 |
| Page: 1 2 3 4 5 6 |
| Tissue | Expression Dynamics | Abbreviation |
| Esophagus | 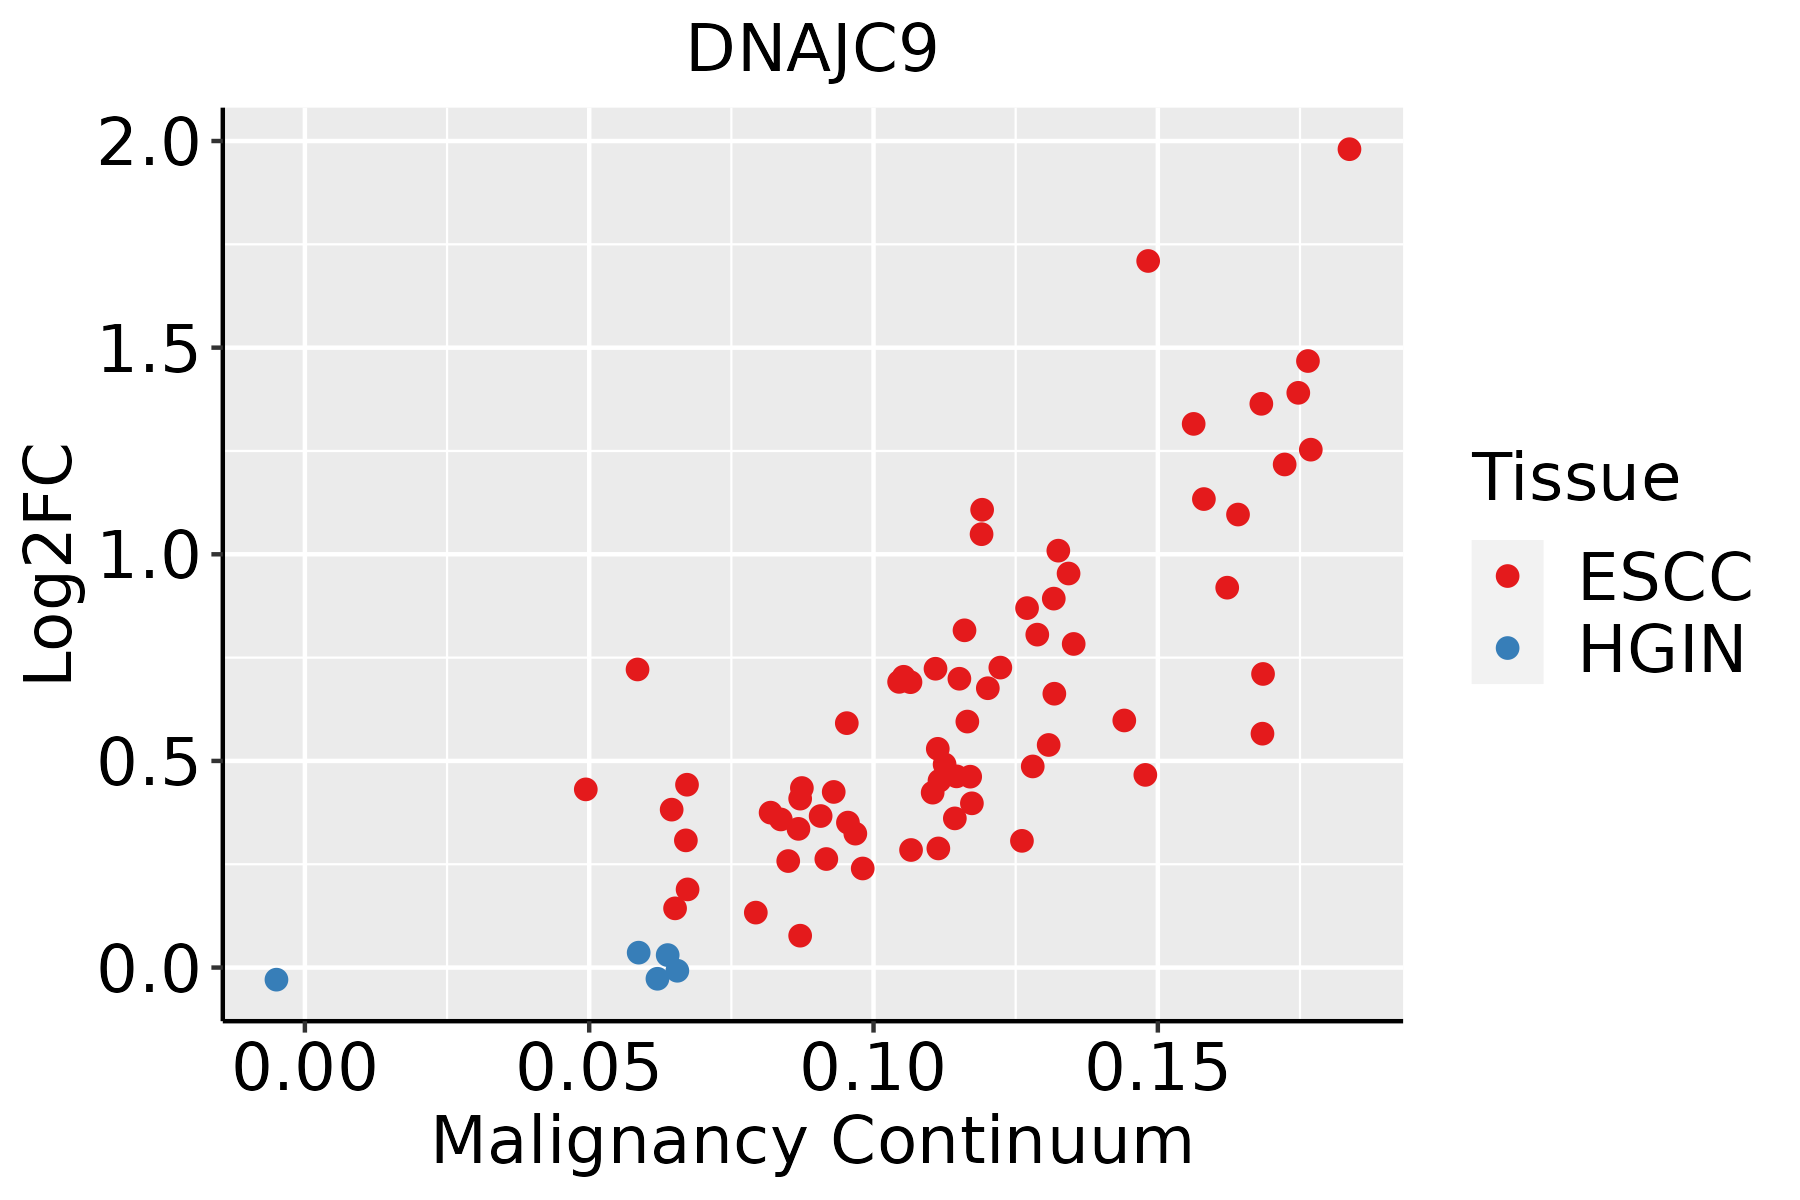 | ESCC: Esophageal squamous cell carcinoma |
| HGIN: High-grade intraepithelial neoplasias | ||
| LGIN: Low-grade intraepithelial neoplasias | ||
| Liver | 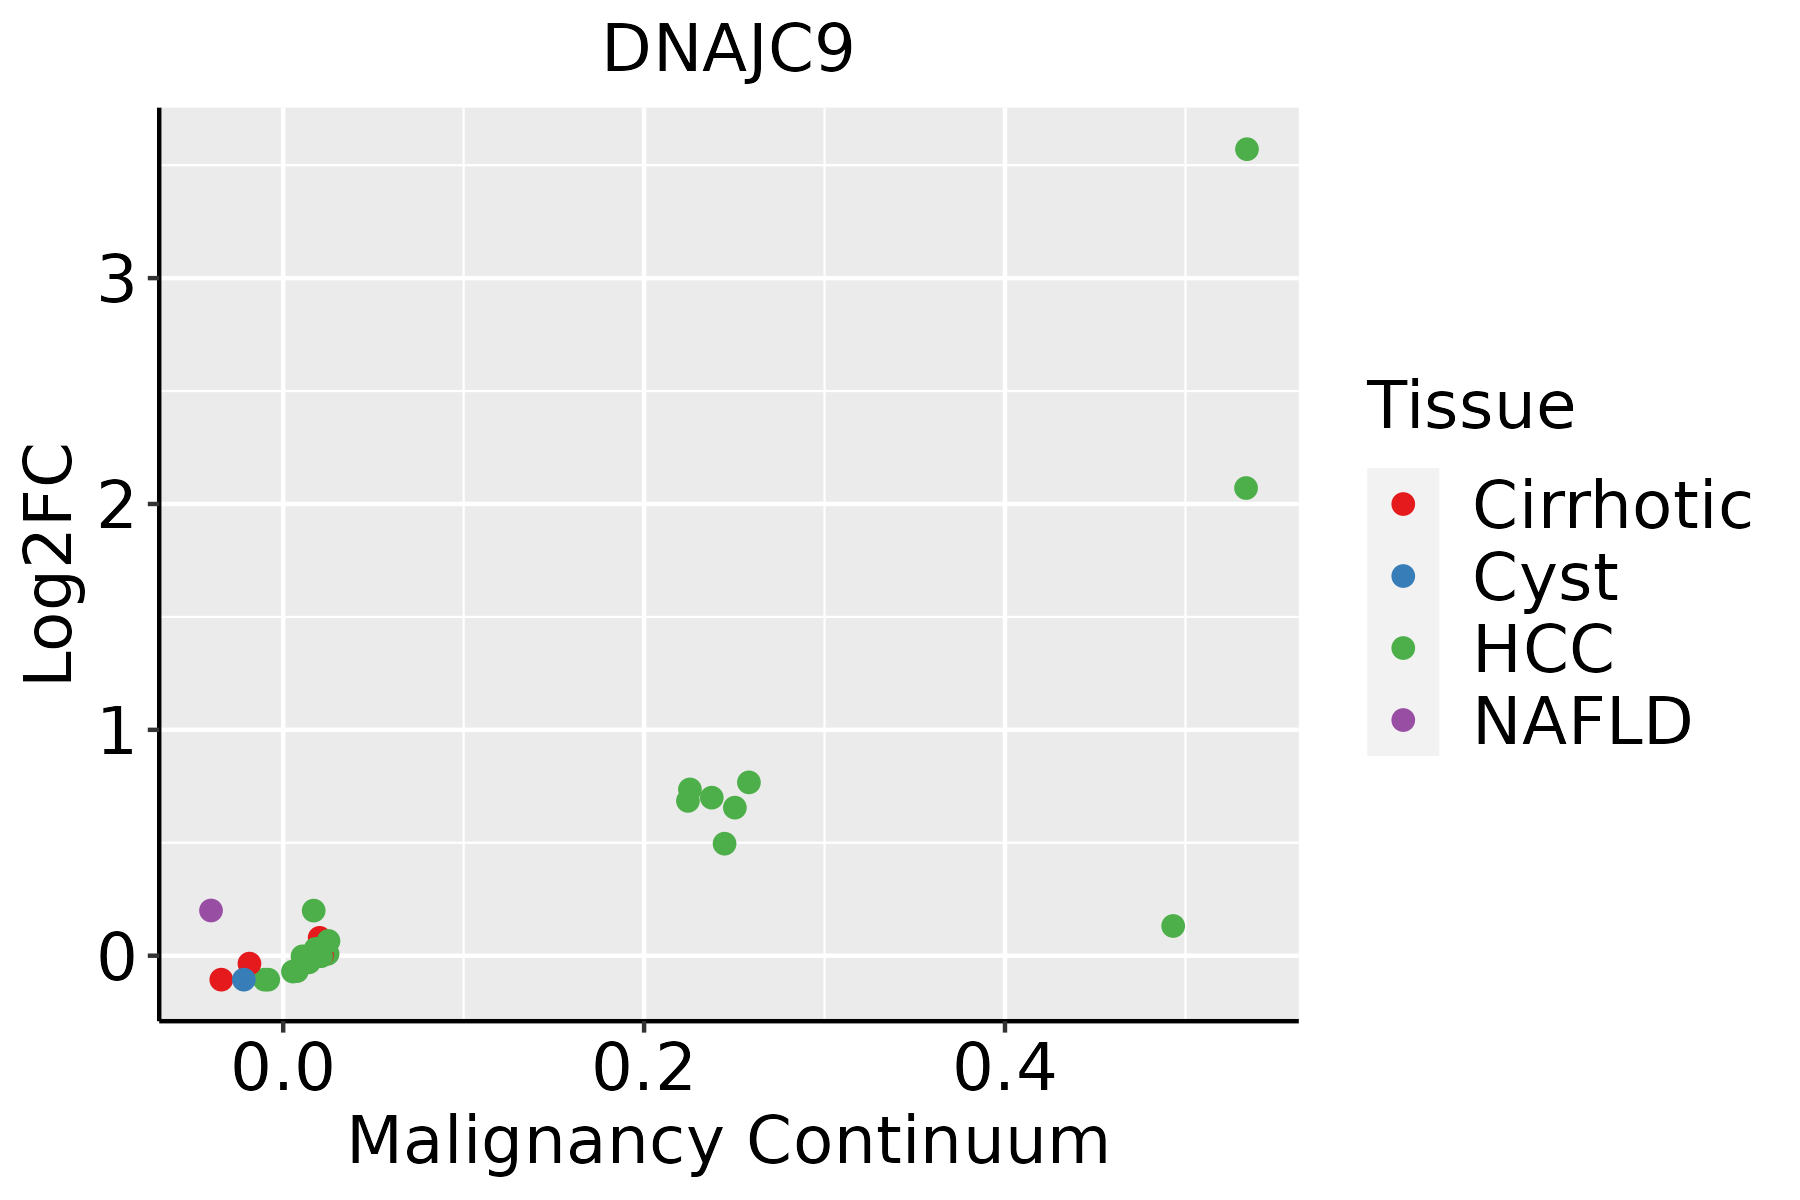 | HCC: Hepatocellular carcinoma |
| NAFLD: Non-alcoholic fatty liver disease | ||
| Oral Cavity | 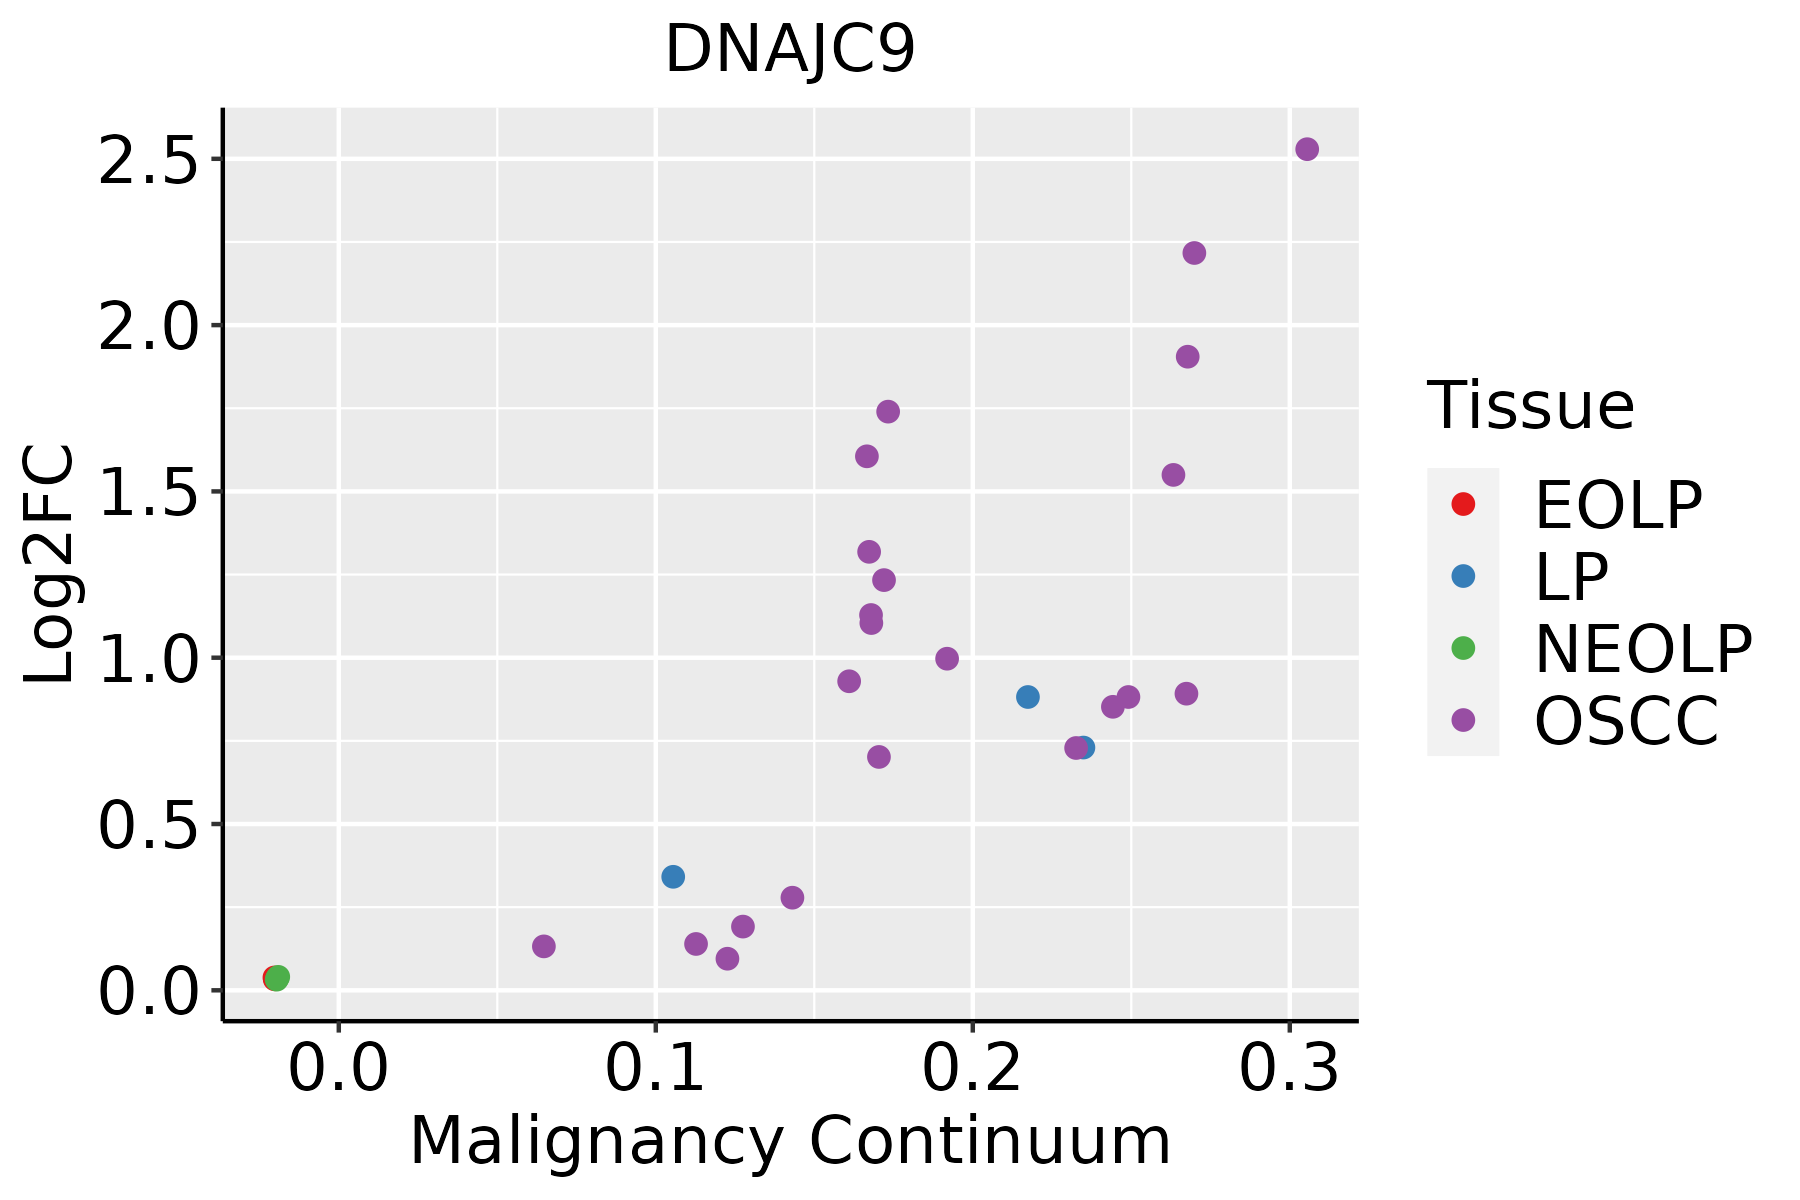 | EOLP: Erosive Oral lichen planus |
| LP: leukoplakia | ||
| NEOLP: Non-erosive oral lichen planus | ||
| OSCC: Oral squamous cell carcinoma | ||
| Skin | 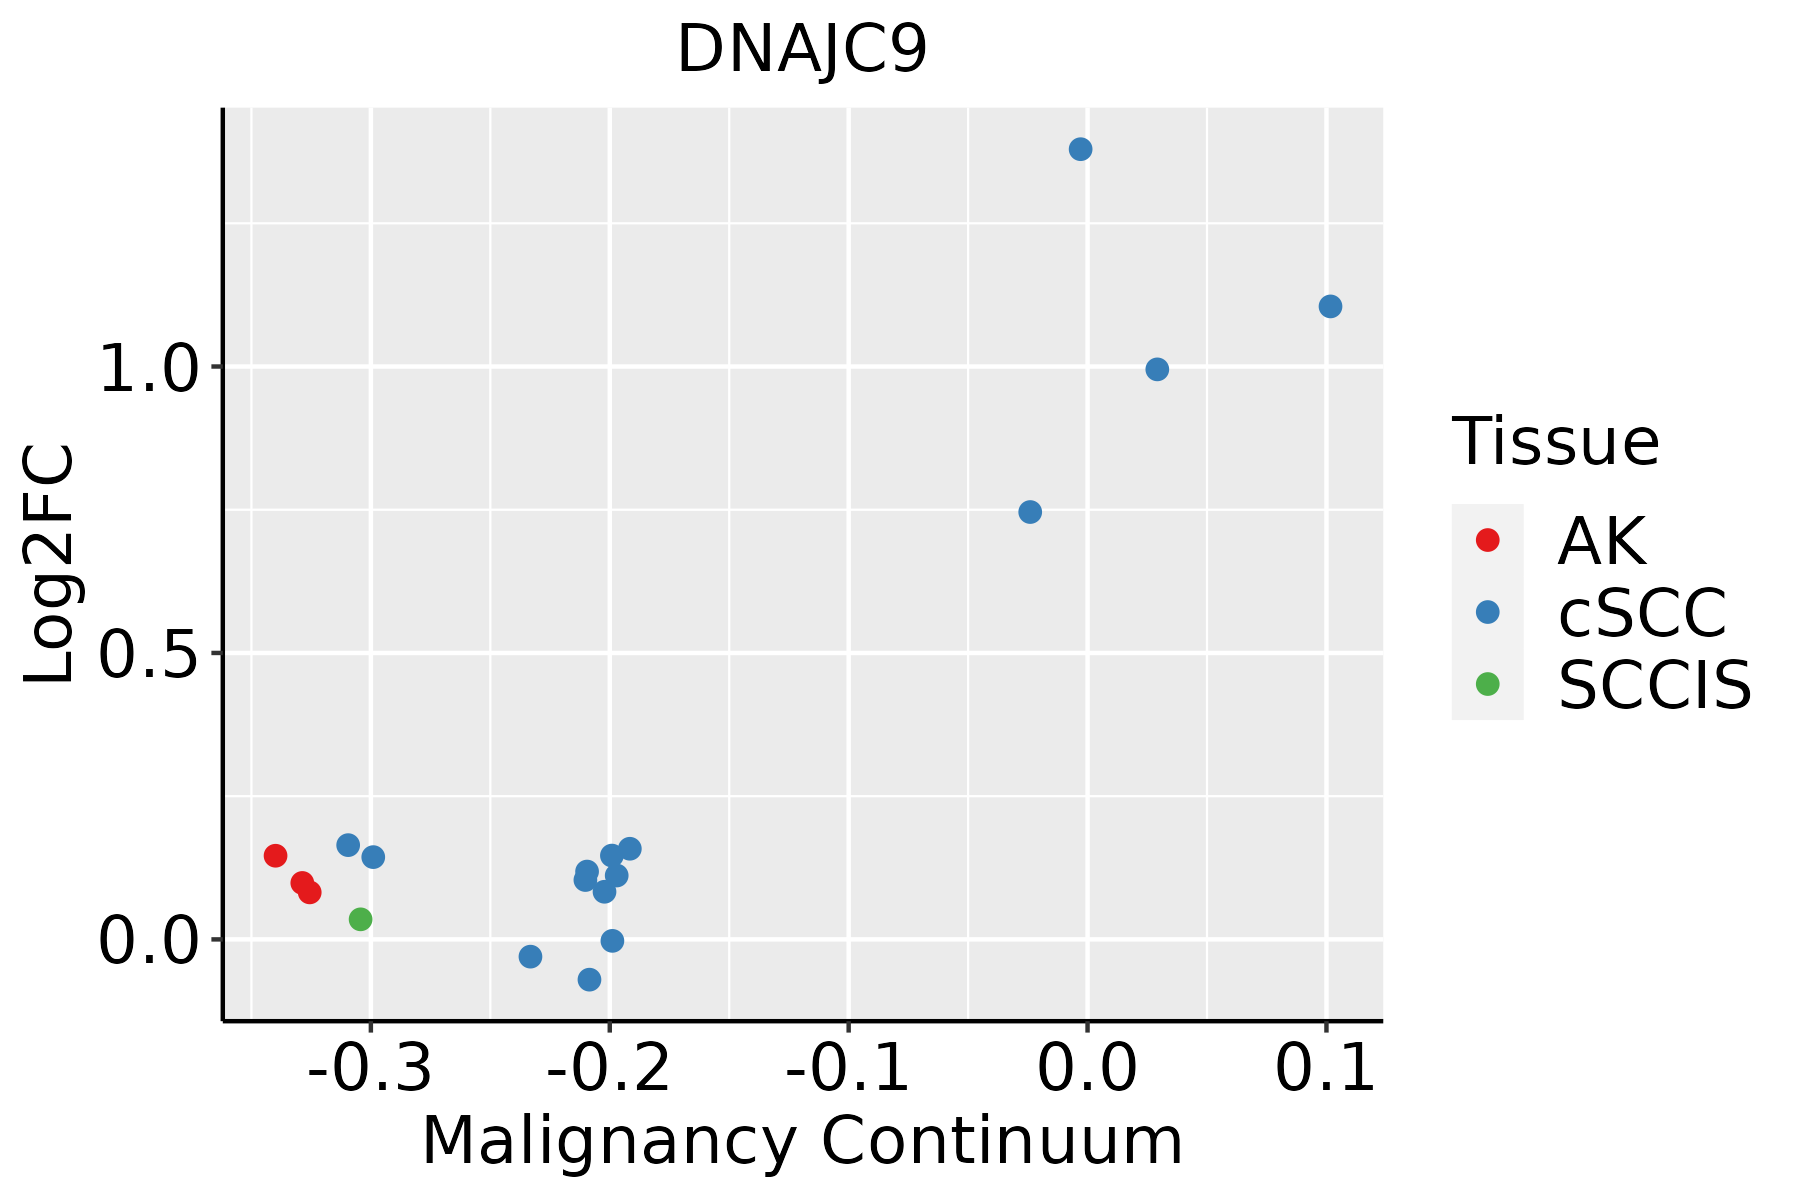 | AK: Actinic keratosis |
| cSCC: Cutaneous squamous cell carcinoma | ||
| SCCIS:squamous cell carcinoma in situ | ||
| Thyroid |  | ATC: Anaplastic thyroid cancer |
| HT: Hashimoto's thyroiditis | ||
| PTC: Papillary thyroid cancer |
| ∗log2FC in expression of this searched gene in stem-like cells from each diseased tissue sample relative to stem-like cells in normal samples in each tissue plotted against the malignancy continuum. Samples are colored based on if they are from different disease stage. |
Top |
Malignant transformation related pathway analysis |
| Find out the enriched GO biological processes and KEGG pathways involved in transition from healthy to precancer to cancer |
| Tissue | Disease Stage | Enriched GO biological Processes |
| Colorectum | AD |  |
| Colorectum | SER |  |
| Colorectum | MSS |  |
| Colorectum | MSI-H |  |
| Colorectum | FAP |  |
| ∗Top 15 enriched GO BP terms are showed in the bar plot of each disease state in each tissue. Each row represents a significant GO biological process which is colored according to the -log10(p.adjust). |
| Page: 1 2 3 4 5 6 7 8 9 |
| GO ID | Tissue | Disease Stage | Description | Gene Ratio | Bg Ratio | pvalue | p.adjust | Count |
| GO:000632517 | Esophagus | ESCC | chromatin organization | 240/8552 | 409/18723 | 6.52e-08 | 1.14e-06 | 240 |
| GO:00434627 | Esophagus | ESCC | regulation of ATPase activity | 30/8552 | 46/18723 | 5.91e-03 | 2.18e-02 | 30 |
| GO:000632511 | Liver | HCC | chromatin organization | 206/7958 | 409/18723 | 7.23e-04 | 4.41e-03 | 206 |
| GO:00327811 | Liver | HCC | positive regulation of ATPase activity | 19/7958 | 27/18723 | 3.18e-03 | 1.47e-02 | 19 |
| GO:004346211 | Liver | HCC | regulation of ATPase activity | 29/7958 | 46/18723 | 3.95e-03 | 1.74e-02 | 29 |
| GO:000632510 | Oral cavity | OSCC | chromatin organization | 190/7305 | 409/18723 | 1.17e-03 | 5.97e-03 | 190 |
| GO:00327815 | Oral cavity | OSCC | positive regulation of ATPase activity | 18/7305 | 27/18723 | 3.34e-03 | 1.42e-02 | 18 |
| GO:00434626 | Oral cavity | OSCC | regulation of ATPase activity | 27/7305 | 46/18723 | 5.33e-03 | 2.07e-02 | 27 |
| GO:003278113 | Oral cavity | LP | positive regulation of ATPase activity | 13/4623 | 27/18723 | 6.92e-03 | 3.96e-02 | 13 |
| GO:000632519 | Skin | cSCC | chromatin organization | 147/4864 | 409/18723 | 4.41e-06 | 6.52e-05 | 147 |
| GO:000633812 | Skin | cSCC | chromatin remodeling | 94/4864 | 255/18723 | 7.58e-05 | 7.26e-04 | 94 |
| GO:00718241 | Skin | cSCC | protein-DNA complex subunit organization | 87/4864 | 241/18723 | 3.09e-04 | 2.47e-03 | 87 |
| GO:00327816 | Skin | cSCC | positive regulation of ATPase activity | 15/4864 | 27/18723 | 1.03e-03 | 6.94e-03 | 15 |
| GO:00434628 | Skin | cSCC | regulation of ATPase activity | 22/4864 | 46/18723 | 1.16e-03 | 7.61e-03 | 22 |
| GO:00711031 | Skin | cSCC | DNA conformation change | 96/4864 | 290/18723 | 3.87e-03 | 2.07e-02 | 96 |
| GO:000632520 | Thyroid | PTC | chromatin organization | 183/5968 | 409/18723 | 2.55e-08 | 5.70e-07 | 183 |
| GO:00063385 | Thyroid | PTC | chromatin remodeling | 106/5968 | 255/18723 | 6.56e-04 | 4.13e-03 | 106 |
| GO:00434629 | Thyroid | PTC | regulation of ATPase activity | 23/5968 | 46/18723 | 7.89e-03 | 3.33e-02 | 23 |
| GO:00327817 | Thyroid | PTC | positive regulation of ATPase activity | 15/5968 | 27/18723 | 9.19e-03 | 3.79e-02 | 15 |
| GO:0006325110 | Thyroid | ATC | chromatin organization | 189/6293 | 409/18723 | 6.40e-08 | 1.13e-06 | 189 |
| Page: 1 2 |
| Pathway ID | Tissue | Disease Stage | Description | Gene Ratio | Bg Ratio | pvalue | p.adjust | qvalue | Count |
| Page: 1 |
Top |
Cell-cell communication analysis |
| Identification of potential cell-cell interactions between two cell types and their ligand-receptor pairs for different disease states |
| Ligand | Receptor | LRpair | Pathway | Tissue | Disease Stage |
| Page: 1 |
Top |
Single-cell gene regulatory network inference analysis |
| Find out the significant the regulons (TFs) and the target genes of each regulon across cell types for different disease states |
| TF | Cell Type | Tissue | Disease Stage | Target Gene | RSS | Regulon Activity |
| ∗The dot plots of a searched regulon are shown for all cell subpopulations in each disease state of each tissue based on the regulon specific score inferred using pySCENIC and by calculating the average expression. |
| Page: 1 |
Top |
Somatic mutation of malignant transformation related genes |
| Annotation of somatic variants for genes involved in malignant transformation |
| Hugo Symbol | Variant Class | Variant Classification | dbSNP RS | HGVSc | HGVSp | HGVSp Short | SWISSPROT | BIOTYPE | SIFT | PolyPhen | Tumor Sample Barcode | Tissue | Histology | Sex | Age | Stage | Therapy Types | Drugs | Outcome |
| DNAJC9 | SNV | Missense_Mutation | c.211G>A | p.Asp71Asn | p.D71N | Q8WXX5 | protein_coding | tolerated(0.07) | probably_damaging(0.936) | TCGA-AC-A23H-01 | Breast | breast invasive carcinoma | Female | >=65 | I/II | Unknown | Unknown | PD | |
| DNAJC9 | SNV | Missense_Mutation | novel | c.236N>G | p.Asp79Gly | p.D79G | Q8WXX5 | protein_coding | deleterious(0) | probably_damaging(1) | TCGA-AN-A046-01 | Breast | breast invasive carcinoma | Female | >=65 | I/II | Unknown | Unknown | SD |
| DNAJC9 | SNV | Missense_Mutation | c.680N>C | p.Arg227Pro | p.R227P | Q8WXX5 | protein_coding | deleterious(0) | probably_damaging(0.954) | TCGA-AN-A0FX-01 | Breast | breast invasive carcinoma | Female | <65 | I/II | Unknown | Unknown | SD | |
| DNAJC9 | SNV | Missense_Mutation | c.420C>G | p.Asp140Glu | p.D140E | Q8WXX5 | protein_coding | deleterious(0) | possibly_damaging(0.773) | TCGA-AN-A0XU-01 | Breast | breast invasive carcinoma | Female | <65 | I/II | Unknown | Unknown | SD | |
| DNAJC9 | SNV | Missense_Mutation | rs199703504 | c.245N>A | p.Gly82Glu | p.G82E | Q8WXX5 | protein_coding | deleterious(0) | probably_damaging(1) | TCGA-C8-A274-01 | Breast | breast invasive carcinoma | Female | <65 | I/II | Hormone Therapy | tamoxiphen | SD |
| DNAJC9 | insertion | Nonsense_Mutation | novel | c.367_368insAGAATTGGGTAAAAAA | p.Ser123Ter | p.S123* | Q8WXX5 | protein_coding | TCGA-AN-A03X-01 | Breast | breast invasive carcinoma | Female | >=65 | I/II | Unknown | Unknown | SD | ||
| DNAJC9 | deletion | Frame_Shift_Del | c.404_429delNNNNNNNNNNNNNNNNNNNNNNNNNN | p.Leu135HisfsTer25 | p.L135Hfs*25 | Q8WXX5 | protein_coding | TCGA-E9-A243-01 | Breast | breast invasive carcinoma | Female | <65 | I/II | Chemotherapy | 5-fluorouracil | PD | |||
| DNAJC9 | SNV | Missense_Mutation | novel | c.703N>G | p.Leu235Val | p.L235V | Q8WXX5 | protein_coding | deleterious(0.02) | benign(0.272) | TCGA-ZJ-A8QR-01 | Cervix | cervical & endocervical cancer | Female | <65 | I/II | Unknown | Unknown | SD |
| DNAJC9 | SNV | Missense_Mutation | novel | c.113N>C | p.Val38Ala | p.V38A | Q8WXX5 | protein_coding | tolerated(0.36) | benign(0.018) | TCGA-5M-AAT6-01 | Colorectum | colon adenocarcinoma | Female | <65 | III/IV | Unknown | Unknown | PD |
| DNAJC9 | SNV | Missense_Mutation | c.433A>G | p.Met145Val | p.M145V | Q8WXX5 | protein_coding | tolerated(0.18) | benign(0.391) | TCGA-CK-5916-01 | Colorectum | colon adenocarcinoma | Female | >=65 | I/II | Unknown | Unknown | PD |
| Page: 1 2 3 |
Top |
Related drugs of malignant transformation related genes |
| Identification of chemicals and drugs interact with genes involved in malignant transfromation |
| (DGIdb 4.0) |
| Entrez ID | Symbol | Category | Interaction Types | Drug Claim Name | Drug Name | PMIDs |
| Page: 1 |

Copyright 2023-Present -The University of Texas Health Science Center at Houston |