Schematic overview of the cellular and molecular mechanisms involved in the cancer progression, including the proposed cellular and molecular mechanisms in cancer cells trajectory. AT1: alveolar type 1 cells; AT2: alveolar type 2 cells; AAH: atypical adenomatous hyperplasia; AIS: adenocarcinoma in situ; MIA: minimally invasive adenocarcinoma; IA: invasive adenocarcinoma; EMT: epithelial-mesenchymal transition

Home

Download

Statistics

Help

Contact

Center for Computational Systems Medicine
leaf

Gene summary

leaf

Malignant transformation analysis

leaf

Malignant transformation related pathway analysis

leaf

Cell-cell communication analysis

leaf

Single-cell gene regulatory network inference analysis

leaf

Somatic mutation of malignant transformation related genes

leaf

Related drugs of malignant transformation related genes

Gene: DNAJC7

Gene summary for DNAJC7

check button Gene summary.

Gene informationSpeciesHuman
Gene symbol

DNAJC7

Gene ID

7266

Gene nameDnaJ heat shock protein family (Hsp40) member C7
Gene AliasDJ11
Cytomap17q21.2
Gene Typeprotein-coding
GO ID

GO:0006457

UniProtAcc

Q99615


Top

Malignant transformation analysis

check button Identification of the aberrant gene expression in precancerous and cancerous lesions by comparing the gene expression of stem-like cells in diseased tissues with normal stem cells
check button Malignant transformation involving gene list.
Entrez IDSymbolReplicatesSpeciesOrganTissueAdj P-valueLog2FCMalignancy
7266DNAJC7LZE2THumanEsophagusESCC7.64e-056.40e-010.082
7266DNAJC7LZE4THumanEsophagusESCC3.24e-116.00e-010.0811
7266DNAJC7LZE5THumanEsophagusESCC6.14e-041.58e-010.0514
7266DNAJC7LZE7THumanEsophagusESCC1.30e-075.34e-010.0667
7266DNAJC7LZE8THumanEsophagusESCC1.01e-083.30e-010.067
7266DNAJC7LZE22D1HumanEsophagusHGIN1.75e-024.19e-020.0595
7266DNAJC7LZE24THumanEsophagusESCC5.76e-205.64e-010.0596
7266DNAJC7LZE21THumanEsophagusESCC2.98e-055.15e-010.0655
7266DNAJC7LZE6THumanEsophagusESCC1.02e-073.52e-010.0845
7266DNAJC7P1T-EHumanEsophagusESCC8.60e-096.11e-010.0875
7266DNAJC7P2T-EHumanEsophagusESCC2.37e-437.99e-010.1177
7266DNAJC7P4T-EHumanEsophagusESCC4.49e-401.08e+000.1323
7266DNAJC7P5T-EHumanEsophagusESCC6.71e-501.06e+000.1327
7266DNAJC7P8T-EHumanEsophagusESCC6.04e-326.40e-010.0889
7266DNAJC7P9T-EHumanEsophagusESCC3.32e-275.11e-010.1131
7266DNAJC7P10T-EHumanEsophagusESCC1.95e-316.46e-010.116
7266DNAJC7P11T-EHumanEsophagusESCC4.01e-211.07e+000.1426
7266DNAJC7P12T-EHumanEsophagusESCC1.17e-327.57e-010.1122
7266DNAJC7P15T-EHumanEsophagusESCC4.74e-308.42e-010.1149
7266DNAJC7P16T-EHumanEsophagusESCC5.12e-367.36e-010.1153
Page: 1 2 3 4 5 6 7 

check button Transcriptomic changes along malignancy continuum.
TissueExpression DynamicsAbbreviation
EsophagusThe image shows the transcriptomic changes along malignancy continuum.log2FC in expression of this searched gene in stem-like cells from each diseased tissue sample relative to stem-like cells in normal samples in each tissue plotted against the malignancy continuum. Samples are colored based on if they are from different disease stage.
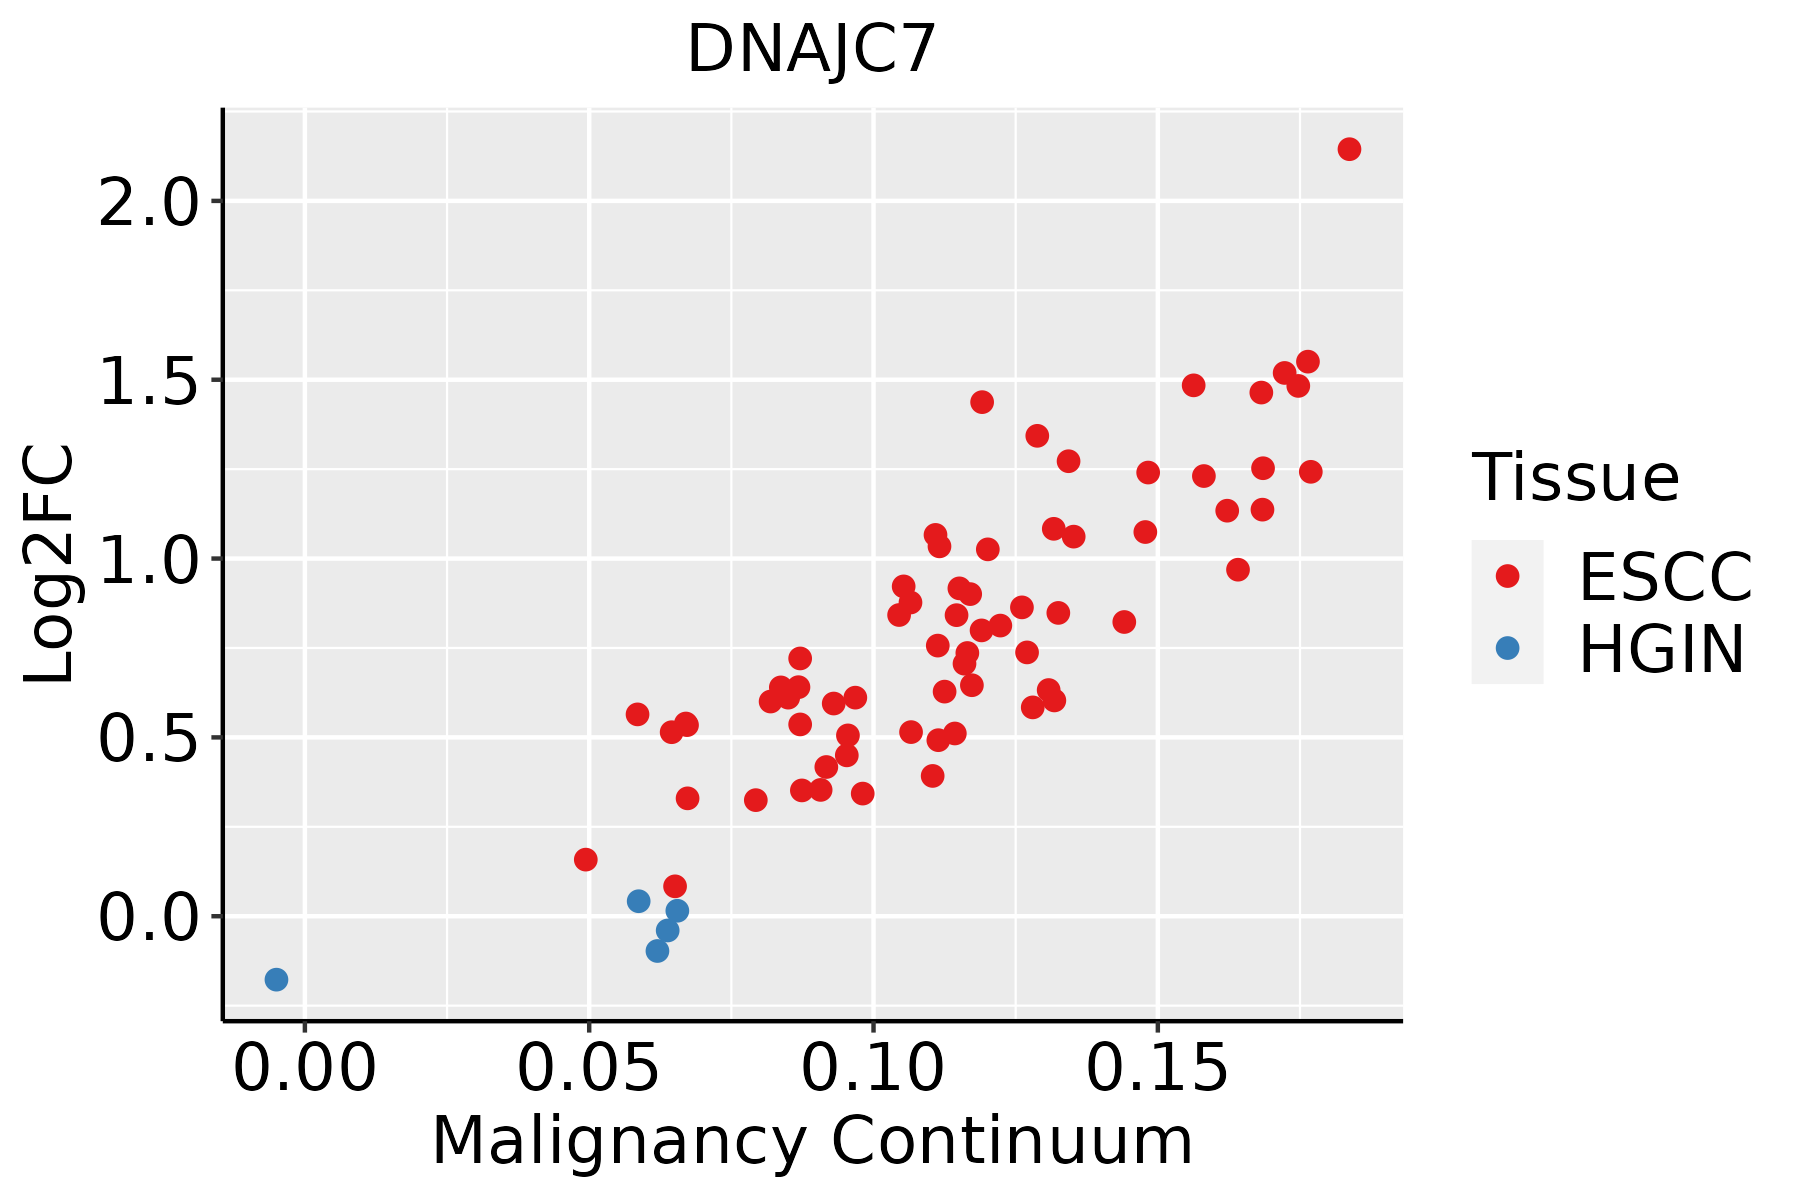
ESCC: Esophageal squamous cell carcinoma
HGIN: High-grade intraepithelial neoplasias
LGIN: Low-grade intraepithelial neoplasias
LiverThe image shows the transcriptomic changes along malignancy continuum.log2FC in expression of this searched gene in stem-like cells from each diseased tissue sample relative to stem-like cells in normal samples in each tissue plotted against the malignancy continuum. Samples are colored based on if they are from different disease stage.
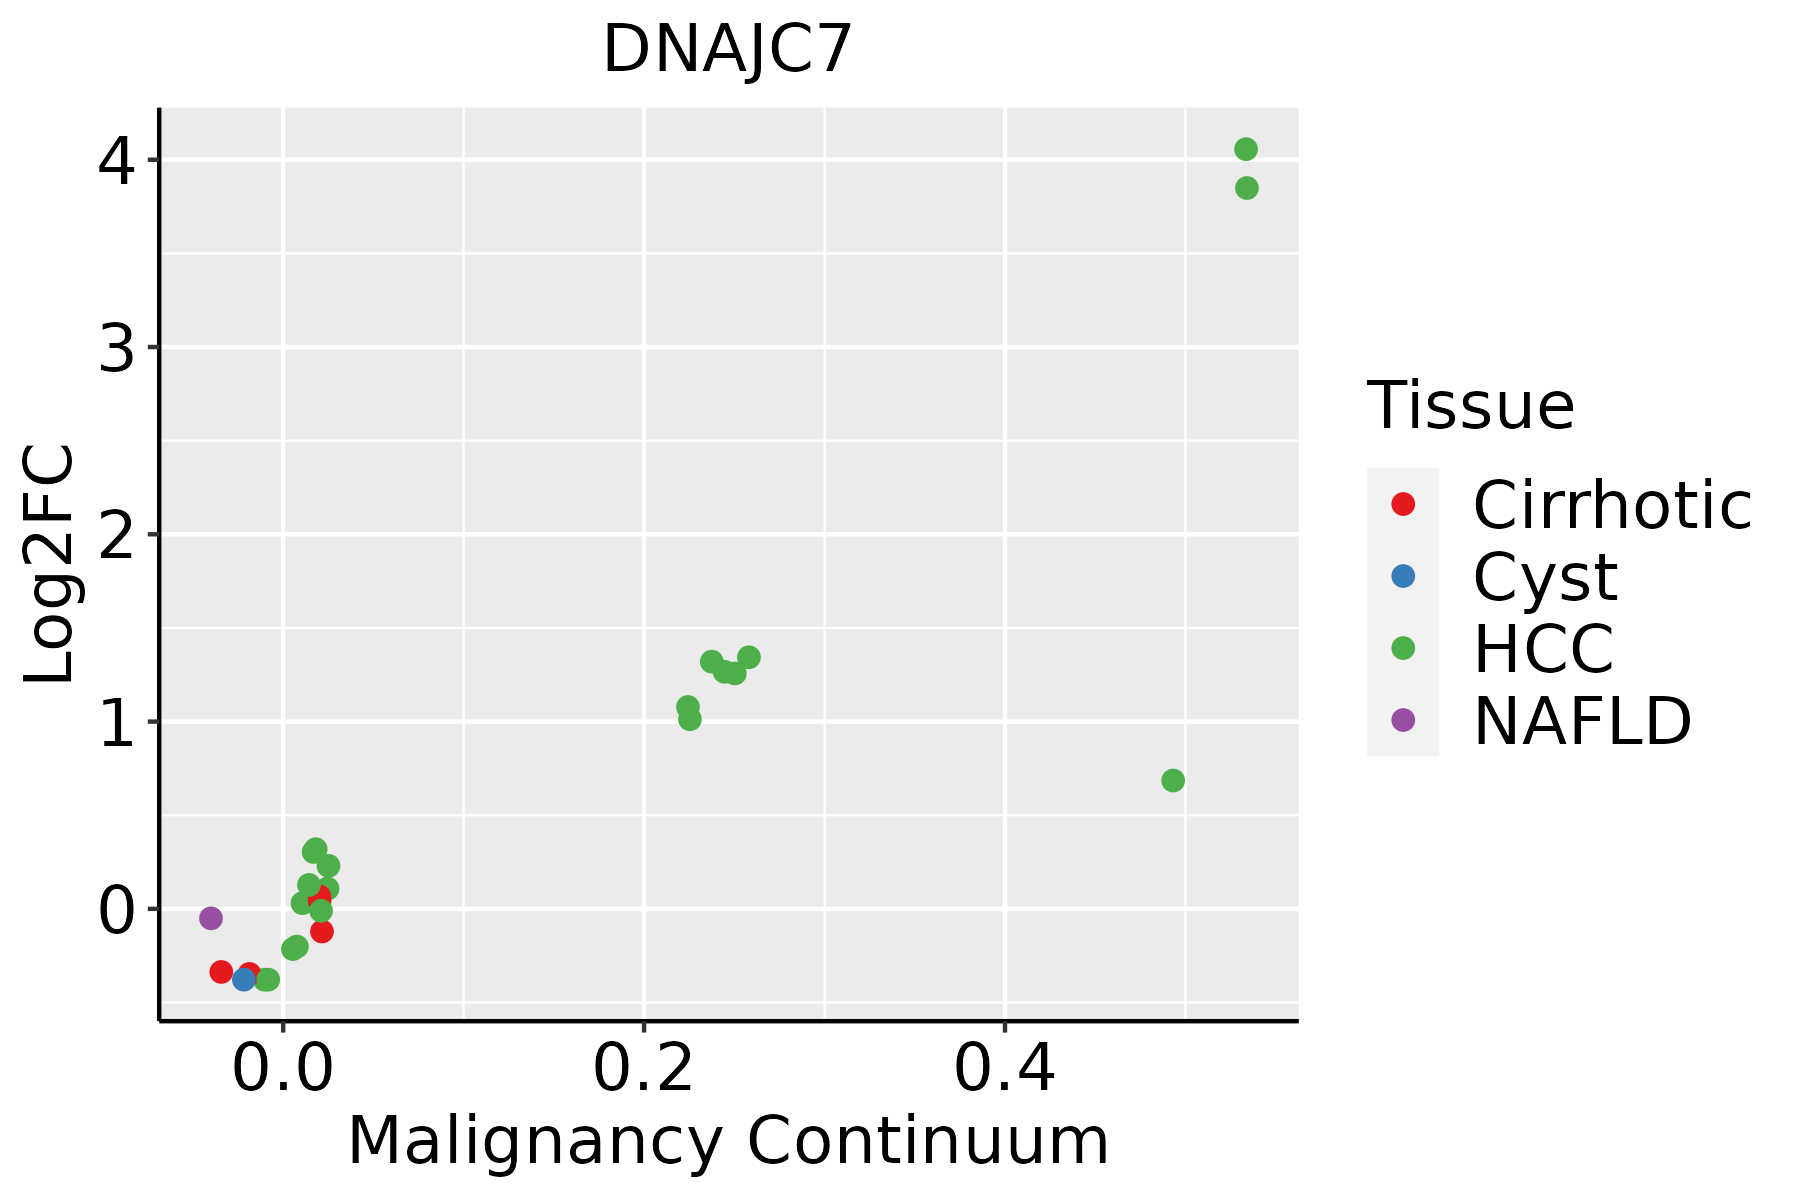
HCC: Hepatocellular carcinoma
NAFLD: Non-alcoholic fatty liver disease
Oral CavityThe image shows the transcriptomic changes along malignancy continuum.log2FC in expression of this searched gene in stem-like cells from each diseased tissue sample relative to stem-like cells in normal samples in each tissue plotted against the malignancy continuum. Samples are colored based on if they are from different disease stage.
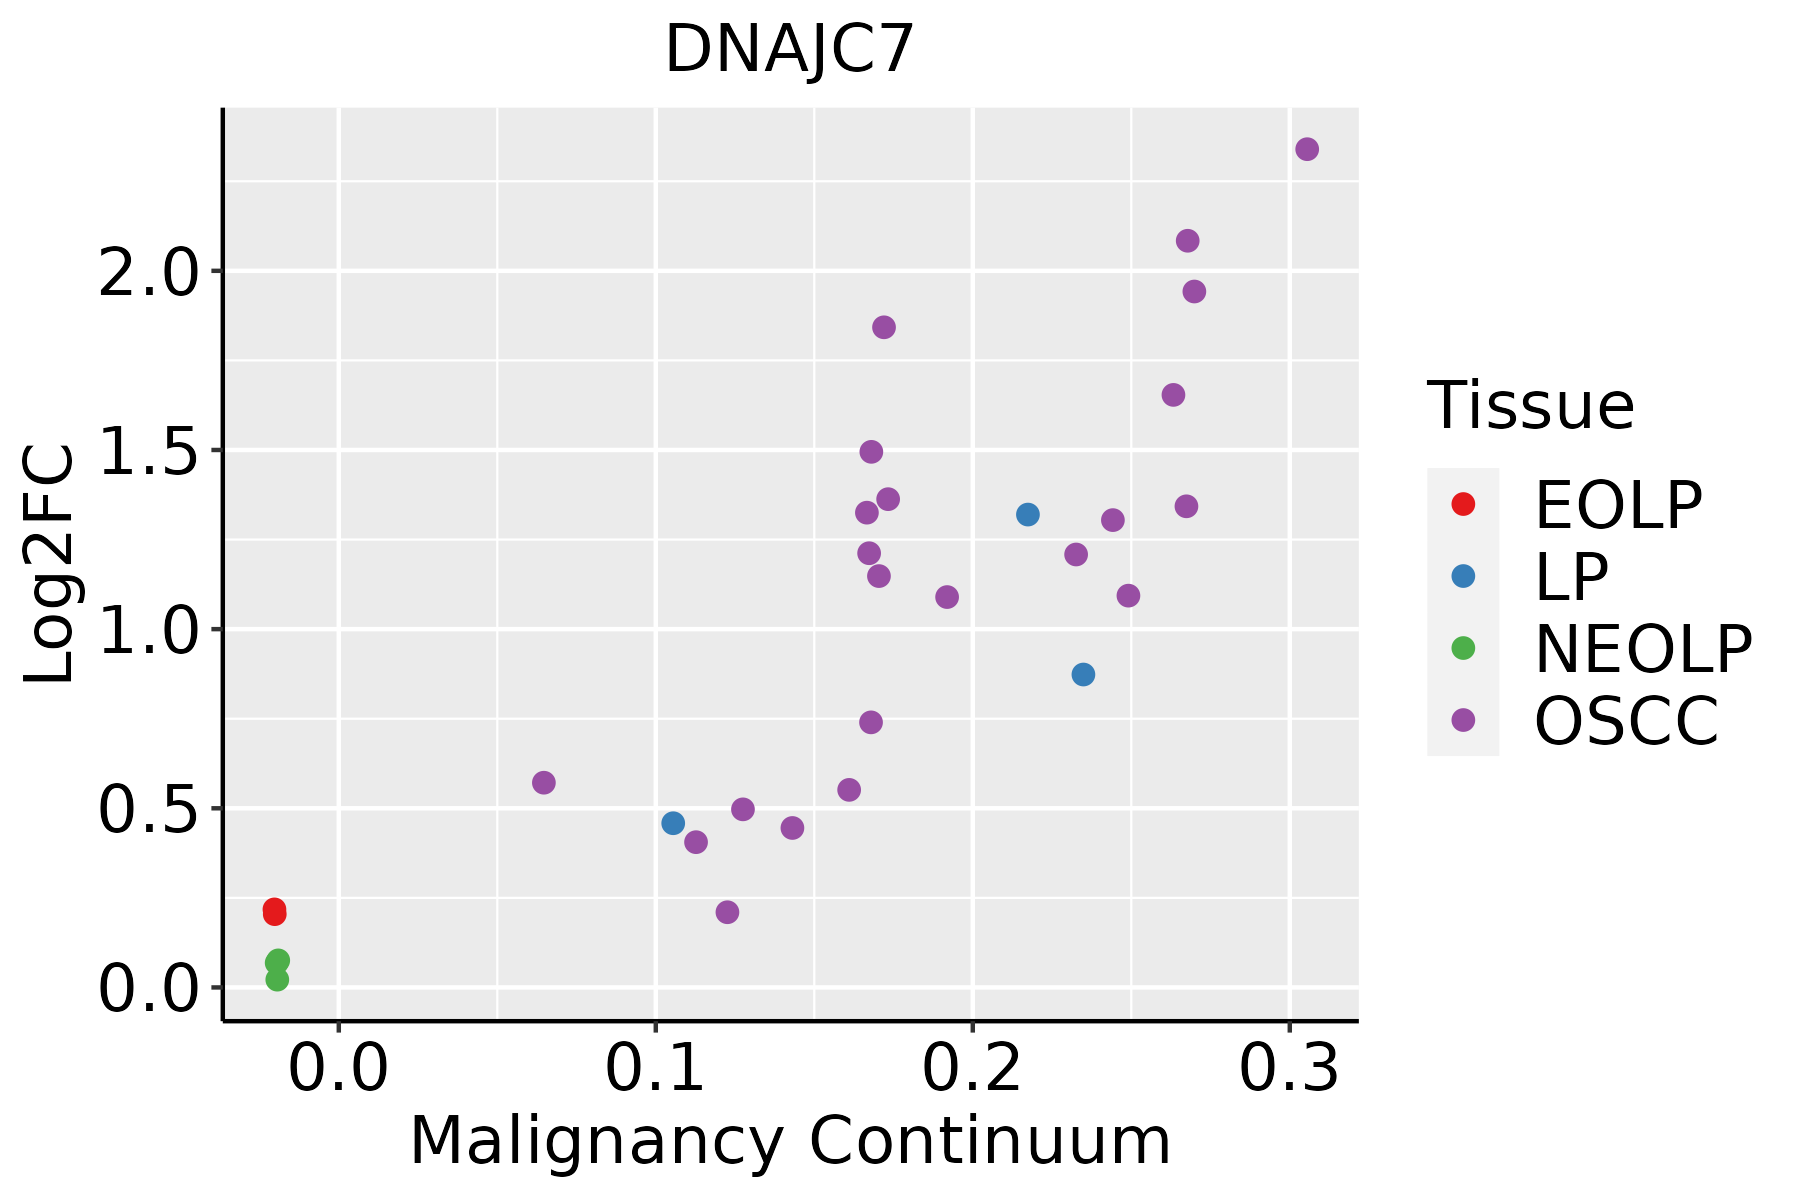
EOLP: Erosive Oral lichen planus
LP: leukoplakia
NEOLP: Non-erosive oral lichen planus
OSCC: Oral squamous cell carcinoma
ProstateThe image shows the transcriptomic changes along malignancy continuum.log2FC in expression of this searched gene in stem-like cells from each diseased tissue sample relative to stem-like cells in normal samples in each tissue plotted against the malignancy continuum. Samples are colored based on if they are from different disease stage.
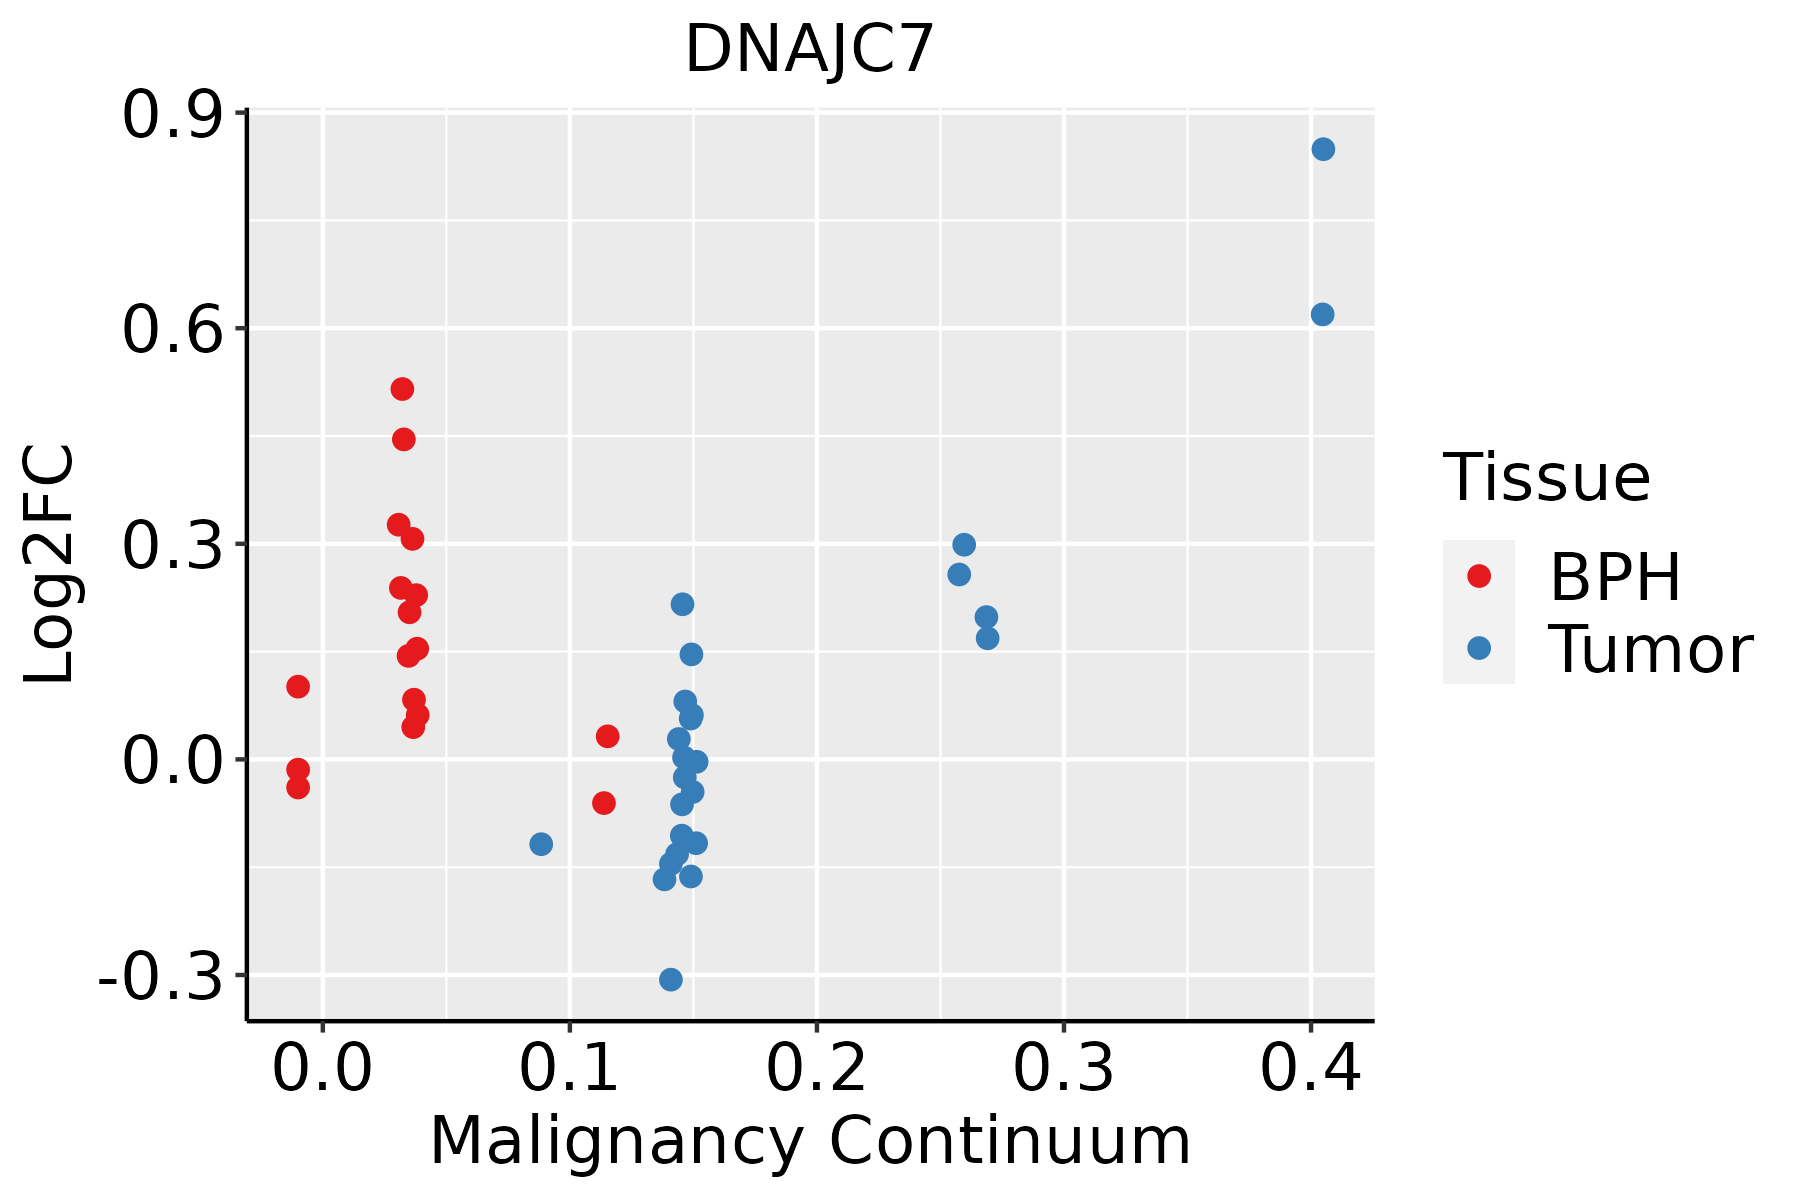
BPH: Benign Prostatic Hyperplasia
SkinThe image shows the transcriptomic changes along malignancy continuum.log2FC in expression of this searched gene in stem-like cells from each diseased tissue sample relative to stem-like cells in normal samples in each tissue plotted against the malignancy continuum. Samples are colored based on if they are from different disease stage.AK: Actinic keratosis
cSCC: Cutaneous squamous cell carcinoma
SCCIS:squamous cell carcinoma in situ
ThyroidThe image shows the transcriptomic changes along malignancy continuum.log2FC in expression of this searched gene in stem-like cells from each diseased tissue sample relative to stem-like cells in normal samples in each tissue plotted against the malignancy continuum. Samples are colored based on if they are from different disease stage.ATC: Anaplastic thyroid cancer
HT: Hashimoto's thyroiditis
PTC: Papillary thyroid cancer
∗log2FC in expression of this searched gene in stem-like cells from each diseased tissue sample relative to stem-like cells in normal samples in each tissue plotted against the malignancy continuum. Samples are colored based on if they are from different disease stage.

Top

Malignant transformation related pathway analysis

check buttonFind out the enriched GO biological processes and KEGG pathways involved in transition from healthy to precancer to cancer
check button Figure of enriched GO biological processes.
TissueDisease StageEnriched GO biological Processes
ColorectumADGO analysis - Figure of enriched GO biological processes: Top 15 enriched GO BP terms are showed in the bar plot of each disease state in each tissue. Each row represents a significant GO biological process which is colored according to the -log10(p.adjust).
ColorectumSERGO analysis - Figure of enriched GO biological processes: Top 15 enriched GO BP terms are showed in the bar plot of each disease state in each tissue. Each row represents a significant GO biological process which is colored according to the -log10(p.adjust).
ColorectumMSSGO analysis - Figure of enriched GO biological processes: Top 15 enriched GO BP terms are showed in the bar plot of each disease state in each tissue. Each row represents a significant GO biological process which is colored according to the -log10(p.adjust).
ColorectumMSI-HGO analysis - Figure of enriched GO biological processes: Top 15 enriched GO BP terms are showed in the bar plot of each disease state in each tissue. Each row represents a significant GO biological process which is colored according to the -log10(p.adjust).
ColorectumFAPGO analysis - Figure of enriched GO biological processes: Top 15 enriched GO BP terms are showed in the bar plot of each disease state in each tissue. Each row represents a significant GO biological process which is colored according to the -log10(p.adjust).
∗Top 15 enriched GO BP terms are showed in the bar plot of each disease state in each tissue. Each row represents a significant GO biological process which is colored according to the -log10(p.adjust).
Page: 1 2 3 4 5 6 7 8 9 

check button Enriched GO biological processes.
GO IDTissueDisease StageDescriptionGene RatioBg Ratiopvaluep.adjustCount
GO:000645720EsophagusHGINprotein folding75/2587212/187231.61e-153.86e-1375
GO:003460520EsophagusHGINcellular response to heat30/258769/187231.78e-091.35e-0730
GO:006107720EsophagusHGINchaperone-mediated protein folding27/258767/187237.99e-084.20e-0627
GO:000645820EsophagusHGIN'de novo' protein folding19/258743/187231.25e-064.83e-0519
GO:000940819EsophagusHGINresponse to heat34/2587110/187232.94e-061.01e-0434
GO:005108420EsophagusHGIN'de novo' posttranslational protein folding16/258739/187232.70e-057.03e-0416
GO:005108520EsophagusHGINchaperone cofactor-dependent protein refolding14/258734/187238.15e-051.80e-0314
GO:000926618EsophagusHGINresponse to temperature stimulus42/2587178/187232.91e-044.98e-0342
GO:19000344EsophagusHGINregulation of cellular response to heat7/258717/187235.21e-034.30e-027
GO:0006457110EsophagusESCCprotein folding163/8552212/187231.13e-201.74e-18163
GO:0061077110EsophagusESCCchaperone-mediated protein folding56/855267/187231.52e-104.36e-0956
GO:0009408110EsophagusESCCresponse to heat77/8552110/187232.01e-073.11e-0677
GO:0006458110EsophagusESCC'de novo' protein folding36/855243/187232.90e-074.20e-0636
GO:0034605111EsophagusESCCcellular response to heat52/855269/187234.87e-076.53e-0652
GO:0051084110EsophagusESCC'de novo' posttranslational protein folding32/855239/187233.27e-063.65e-0532
GO:0051085110EsophagusESCCchaperone cofactor-dependent protein refolding27/855234/187236.01e-054.62e-0427
GO:000926619EsophagusESCCresponse to temperature stimulus106/8552178/187231.30e-048.84e-04106
GO:190003412EsophagusESCCregulation of cellular response to heat13/855217/187231.00e-023.42e-0213
GO:00064577LiverCirrhoticprotein folding114/4634212/187239.23e-202.31e-17114
GO:00610777LiverCirrhoticchaperone-mediated protein folding40/463467/187231.24e-095.43e-0840
Page: 1 2 3 4 5 6 

check button Enriched KEGG pathways.
Pathway IDTissueDisease StageDescriptionGene RatioBg Ratiopvaluep.adjustqvalueCount
Page: 1 

Top

Cell-cell communication analysis

check buttonIdentification of potential cell-cell interactions between two cell types and their ligand-receptor pairs for different disease states
LigandReceptorLRpairPathwayTissueDisease Stage
Page: 1 

Top

Single-cell gene regulatory network inference analysis

check buttonFind out the significant the regulons (TFs) and the target genes of each regulon across cell types for different disease states
TFCell TypeTissueDisease StageTarget GeneRSSRegulon Activity
∗The dot plots of a searched regulon are shown for all cell subpopulations in each disease state of each tissue based on the regulon specific score inferred using pySCENIC and by calculating the average expression.
Page: 1 

Top

Somatic mutation of malignant transformation related genes

check buttonAnnotation of somatic variants for genes involved in malignant transformation
Hugo SymbolVariant ClassVariant ClassificationdbSNP RSHGVScHGVSpHGVSp ShortSWISSPROTBIOTYPESIFTPolyPhenTumor Sample BarcodeTissueHistologySexAgeStageTherapy TypesDrugsOutcome
DNAJC7SNVMissense_Mutationc.1384N>Ap.Asp462Asnp.D462NQ99615protein_codingtolerated(0.09)possibly_damaging(0.58)TCGA-AC-A23H-01Breastbreast invasive carcinomaFemale>=65I/IIUnknownUnknownPD
DNAJC7SNVMissense_Mutationc.1120C>Ap.Leu374Metp.L374MQ99615protein_codingdeleterious(0)probably_damaging(0.996)TCGA-AN-A0AJ-01Breastbreast invasive carcinomaFemale>=65I/IIUnknownUnknownSD
DNAJC7SNVMissense_Mutationc.1205N>Ap.Arg402Glnp.R402QQ99615protein_codingdeleterious(0)probably_damaging(0.994)TCGA-D8-A1Y1-01Breastbreast invasive carcinomaFemale>=65III/IVHormone TherapytamoxiphenPD
DNAJC7SNVMissense_Mutationc.718G>Ap.Ala240Thrp.A240TQ99615protein_codingtolerated(0.05)possibly_damaging(0.515)TCGA-EW-A1IZ-01Breastbreast invasive carcinomaFemale<65III/IVChemotherapytaxotereSD
DNAJC7SNVMissense_Mutationnovelc.320N>Cp.Leu107Prop.L107PQ99615protein_codingdeleterious(0)probably_damaging(0.961)TCGA-GI-A2C9-01Breastbreast invasive carcinomaFemale<65I/IIUnspecificSD
DNAJC7insertionFrame_Shift_Insnovelc.1234_1235insAGGAGACTp.Arg412GlnfsTer45p.R412Qfs*45Q99615protein_codingTCGA-B6-A0I5-01Breastbreast invasive carcinomaFemale<65I/IIUnknownUnknownSD
DNAJC7insertionFrame_Shift_Insnovelc.1232_1233insGCATGGTGGTGCATGCCTGTGGTCCAAGCTACp.Asp411GlufsTer54p.D411Efs*54Q99615protein_codingTCGA-B6-A0I5-01Breastbreast invasive carcinomaFemale<65I/IIUnknownUnknownSD
DNAJC7insertionNonsense_Mutationnovelc.1240_1241insTGAGCTGAGATCGCACCACTGCACTCCAGCCTGGCGACAGAGp.Ser414delinsMetSerTerAspArgThrThrAlaLeuGlnProGlyAspArgGlyp.S414delinsMS*DRTTALQPGDRGQ99615protein_codingTCGA-BH-A0HW-01Breastbreast invasive carcinomaFemale<65I/IIChemotherapydoxorubicinSD
DNAJC7SNVMissense_Mutationrs369947605c.1409N>Gp.Lys470Argp.K470RQ99615protein_codingtolerated(0.86)benign(0)TCGA-C5-A3HL-01Cervixcervical & endocervical cancerFemale>=65I/IIUnknownUnknownSD
DNAJC7SNVMissense_Mutationc.1366G>Ap.Glu456Lysp.E456KQ99615protein_codingtolerated(0.33)benign(0.017)TCGA-EX-A69L-01Cervixcervical & endocervical cancerFemale<65I/IIUnknownUnknownSD
Page: 1 2 3 4 5 

Top

Related drugs of malignant transformation related genes

check buttonIdentification of chemicals and drugs interact with genes involved in malignant transfromation
(DGIdb 4.0)
Entrez IDSymbolCategoryInteraction TypesDrug Claim NameDrug NamePMIDs
Page: 1