
|
|||||
|
 | |
| |
| |
| |
| |
| |
|
Gene: DNAJC4 |
Gene summary for DNAJC4 |
| Gene information | Species | Human | Gene symbol | DNAJC4 | Gene ID | 3338 |
| Gene name | DnaJ heat shock protein family (Hsp40) member C4 | |
| Gene Alias | DANJC4 | |
| Cytomap | 11q13.1 | |
| Gene Type | protein-coding | GO ID | GO:0006457 | UniProtAcc | J3KNJ8 |
Top |
Malignant transformation analysis |
| Identification of the aberrant gene expression in precancerous and cancerous lesions by comparing the gene expression of stem-like cells in diseased tissues with normal stem cells |
| Entrez ID | Symbol | Replicates | Species | Organ | Tissue | Adj P-value | Log2FC | Malignancy |
| 3338 | DNAJC4 | LZE4T | Human | Esophagus | ESCC | 4.46e-12 | 2.99e-01 | 0.0811 |
| 3338 | DNAJC4 | LZE8T | Human | Esophagus | ESCC | 9.79e-04 | 4.89e-02 | 0.067 |
| 3338 | DNAJC4 | LZE22D1 | Human | Esophagus | HGIN | 3.93e-05 | 4.11e-01 | 0.0595 |
| 3338 | DNAJC4 | LZE22T | Human | Esophagus | ESCC | 1.17e-03 | 4.17e-01 | 0.068 |
| 3338 | DNAJC4 | LZE24T | Human | Esophagus | ESCC | 8.17e-37 | 1.17e+00 | 0.0596 |
| 3338 | DNAJC4 | LZE6T | Human | Esophagus | ESCC | 2.35e-05 | 1.19e-01 | 0.0845 |
| 3338 | DNAJC4 | P1T-E | Human | Esophagus | ESCC | 4.29e-08 | 6.55e-01 | 0.0875 |
| 3338 | DNAJC4 | P2T-E | Human | Esophagus | ESCC | 1.76e-43 | 7.83e-01 | 0.1177 |
| 3338 | DNAJC4 | P4T-E | Human | Esophagus | ESCC | 3.16e-48 | 1.27e+00 | 0.1323 |
| 3338 | DNAJC4 | P5T-E | Human | Esophagus | ESCC | 3.88e-20 | 2.20e-01 | 0.1327 |
| 3338 | DNAJC4 | P8T-E | Human | Esophagus | ESCC | 7.33e-21 | 3.42e-01 | 0.0889 |
| 3338 | DNAJC4 | P9T-E | Human | Esophagus | ESCC | 3.55e-27 | 6.33e-01 | 0.1131 |
| 3338 | DNAJC4 | P10T-E | Human | Esophagus | ESCC | 7.32e-20 | 4.18e-01 | 0.116 |
| 3338 | DNAJC4 | P11T-E | Human | Esophagus | ESCC | 8.16e-16 | 8.29e-01 | 0.1426 |
| 3338 | DNAJC4 | P12T-E | Human | Esophagus | ESCC | 7.10e-37 | 8.43e-01 | 0.1122 |
| 3338 | DNAJC4 | P15T-E | Human | Esophagus | ESCC | 4.11e-19 | 4.55e-01 | 0.1149 |
| 3338 | DNAJC4 | P16T-E | Human | Esophagus | ESCC | 5.54e-37 | 8.61e-01 | 0.1153 |
| 3338 | DNAJC4 | P17T-E | Human | Esophagus | ESCC | 3.00e-08 | 5.03e-01 | 0.1278 |
| 3338 | DNAJC4 | P19T-E | Human | Esophagus | ESCC | 5.56e-06 | 7.22e-01 | 0.1662 |
| 3338 | DNAJC4 | P20T-E | Human | Esophagus | ESCC | 2.80e-28 | 6.39e-01 | 0.1124 |
| Page: 1 2 3 4 5 6 |
| Tissue | Expression Dynamics | Abbreviation |
| Esophagus | 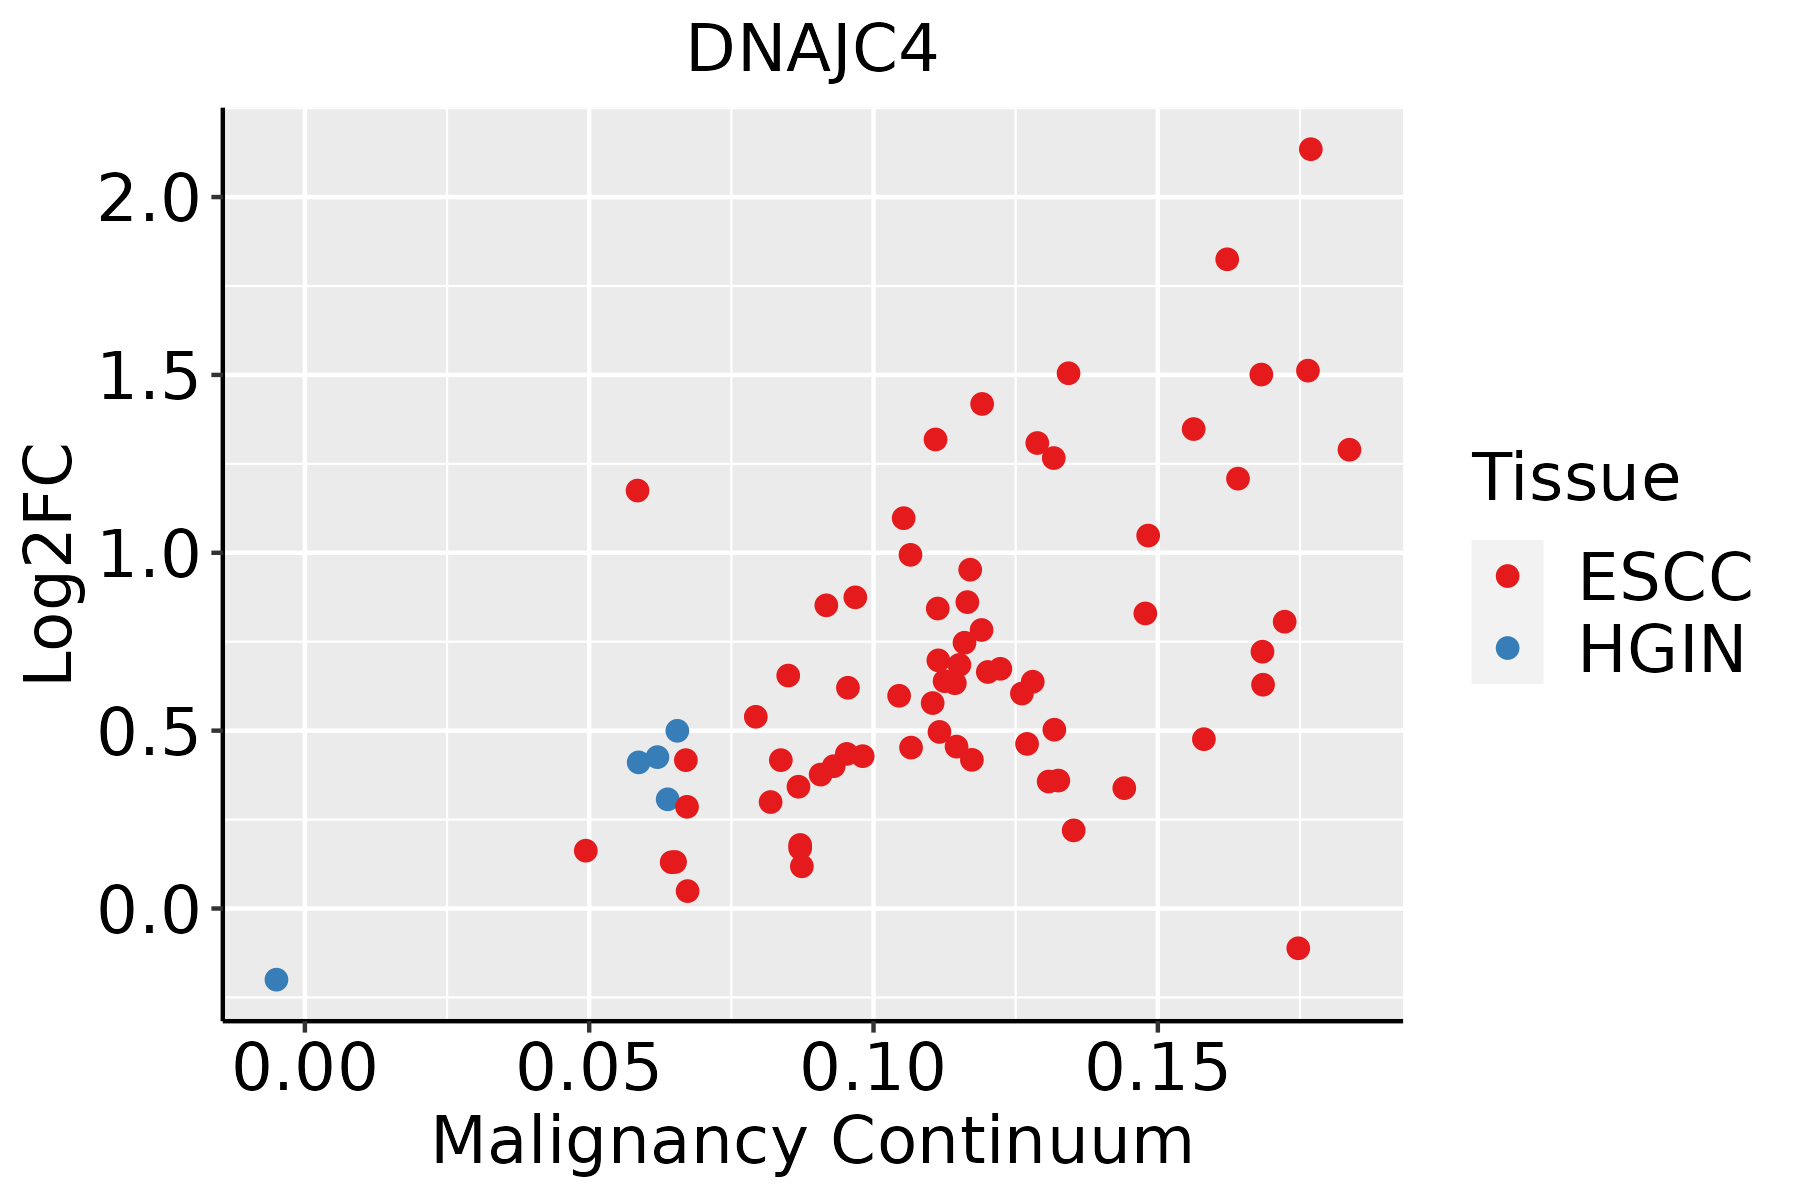 | ESCC: Esophageal squamous cell carcinoma |
| HGIN: High-grade intraepithelial neoplasias | ||
| LGIN: Low-grade intraepithelial neoplasias | ||
| Liver |  | HCC: Hepatocellular carcinoma |
| NAFLD: Non-alcoholic fatty liver disease | ||
| Oral Cavity | 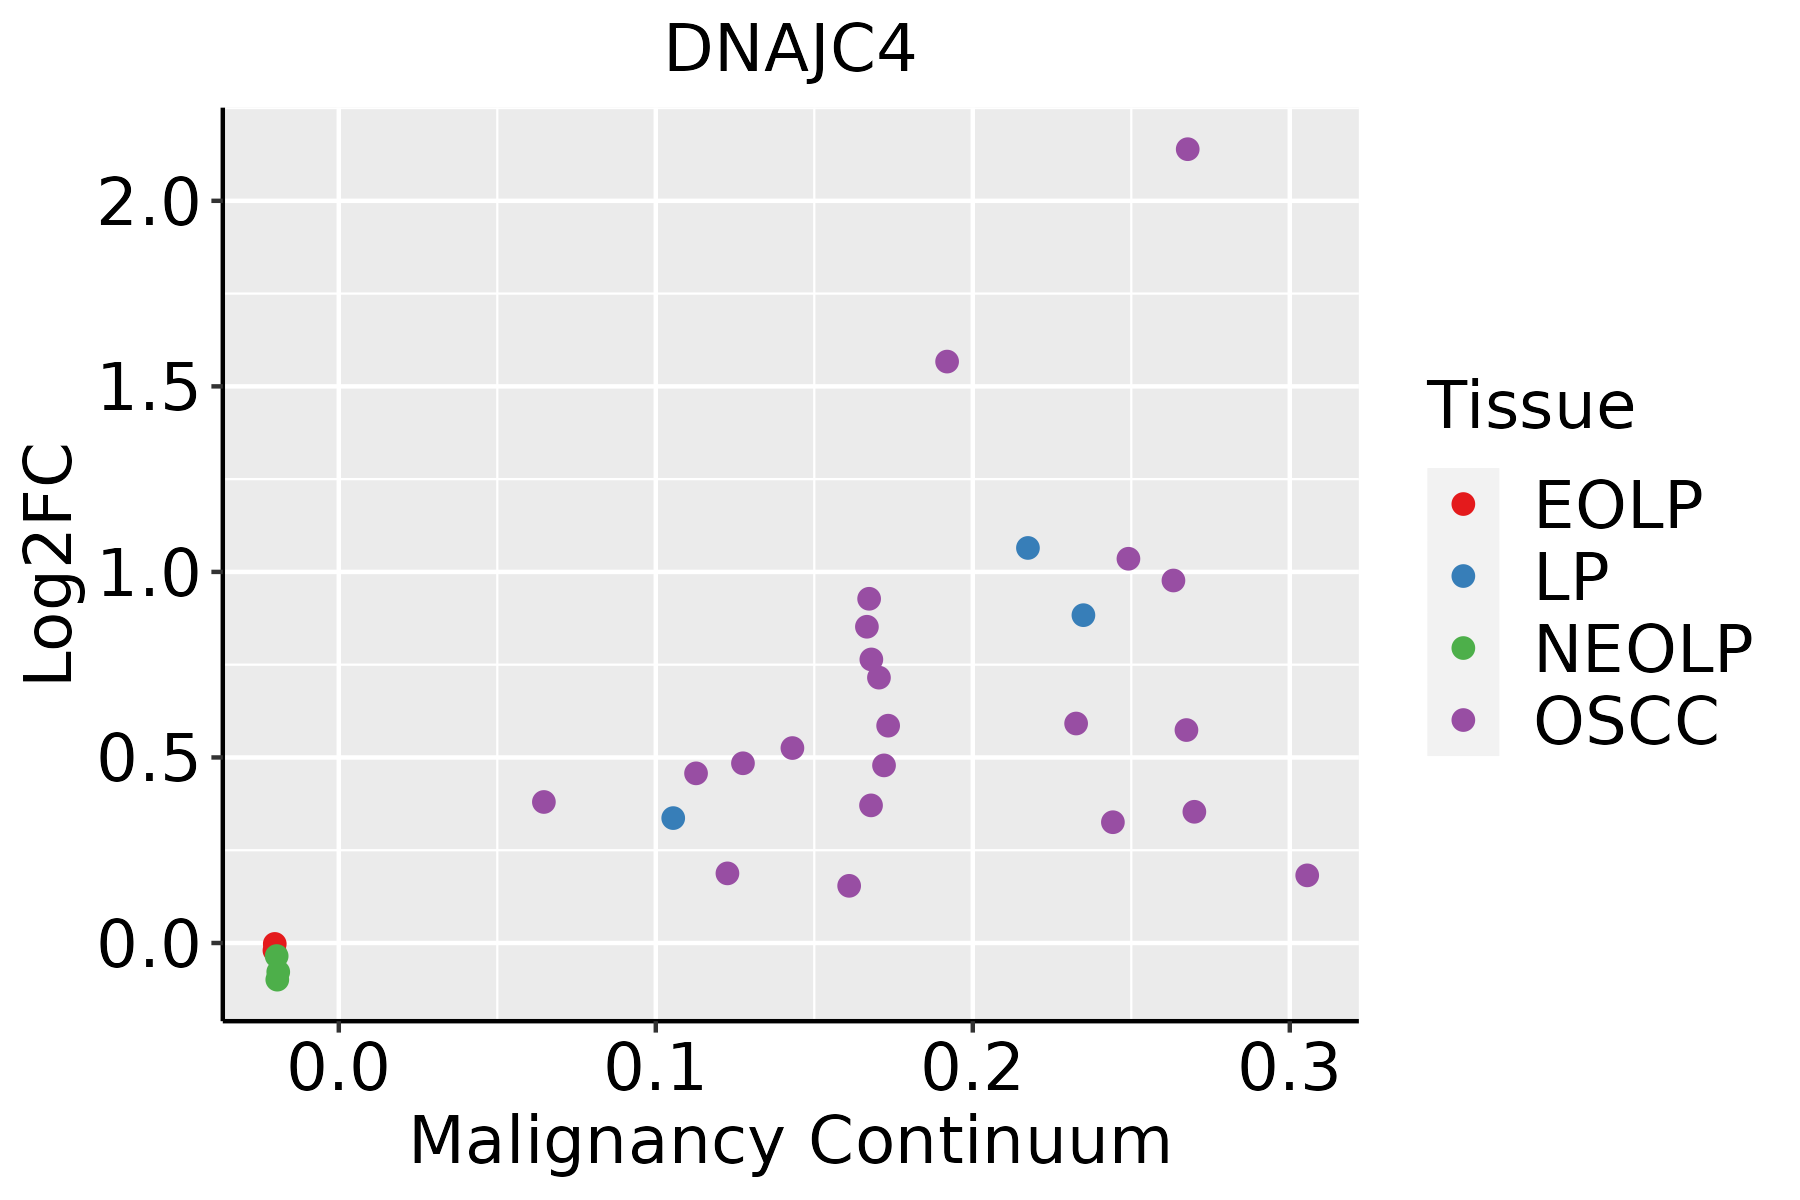 | EOLP: Erosive Oral lichen planus |
| LP: leukoplakia | ||
| NEOLP: Non-erosive oral lichen planus | ||
| OSCC: Oral squamous cell carcinoma | ||
| Skin | 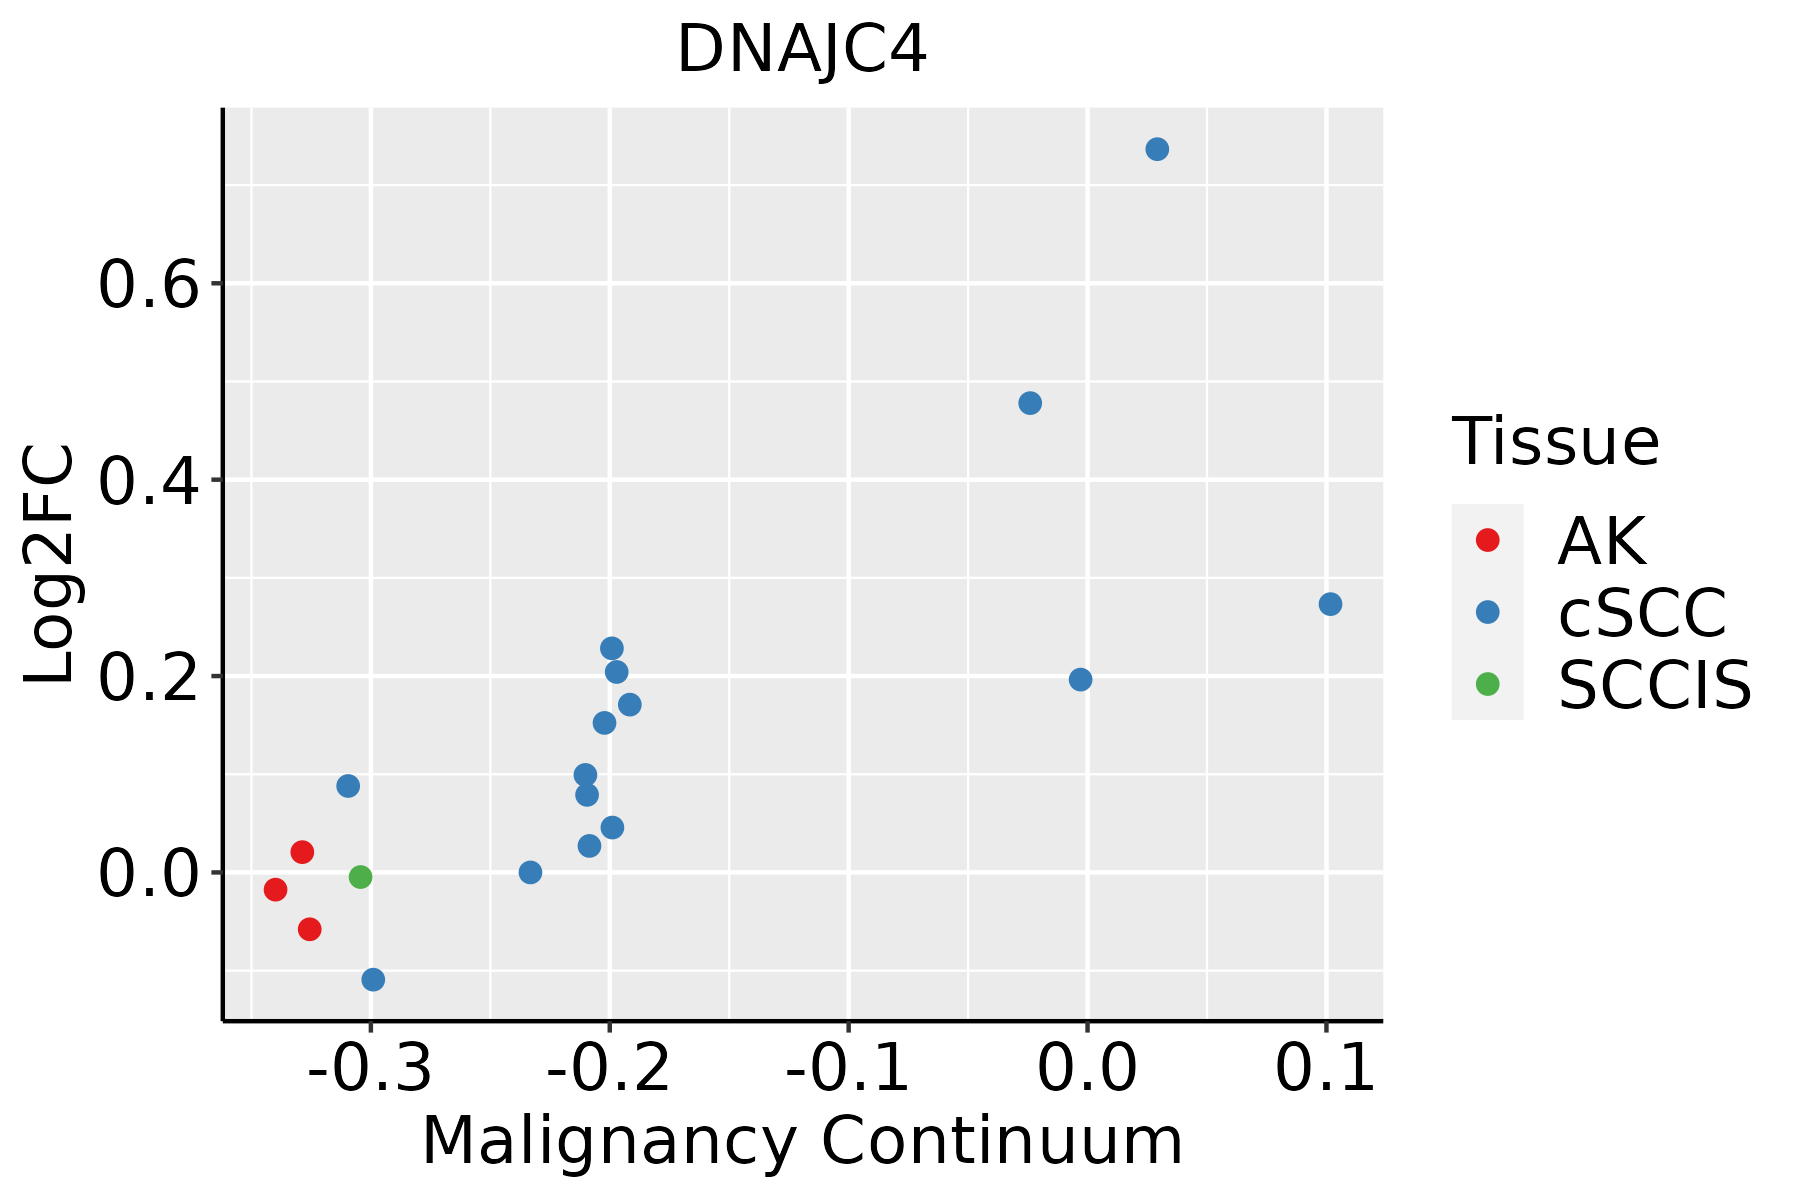 | AK: Actinic keratosis |
| cSCC: Cutaneous squamous cell carcinoma | ||
| SCCIS:squamous cell carcinoma in situ | ||
| Thyroid | 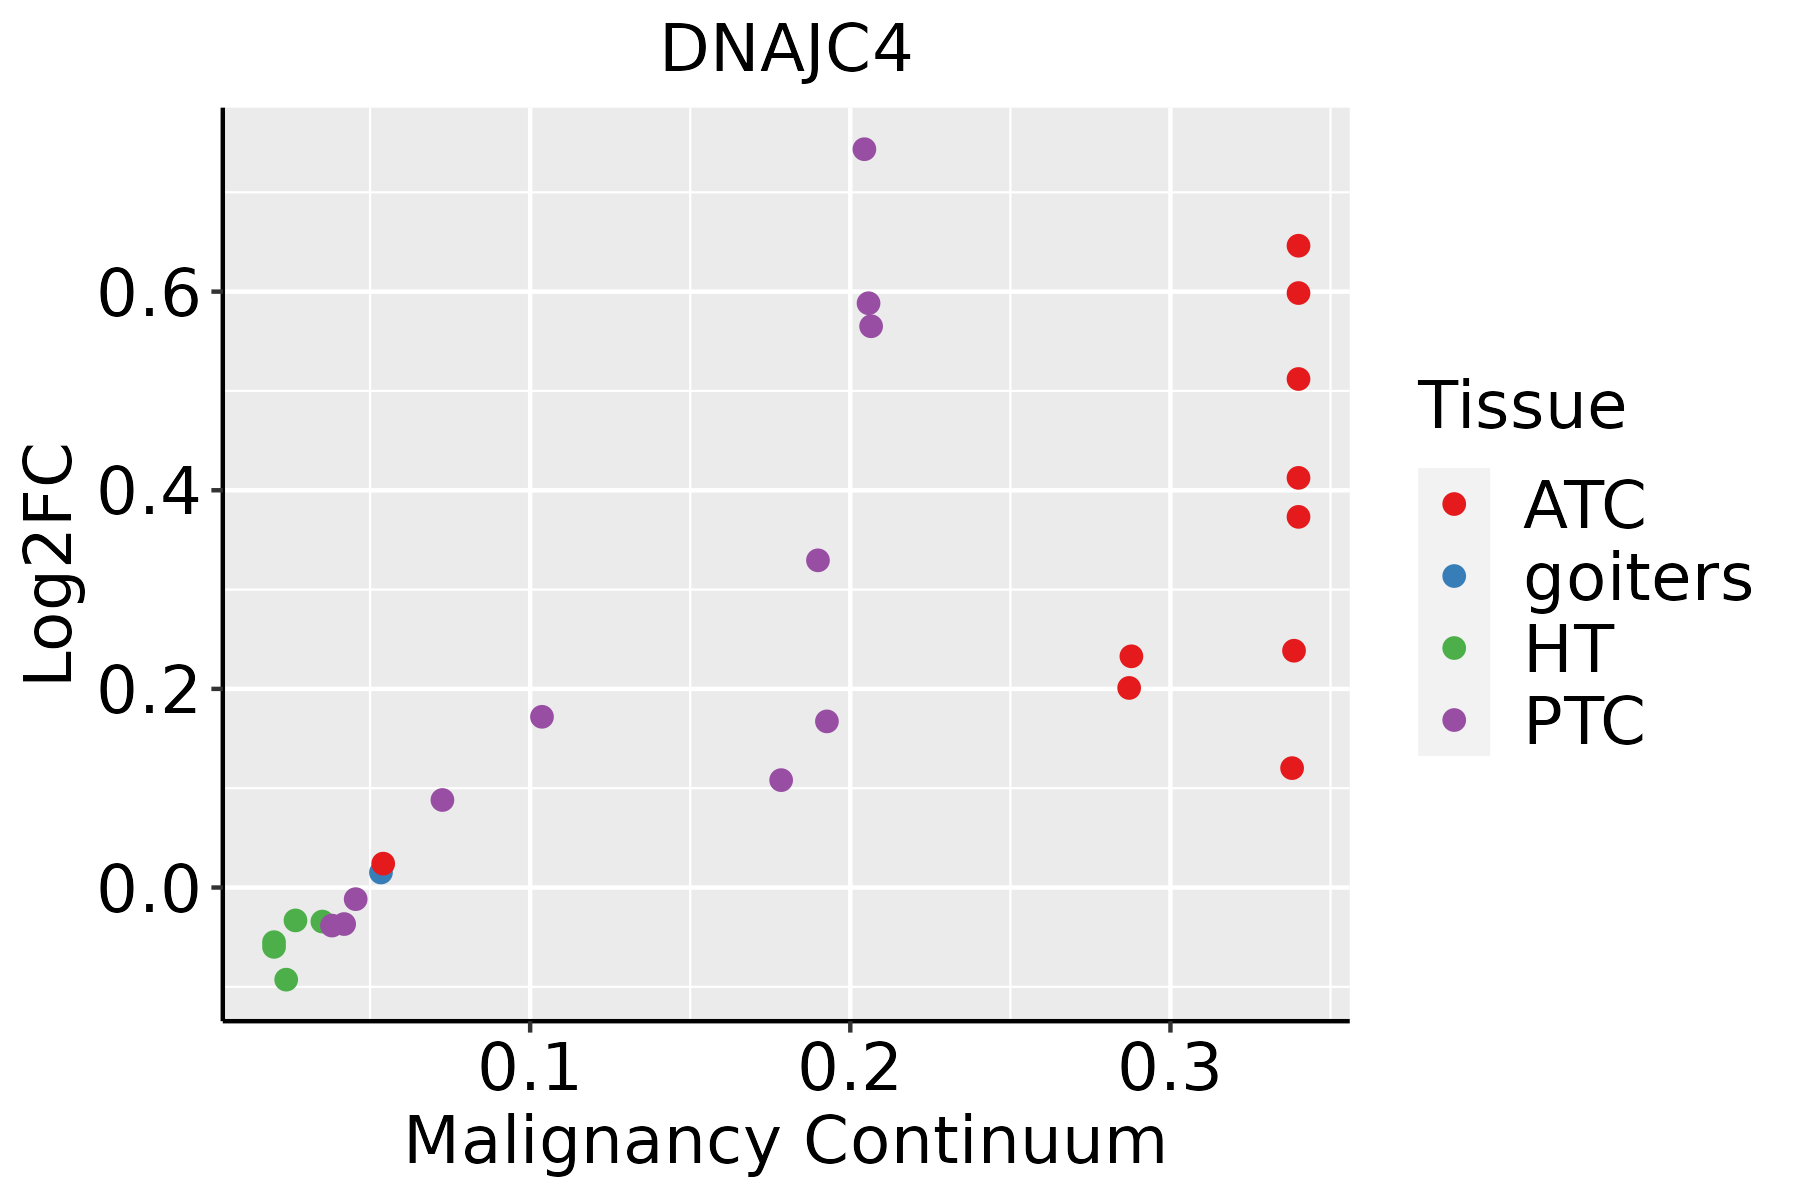 | ATC: Anaplastic thyroid cancer |
| HT: Hashimoto's thyroiditis | ||
| PTC: Papillary thyroid cancer |
| ∗log2FC in expression of this searched gene in stem-like cells from each diseased tissue sample relative to stem-like cells in normal samples in each tissue plotted against the malignancy continuum. Samples are colored based on if they are from different disease stage. |
Top |
Malignant transformation related pathway analysis |
| Find out the enriched GO biological processes and KEGG pathways involved in transition from healthy to precancer to cancer |
| Tissue | Disease Stage | Enriched GO biological Processes |
| Colorectum | AD |  |
| Colorectum | SER |  |
| Colorectum | MSS |  |
| Colorectum | MSI-H |  |
| Colorectum | FAP |  |
| ∗Top 15 enriched GO BP terms are showed in the bar plot of each disease state in each tissue. Each row represents a significant GO biological process which is colored according to the -log10(p.adjust). |
| Page: 1 2 3 4 5 6 7 8 9 |
| GO ID | Tissue | Disease Stage | Description | Gene Ratio | Bg Ratio | pvalue | p.adjust | Count |
| GO:000645720 | Esophagus | HGIN | protein folding | 75/2587 | 212/18723 | 1.61e-15 | 3.86e-13 | 75 |
| GO:003596625 | Esophagus | HGIN | response to topologically incorrect protein | 54/2587 | 159/18723 | 8.53e-11 | 8.89e-09 | 54 |
| GO:000698625 | Esophagus | HGIN | response to unfolded protein | 48/2587 | 137/18723 | 2.80e-10 | 2.54e-08 | 48 |
| GO:0006457110 | Esophagus | ESCC | protein folding | 163/8552 | 212/18723 | 1.13e-20 | 1.74e-18 | 163 |
| GO:0035966111 | Esophagus | ESCC | response to topologically incorrect protein | 125/8552 | 159/18723 | 1.44e-17 | 1.27e-15 | 125 |
| GO:0006986111 | Esophagus | ESCC | response to unfolded protein | 107/8552 | 137/18723 | 7.01e-15 | 3.87e-13 | 107 |
| GO:00064577 | Liver | Cirrhotic | protein folding | 114/4634 | 212/18723 | 9.23e-20 | 2.31e-17 | 114 |
| GO:00359667 | Liver | Cirrhotic | response to topologically incorrect protein | 91/4634 | 159/18723 | 2.07e-18 | 3.60e-16 | 91 |
| GO:00069867 | Liver | Cirrhotic | response to unfolded protein | 79/4634 | 137/18723 | 1.99e-16 | 2.49e-14 | 79 |
| GO:000645712 | Liver | HCC | protein folding | 160/7958 | 212/18723 | 1.07e-22 | 1.88e-20 | 160 |
| GO:003596612 | Liver | HCC | response to topologically incorrect protein | 123/7958 | 159/18723 | 2.60e-19 | 3.44e-17 | 123 |
| GO:000698612 | Liver | HCC | response to unfolded protein | 103/7958 | 137/18723 | 6.50e-15 | 4.48e-13 | 103 |
| GO:000645718 | Oral cavity | OSCC | protein folding | 154/7305 | 212/18723 | 1.89e-23 | 4.60e-21 | 154 |
| GO:003596620 | Oral cavity | OSCC | response to topologically incorrect protein | 117/7305 | 159/18723 | 6.93e-19 | 8.60e-17 | 117 |
| GO:000698620 | Oral cavity | OSCC | response to unfolded protein | 103/7305 | 137/18723 | 6.47e-18 | 6.50e-16 | 103 |
| GO:000645719 | Oral cavity | LP | protein folding | 125/4623 | 212/18723 | 1.62e-26 | 8.45e-24 | 125 |
| GO:0035966110 | Oral cavity | LP | response to topologically incorrect protein | 87/4623 | 159/18723 | 4.31e-16 | 6.28e-14 | 87 |
| GO:0006986110 | Oral cavity | LP | response to unfolded protein | 76/4623 | 137/18723 | 1.14e-14 | 1.35e-12 | 76 |
| GO:0006457111 | Skin | cSCC | protein folding | 131/4864 | 212/18723 | 2.96e-28 | 1.32e-25 | 131 |
| GO:0035966112 | Skin | cSCC | response to topologically incorrect protein | 90/4864 | 159/18723 | 2.26e-16 | 2.12e-14 | 90 |
| Page: 1 2 |
| Pathway ID | Tissue | Disease Stage | Description | Gene Ratio | Bg Ratio | pvalue | p.adjust | qvalue | Count |
| Page: 1 |
Top |
Cell-cell communication analysis |
| Identification of potential cell-cell interactions between two cell types and their ligand-receptor pairs for different disease states |
| Ligand | Receptor | LRpair | Pathway | Tissue | Disease Stage |
| Page: 1 |
Top |
Single-cell gene regulatory network inference analysis |
| Find out the significant the regulons (TFs) and the target genes of each regulon across cell types for different disease states |
| TF | Cell Type | Tissue | Disease Stage | Target Gene | RSS | Regulon Activity |
| ∗The dot plots of a searched regulon are shown for all cell subpopulations in each disease state of each tissue based on the regulon specific score inferred using pySCENIC and by calculating the average expression. |
| Page: 1 |
Top |
Somatic mutation of malignant transformation related genes |
| Annotation of somatic variants for genes involved in malignant transformation |
| Hugo Symbol | Variant Class | Variant Classification | dbSNP RS | HGVSc | HGVSp | HGVSp Short | SWISSPROT | BIOTYPE | SIFT | PolyPhen | Tumor Sample Barcode | Tissue | Histology | Sex | Age | Stage | Therapy Types | Drugs | Outcome |
| DNAJC4 | SNV | Missense_Mutation | c.409N>T | p.His137Tyr | p.H137Y | protein_coding | deleterious(0) | possibly_damaging(0.731) | TCGA-C5-A1BJ-01 | Cervix | cervical & endocervical cancer | Female | <65 | I/II | Unknown | Unknown | SD | ||
| DNAJC4 | SNV | Missense_Mutation | novel | c.512N>C | p.Leu171Pro | p.L171P | protein_coding | deleterious(0) | probably_damaging(0.928) | TCGA-A6-6653-01 | Colorectum | colon adenocarcinoma | Male | >=65 | I/II | Unknown | Unknown | SD | |
| DNAJC4 | SNV | Missense_Mutation | rs765246616 | c.326G>A | p.Arg109Gln | p.R109Q | protein_coding | tolerated(0.38) | benign(0) | TCGA-CA-6718-01 | Colorectum | colon adenocarcinoma | Male | <65 | I/II | Unknown | Unknown | PD | |
| DNAJC4 | SNV | Missense_Mutation | novel | c.451C>A | p.His151Asn | p.H151N | protein_coding | deleterious(0.03) | benign(0.177) | TCGA-EI-6884-01 | Colorectum | rectum adenocarcinoma | Male | >=65 | III/IV | Chemotherapy | 5 | SD | |
| DNAJC4 | insertion | Frame_Shift_Ins | novel | c.116_117insG | p.Val41GlyfsTer8 | p.V41Gfs*8 | protein_coding | TCGA-AZ-6608-01 | Colorectum | colon adenocarcinoma | Female | <65 | III/IV | Unknown | Unknown | SD | |||
| DNAJC4 | SNV | Missense_Mutation | rs373704240 | c.500C>T | p.Ala167Val | p.A167V | protein_coding | tolerated(0.08) | benign(0.029) | TCGA-AP-A0LM-01 | Endometrium | uterine corpus endometrioid carcinoma | Female | <65 | III/IV | Chemotherapy | cisplatin | SD | |
| DNAJC4 | SNV | Missense_Mutation | novel | c.143N>G | p.Glu48Gly | p.E48G | protein_coding | deleterious(0.05) | possibly_damaging(0.779) | TCGA-B5-A3FA-01 | Endometrium | uterine corpus endometrioid carcinoma | Female | >=65 | I/II | Unknown | Unknown | SD | |
| DNAJC4 | SNV | Missense_Mutation | rs373704240 | c.500N>T | p.Ala167Val | p.A167V | protein_coding | tolerated(0.08) | benign(0.029) | TCGA-D1-A101-01 | Endometrium | uterine corpus endometrioid carcinoma | Female | <65 | I/II | Unknown | Unknown | SD | |
| DNAJC4 | SNV | Missense_Mutation | c.133N>T | p.Ala45Ser | p.A45S | protein_coding | deleterious(0.01) | probably_damaging(0.998) | TCGA-CC-A123-01 | Liver | liver hepatocellular carcinoma | Female | <65 | III/IV | Unknown | Unknown | PD | ||
| DNAJC4 | SNV | Missense_Mutation | c.133N>T | p.Ala45Ser | p.A45S | protein_coding | deleterious(0.01) | probably_damaging(0.998) | TCGA-DD-A1EE-01 | Liver | liver hepatocellular carcinoma | Male | >=65 | III/IV | Unknown | Unknown | PD |
| Page: 1 2 |
Top |
Related drugs of malignant transformation related genes |
| Identification of chemicals and drugs interact with genes involved in malignant transfromation |
| (DGIdb 4.0) |
| Entrez ID | Symbol | Category | Interaction Types | Drug Claim Name | Drug Name | PMIDs |
| Page: 1 |

Copyright 2023-Present -The University of Texas Health Science Center at Houston |