
|
|||||
|
 | |
| |
| |
| |
| |
| |
|
Gene: DNAJC30 |
Gene summary for DNAJC30 |
| Gene information | Species | Human | Gene symbol | DNAJC30 | Gene ID | 84277 |
| Gene name | DnaJ heat shock protein family (Hsp40) member C30 | |
| Gene Alias | LHONAR | |
| Cytomap | 7q11.23 | |
| Gene Type | protein-coding | GO ID | GO:0006091 | UniProtAcc | B3KSU4 |
Top |
Malignant transformation analysis |
| Identification of the aberrant gene expression in precancerous and cancerous lesions by comparing the gene expression of stem-like cells in diseased tissues with normal stem cells |
| Entrez ID | Symbol | Replicates | Species | Organ | Tissue | Adj P-value | Log2FC | Malignancy |
| 84277 | DNAJC30 | LZE4T | Human | Esophagus | ESCC | 8.17e-04 | 1.46e-01 | 0.0811 |
| 84277 | DNAJC30 | LZE24T | Human | Esophagus | ESCC | 6.22e-10 | 3.46e-01 | 0.0596 |
| 84277 | DNAJC30 | P1T-E | Human | Esophagus | ESCC | 5.28e-10 | 4.21e-01 | 0.0875 |
| 84277 | DNAJC30 | P2T-E | Human | Esophagus | ESCC | 3.69e-22 | 3.34e-01 | 0.1177 |
| 84277 | DNAJC30 | P4T-E | Human | Esophagus | ESCC | 1.64e-27 | 6.64e-01 | 0.1323 |
| 84277 | DNAJC30 | P5T-E | Human | Esophagus | ESCC | 7.07e-16 | 3.24e-01 | 0.1327 |
| 84277 | DNAJC30 | P8T-E | Human | Esophagus | ESCC | 2.21e-16 | 2.34e-01 | 0.0889 |
| 84277 | DNAJC30 | P9T-E | Human | Esophagus | ESCC | 1.14e-22 | 5.25e-01 | 0.1131 |
| 84277 | DNAJC30 | P10T-E | Human | Esophagus | ESCC | 1.72e-10 | 2.29e-01 | 0.116 |
| 84277 | DNAJC30 | P11T-E | Human | Esophagus | ESCC | 4.75e-02 | 1.51e-01 | 0.1426 |
| 84277 | DNAJC30 | P12T-E | Human | Esophagus | ESCC | 4.15e-21 | 4.35e-01 | 0.1122 |
| 84277 | DNAJC30 | P15T-E | Human | Esophagus | ESCC | 1.38e-22 | 5.60e-01 | 0.1149 |
| 84277 | DNAJC30 | P16T-E | Human | Esophagus | ESCC | 4.83e-45 | 8.56e-01 | 0.1153 |
| 84277 | DNAJC30 | P17T-E | Human | Esophagus | ESCC | 4.26e-04 | 2.27e-01 | 0.1278 |
| 84277 | DNAJC30 | P19T-E | Human | Esophagus | ESCC | 1.26e-05 | 6.22e-01 | 0.1662 |
| 84277 | DNAJC30 | P20T-E | Human | Esophagus | ESCC | 7.15e-08 | 2.35e-01 | 0.1124 |
| 84277 | DNAJC30 | P21T-E | Human | Esophagus | ESCC | 9.68e-29 | 6.31e-01 | 0.1617 |
| 84277 | DNAJC30 | P22T-E | Human | Esophagus | ESCC | 2.05e-42 | 7.87e-01 | 0.1236 |
| 84277 | DNAJC30 | P23T-E | Human | Esophagus | ESCC | 5.61e-17 | 4.17e-01 | 0.108 |
| 84277 | DNAJC30 | P24T-E | Human | Esophagus | ESCC | 8.03e-19 | 3.87e-01 | 0.1287 |
| Page: 1 2 3 4 5 |
| Tissue | Expression Dynamics | Abbreviation |
| Esophagus |  | ESCC: Esophageal squamous cell carcinoma |
| HGIN: High-grade intraepithelial neoplasias | ||
| LGIN: Low-grade intraepithelial neoplasias | ||
| Liver | 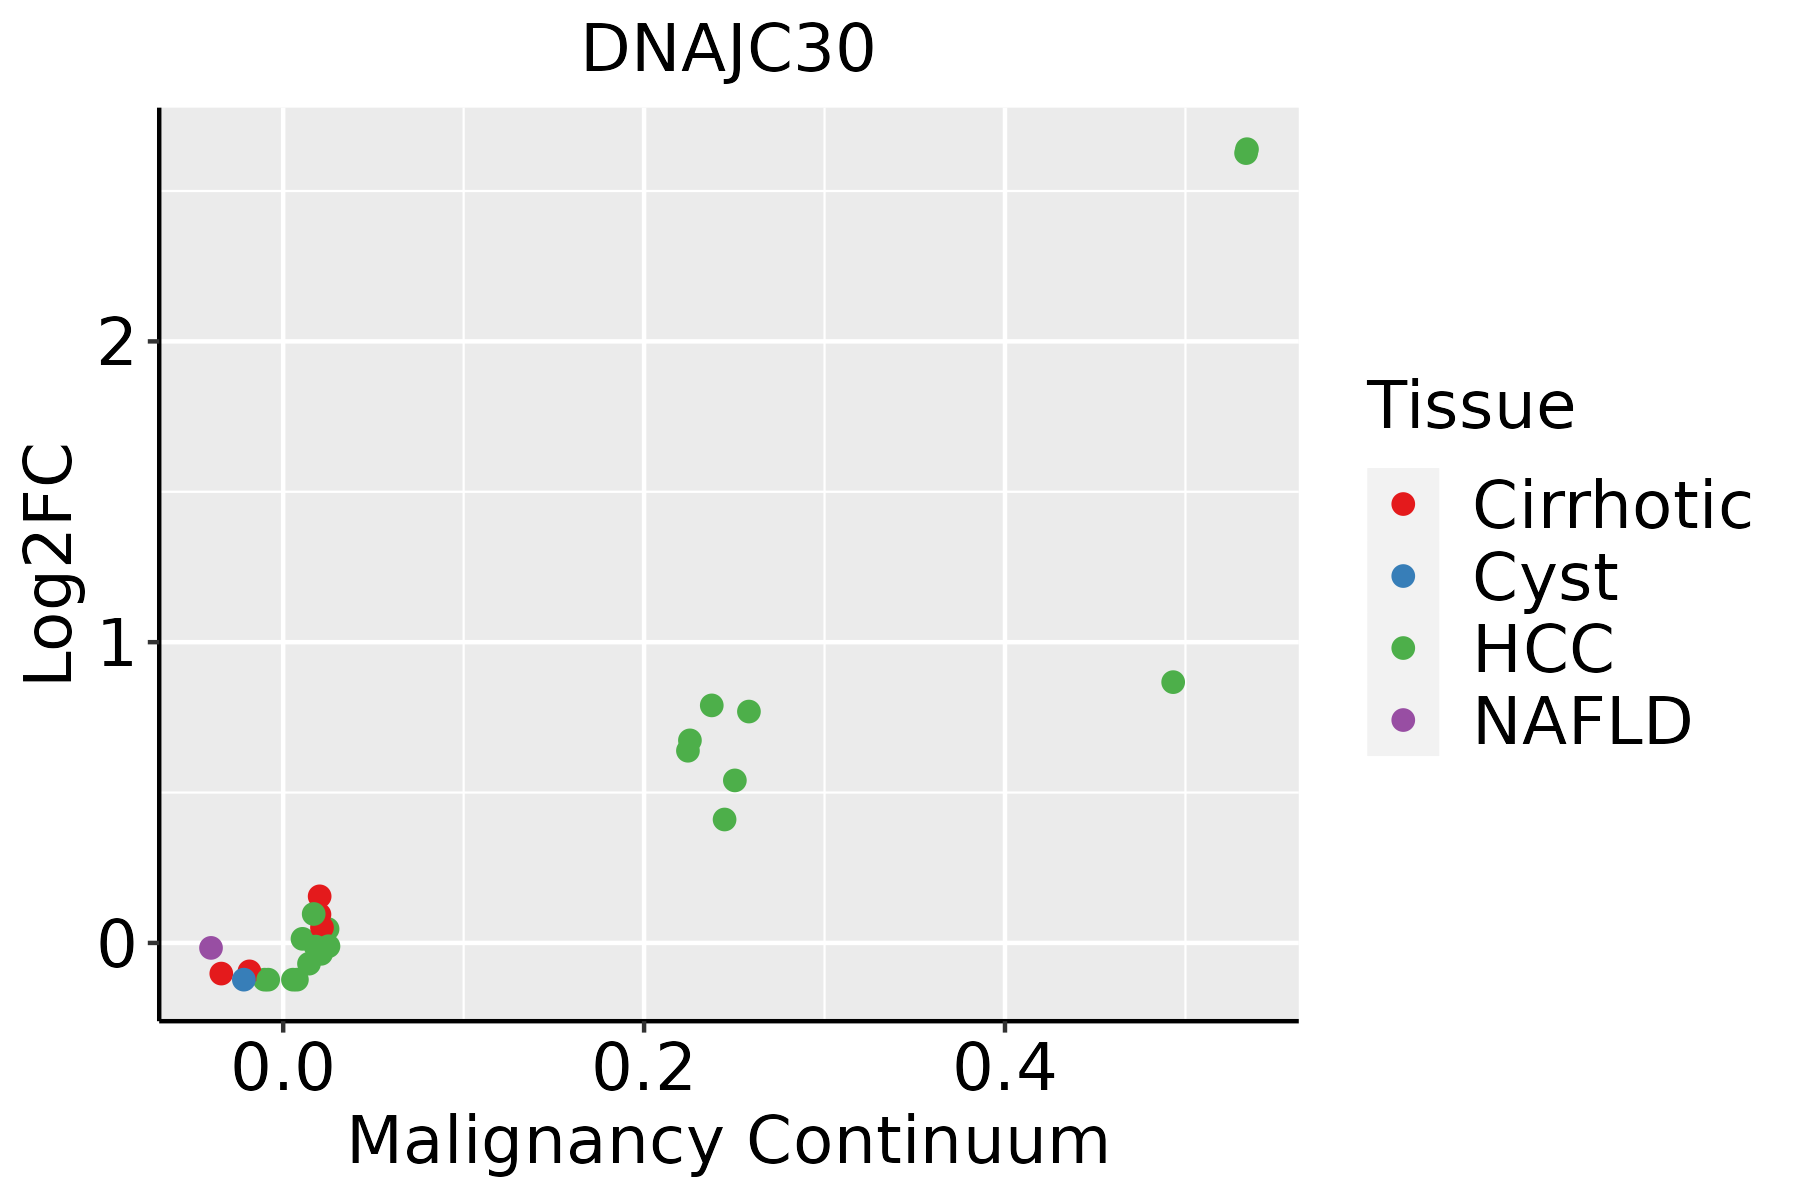 | HCC: Hepatocellular carcinoma |
| NAFLD: Non-alcoholic fatty liver disease | ||
| Oral Cavity | 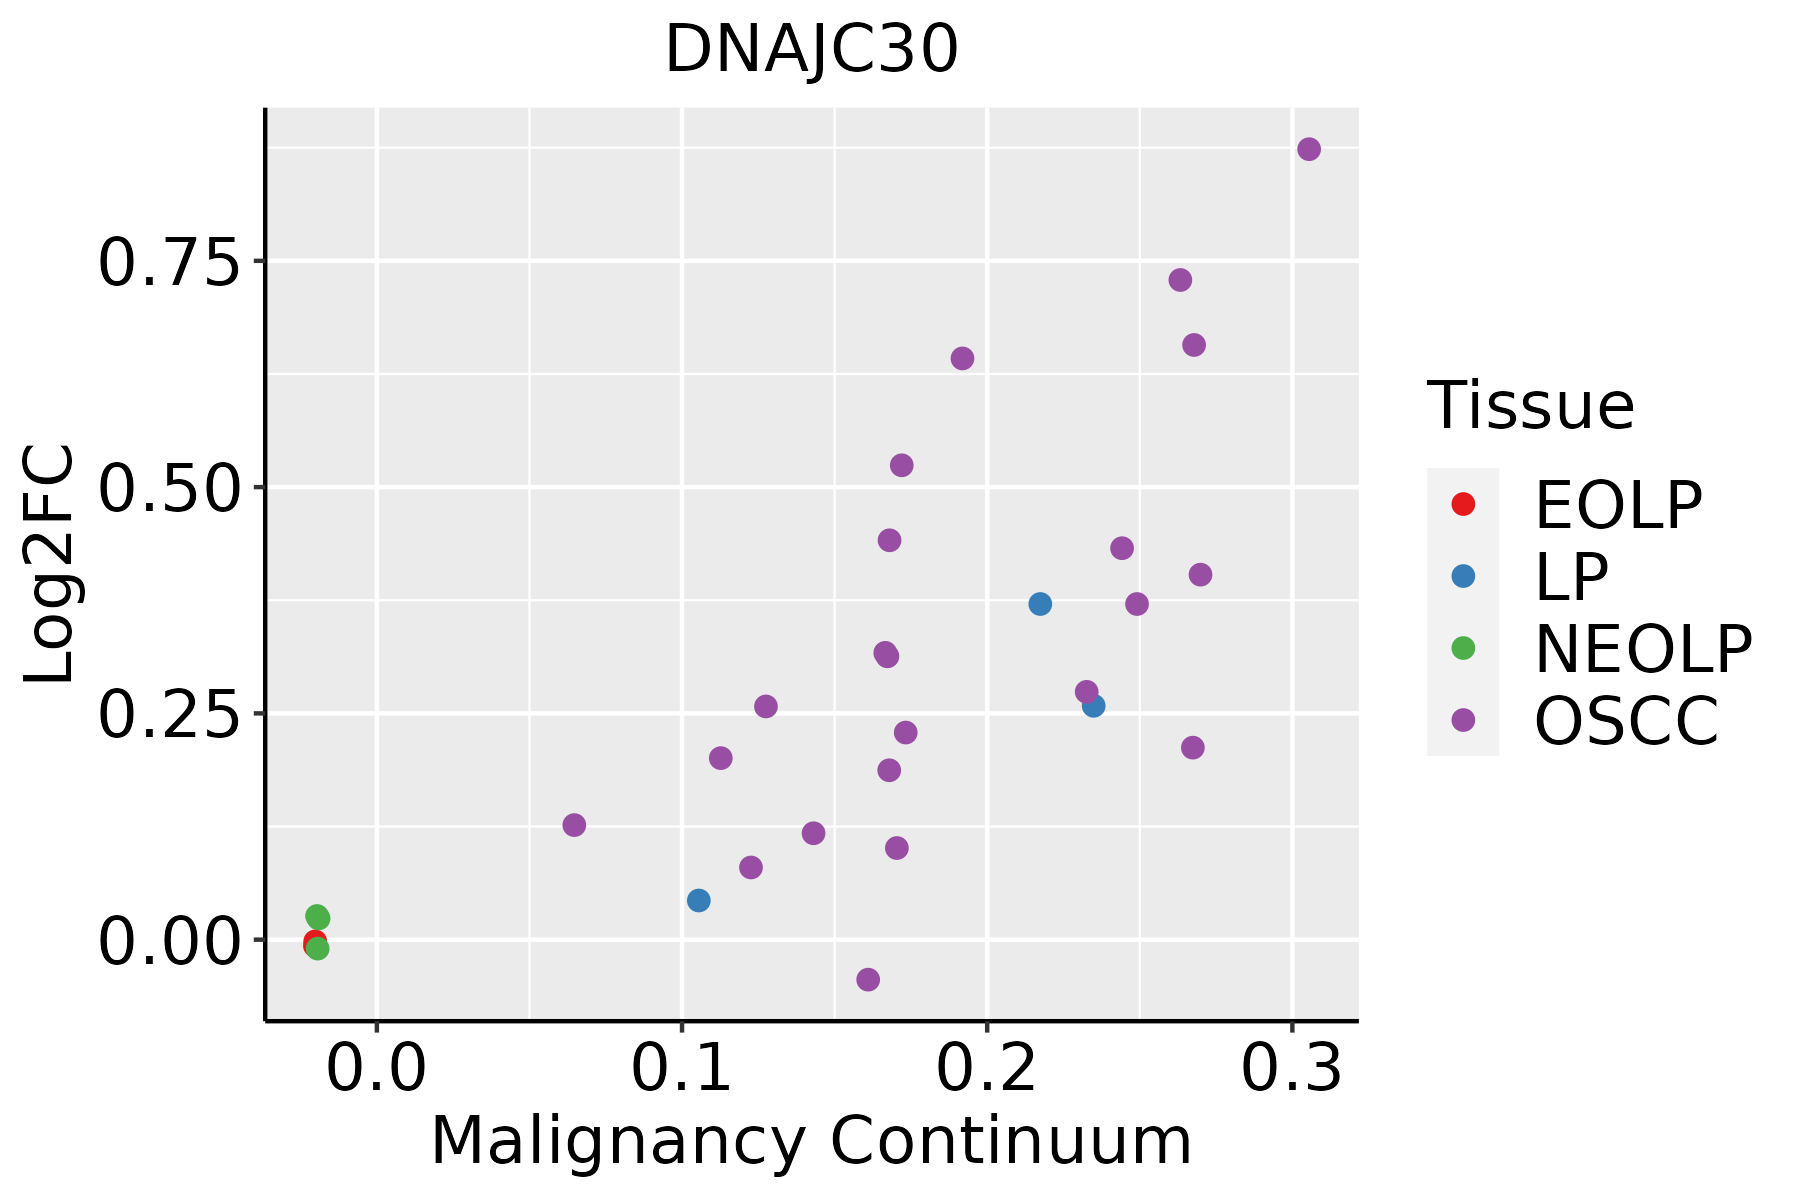 | EOLP: Erosive Oral lichen planus |
| LP: leukoplakia | ||
| NEOLP: Non-erosive oral lichen planus | ||
| OSCC: Oral squamous cell carcinoma | ||
| Thyroid | 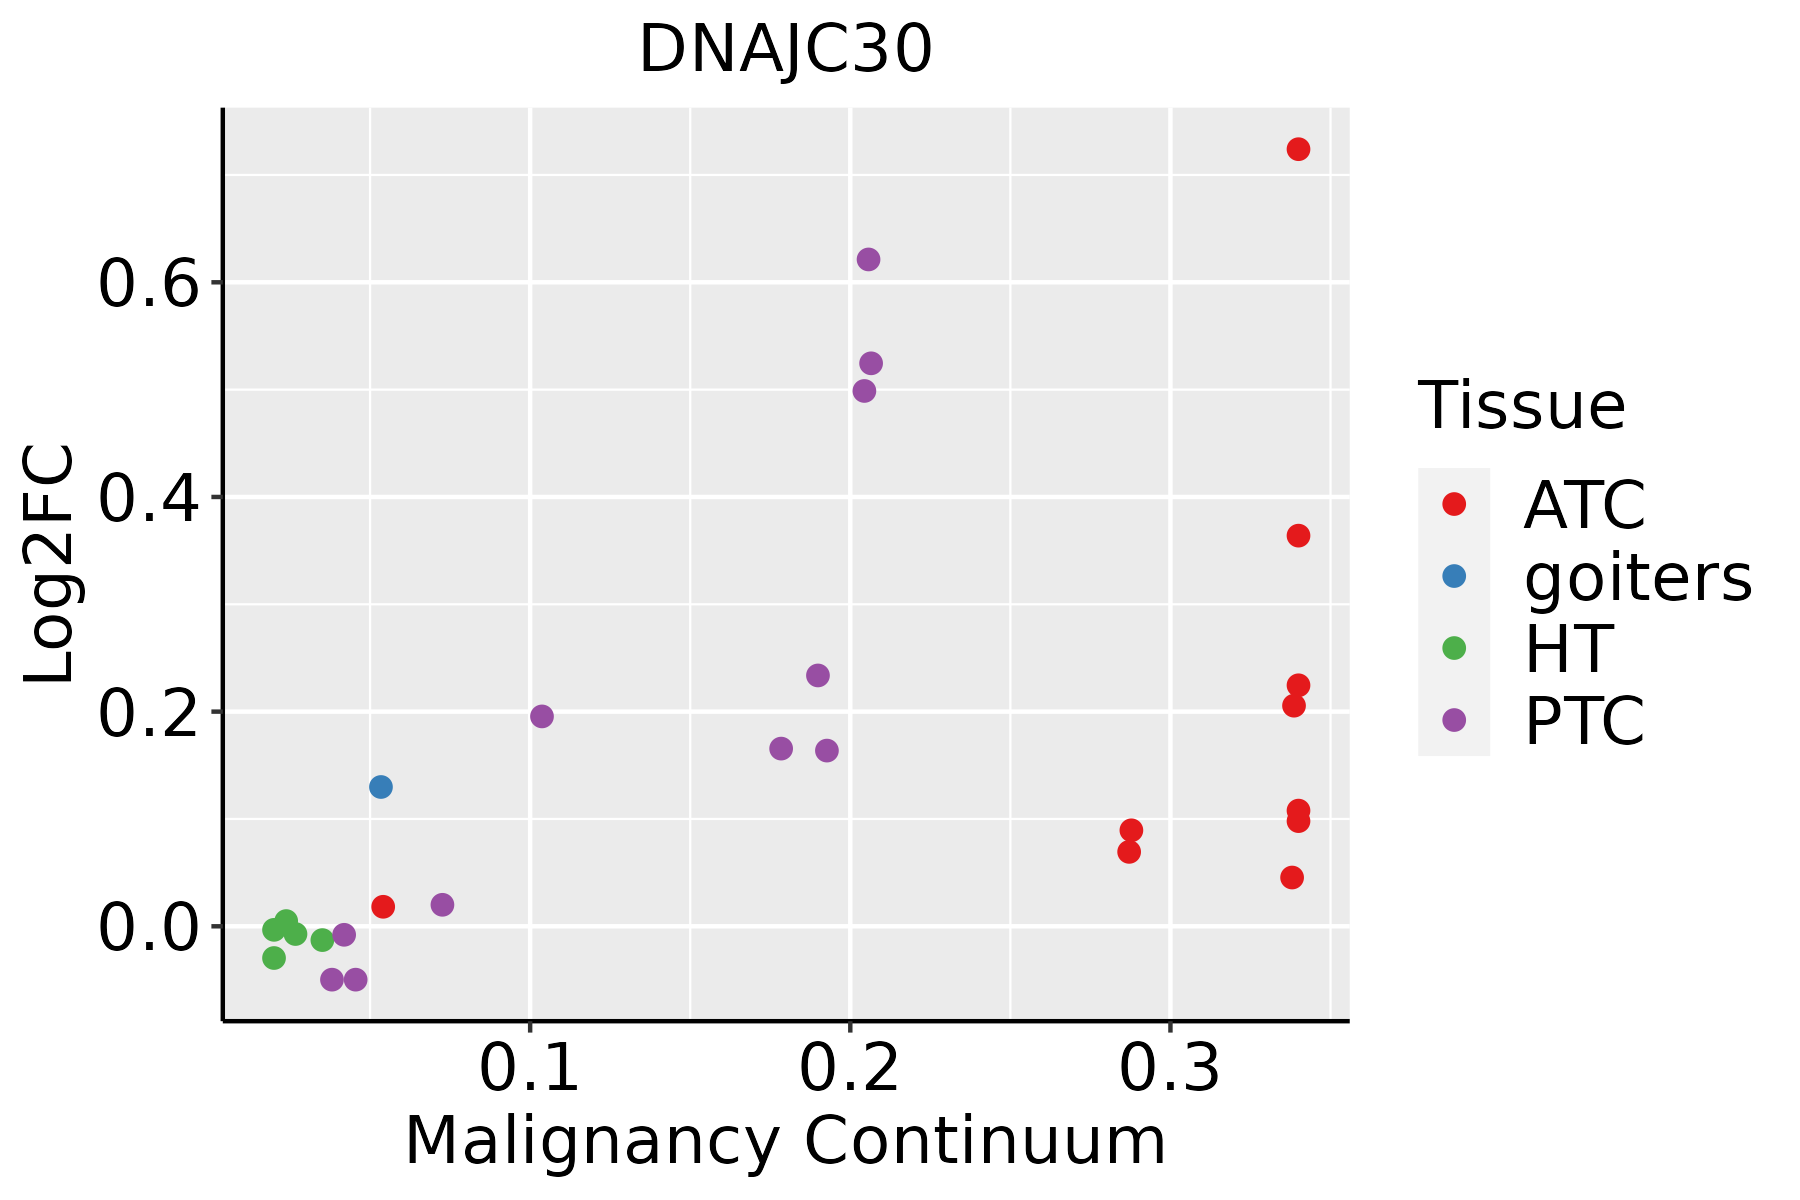 | ATC: Anaplastic thyroid cancer |
| HT: Hashimoto's thyroiditis | ||
| PTC: Papillary thyroid cancer |
| ∗log2FC in expression of this searched gene in stem-like cells from each diseased tissue sample relative to stem-like cells in normal samples in each tissue plotted against the malignancy continuum. Samples are colored based on if they are from different disease stage. |
Top |
Malignant transformation related pathway analysis |
| Find out the enriched GO biological processes and KEGG pathways involved in transition from healthy to precancer to cancer |
| Tissue | Disease Stage | Enriched GO biological Processes |
| Colorectum | AD |  |
| Colorectum | SER |  |
| Colorectum | MSS |  |
| Colorectum | MSI-H |  |
| Colorectum | FAP |  |
| ∗Top 15 enriched GO BP terms are showed in the bar plot of each disease state in each tissue. Each row represents a significant GO biological process which is colored according to the -log10(p.adjust). |
| Page: 1 2 3 4 5 6 7 8 9 |
| GO ID | Tissue | Disease Stage | Description | Gene Ratio | Bg Ratio | pvalue | p.adjust | Count |
| GO:003238618 | Esophagus | ESCC | regulation of intracellular transport | 243/8552 | 337/18723 | 3.20e-23 | 7.25e-21 | 243 |
| GO:0006091110 | Esophagus | ESCC | generation of precursor metabolites and energy | 331/8552 | 490/18723 | 3.86e-23 | 8.45e-21 | 331 |
| GO:0045333110 | Esophagus | ESCC | cellular respiration | 173/8552 | 230/18723 | 4.53e-20 | 5.99e-18 | 173 |
| GO:0006839110 | Esophagus | ESCC | mitochondrial transport | 187/8552 | 254/18723 | 8.35e-20 | 9.81e-18 | 187 |
| GO:0009060110 | Esophagus | ESCC | aerobic respiration | 145/8552 | 189/18723 | 2.16e-18 | 2.21e-16 | 145 |
| GO:0015980110 | Esophagus | ESCC | energy derivation by oxidation of organic compounds | 220/8552 | 318/18723 | 1.20e-17 | 1.09e-15 | 220 |
| GO:0046034111 | Esophagus | ESCC | ATP metabolic process | 189/8552 | 277/18723 | 1.99e-14 | 1.04e-12 | 189 |
| GO:0006119111 | Esophagus | ESCC | oxidative phosphorylation | 106/8552 | 141/18723 | 8.19e-13 | 3.63e-11 | 106 |
| GO:0006753110 | Esophagus | ESCC | nucleoside phosphate metabolic process | 288/8552 | 497/18723 | 1.80e-08 | 3.50e-07 | 288 |
| GO:0019693111 | Esophagus | ESCC | ribose phosphate metabolic process | 234/8552 | 396/18723 | 4.24e-08 | 7.76e-07 | 234 |
| GO:0009117111 | Esophagus | ESCC | nucleotide metabolic process | 282/8552 | 489/18723 | 4.70e-08 | 8.50e-07 | 282 |
| GO:0009141111 | Esophagus | ESCC | nucleoside triphosphate metabolic process | 78/8552 | 112/18723 | 2.36e-07 | 3.59e-06 | 78 |
| GO:1990542110 | Esophagus | ESCC | mitochondrial transmembrane transport | 72/8552 | 102/18723 | 2.94e-07 | 4.23e-06 | 72 |
| GO:0009259111 | Esophagus | ESCC | ribonucleotide metabolic process | 224/8552 | 385/18723 | 4.41e-07 | 6.00e-06 | 224 |
| GO:0072521111 | Esophagus | ESCC | purine-containing compound metabolic process | 238/8552 | 416/18723 | 1.20e-06 | 1.49e-05 | 238 |
| GO:0009150111 | Esophagus | ESCC | purine ribonucleotide metabolic process | 213/8552 | 368/18723 | 1.40e-06 | 1.69e-05 | 213 |
| GO:0046390110 | Esophagus | ESCC | ribose phosphate biosynthetic process | 119/8552 | 190/18723 | 1.73e-06 | 2.06e-05 | 119 |
| GO:0006163111 | Esophagus | ESCC | purine nucleotide metabolic process | 226/8552 | 396/18723 | 2.81e-06 | 3.21e-05 | 226 |
| GO:0009144110 | Esophagus | ESCC | purine nucleoside triphosphate metabolic process | 61/8552 | 88/18723 | 6.06e-06 | 6.23e-05 | 61 |
| GO:000919918 | Esophagus | ESCC | ribonucleoside triphosphate metabolic process | 61/8552 | 89/18723 | 1.07e-05 | 1.01e-04 | 61 |
| Page: 1 2 3 4 5 6 7 8 9 10 11 |
| Pathway ID | Tissue | Disease Stage | Description | Gene Ratio | Bg Ratio | pvalue | p.adjust | qvalue | Count |
| Page: 1 |
Top |
Cell-cell communication analysis |
| Identification of potential cell-cell interactions between two cell types and their ligand-receptor pairs for different disease states |
| Ligand | Receptor | LRpair | Pathway | Tissue | Disease Stage |
| Page: 1 |
Top |
Single-cell gene regulatory network inference analysis |
| Find out the significant the regulons (TFs) and the target genes of each regulon across cell types for different disease states |
| TF | Cell Type | Tissue | Disease Stage | Target Gene | RSS | Regulon Activity |
| ∗The dot plots of a searched regulon are shown for all cell subpopulations in each disease state of each tissue based on the regulon specific score inferred using pySCENIC and by calculating the average expression. |
| Page: 1 |
Top |
Somatic mutation of malignant transformation related genes |
| Annotation of somatic variants for genes involved in malignant transformation |
| Hugo Symbol | Variant Class | Variant Classification | dbSNP RS | HGVSc | HGVSp | HGVSp Short | SWISSPROT | BIOTYPE | SIFT | PolyPhen | Tumor Sample Barcode | Tissue | Histology | Sex | Age | Stage | Therapy Types | Drugs | Outcome |
| DNAJC30 | SNV | Missense_Mutation | c.497C>A | p.Ala166Asp | p.A166D | Q96LL9 | protein_coding | deleterious(0.04) | benign(0.397) | TCGA-AC-A2QI-01 | Breast | breast invasive carcinoma | Female | >=65 | III/IV | Chemotherapy | cytoxan | CR | |
| DNAJC30 | SNV | Missense_Mutation | c.206N>G | p.Tyr69Cys | p.Y69C | Q96LL9 | protein_coding | deleterious(0) | probably_damaging(1) | TCGA-AO-A128-01 | Breast | breast invasive carcinoma | Female | <65 | I/II | Chemotherapy | doxorubicin | SD | |
| DNAJC30 | SNV | Missense_Mutation | c.582N>T | p.Glu194Asp | p.E194D | Q96LL9 | protein_coding | deleterious(0.04) | benign(0.079) | TCGA-AA-A010-01 | Colorectum | colon adenocarcinoma | Female | <65 | I/II | Chemotherapy | folinic | CR | |
| DNAJC30 | SNV | Missense_Mutation | rs137909145 | c.520G>A | p.Glu174Lys | p.E174K | Q96LL9 | protein_coding | deleterious(0) | possibly_damaging(0.859) | TCGA-AG-4007-01 | Colorectum | rectum adenocarcinoma | Male | >=65 | III/IV | Unknown | Unknown | SD |
| DNAJC30 | SNV | Missense_Mutation | rs782201231 | c.169N>T | p.Pro57Ser | p.P57S | Q96LL9 | protein_coding | tolerated(0.62) | benign(0.029) | TCGA-AG-A00Y-01 | Colorectum | rectum adenocarcinoma | Male | >=65 | I/II | Unknown | Unknown | PD |
| DNAJC30 | SNV | Missense_Mutation | c.107N>A | p.Arg36Lys | p.R36K | Q96LL9 | protein_coding | deleterious(0.03) | benign(0.015) | TCGA-AP-A0LM-01 | Endometrium | uterine corpus endometrioid carcinoma | Female | <65 | III/IV | Chemotherapy | cisplatin | SD | |
| DNAJC30 | SNV | Missense_Mutation | novel | c.233N>T | p.Pro78Leu | p.P78L | Q96LL9 | protein_coding | deleterious(0) | probably_damaging(0.996) | TCGA-KP-A3W1-01 | Endometrium | uterine corpus endometrioid carcinoma | Female | >=65 | I/II | Unknown | Unknown | SD |
| DNAJC30 | SNV | Missense_Mutation | novel | c.273N>G | p.Phe91Leu | p.F91L | Q96LL9 | protein_coding | deleterious(0) | probably_damaging(0.998) | TCGA-86-7711-01 | Lung | lung adenocarcinoma | Male | >=65 | I/II | Chemotherapy | cisplatin | PD |
| DNAJC30 | SNV | Missense_Mutation | novel | c.599N>T | p.Gly200Val | p.G200V | Q96LL9 | protein_coding | deleterious(0.02) | possibly_damaging(0.66) | TCGA-37-4132-01 | Lung | lung squamous cell carcinoma | Female | <65 | III/IV | Unknown | Unknown | SD |
| DNAJC30 | SNV | Missense_Mutation | novel | c.251N>T | p.Ser84Ile | p.S84I | Q96LL9 | protein_coding | deleterious(0) | probably_damaging(0.93) | TCGA-52-7809-01 | Lung | lung squamous cell carcinoma | Male | >=65 | I/II | Unknown | Unknown | PD |
| Page: 1 2 |
Top |
Related drugs of malignant transformation related genes |
| Identification of chemicals and drugs interact with genes involved in malignant transfromation |
| (DGIdb 4.0) |
| Entrez ID | Symbol | Category | Interaction Types | Drug Claim Name | Drug Name | PMIDs |
| Page: 1 |

Copyright 2023-Present -The University of Texas Health Science Center at Houston |