| Tissue | Expression Dynamics | Abbreviation |
| Esophagus | 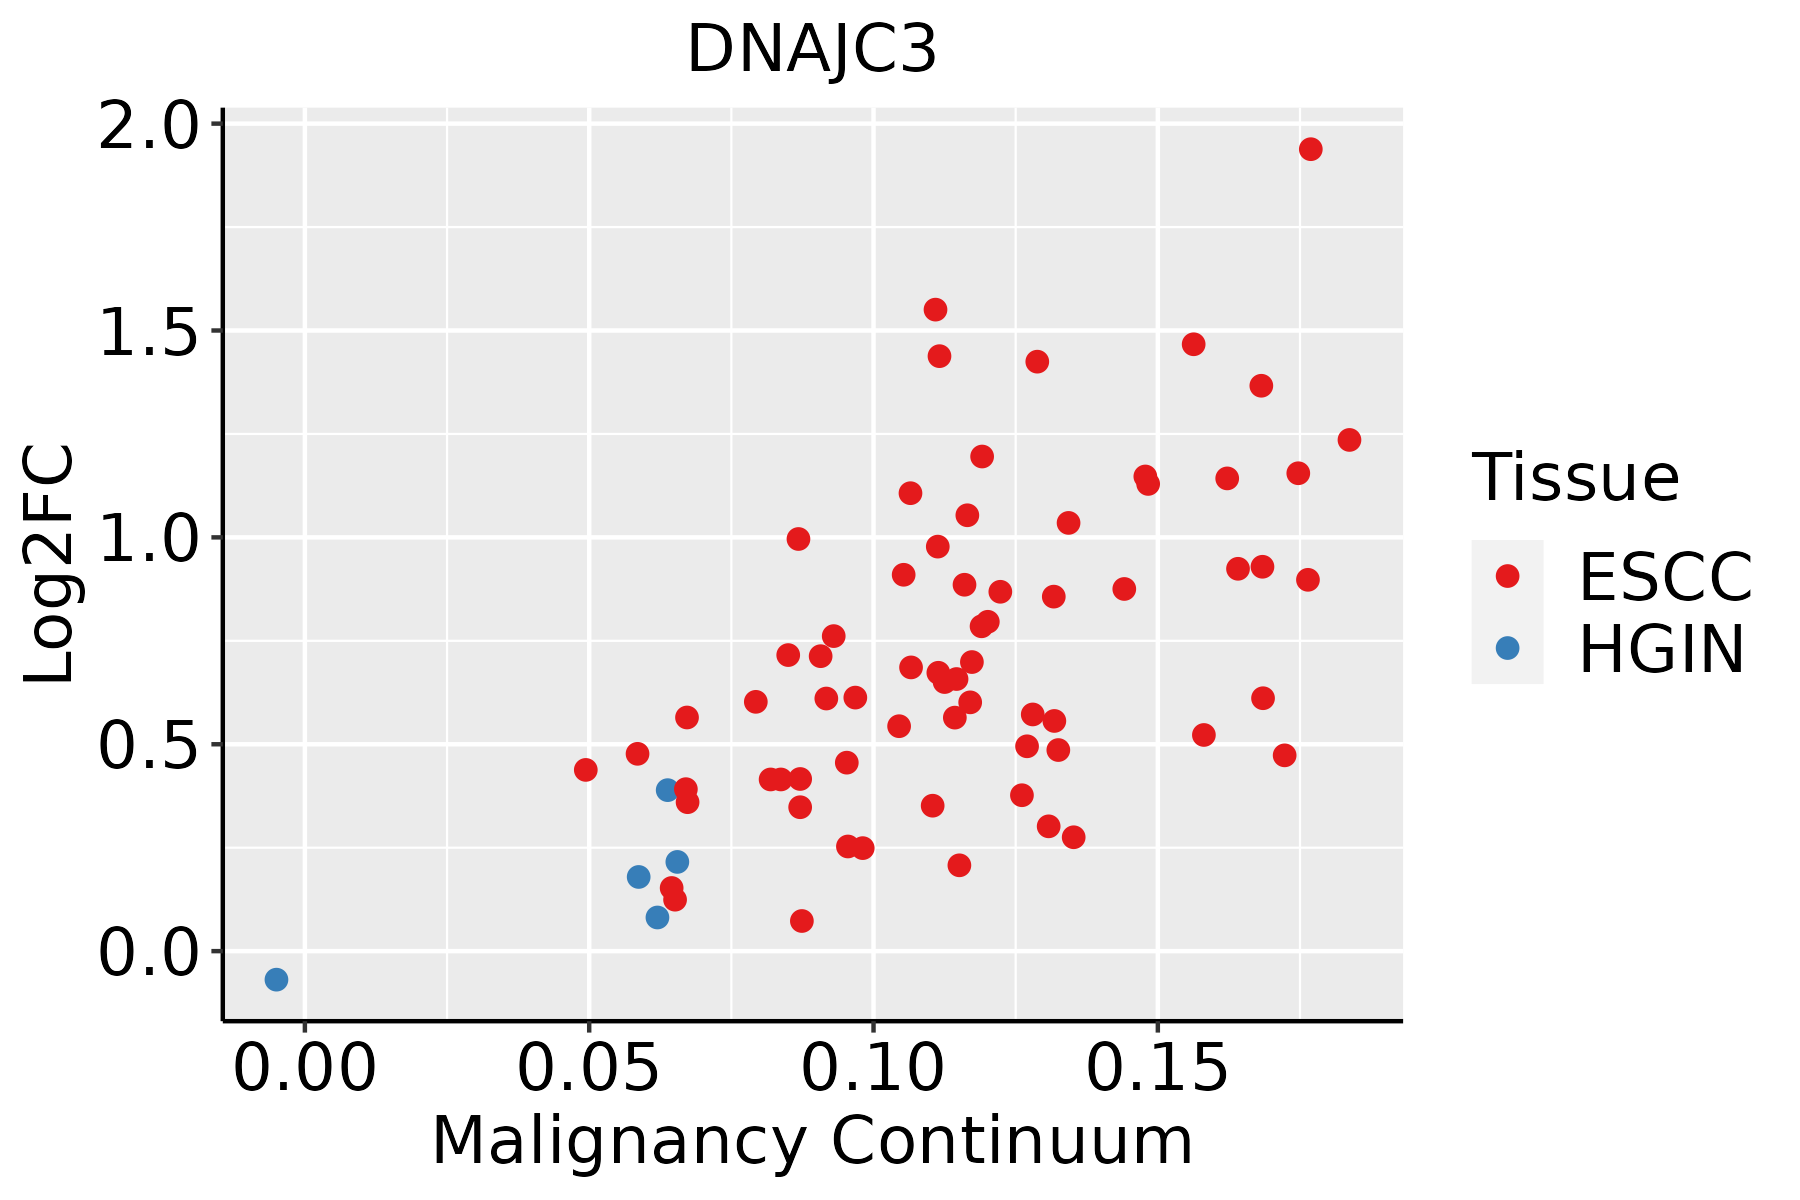 | ESCC: Esophageal squamous cell carcinoma |
| HGIN: High-grade intraepithelial neoplasias |
| LGIN: Low-grade intraepithelial neoplasias |
| Liver | 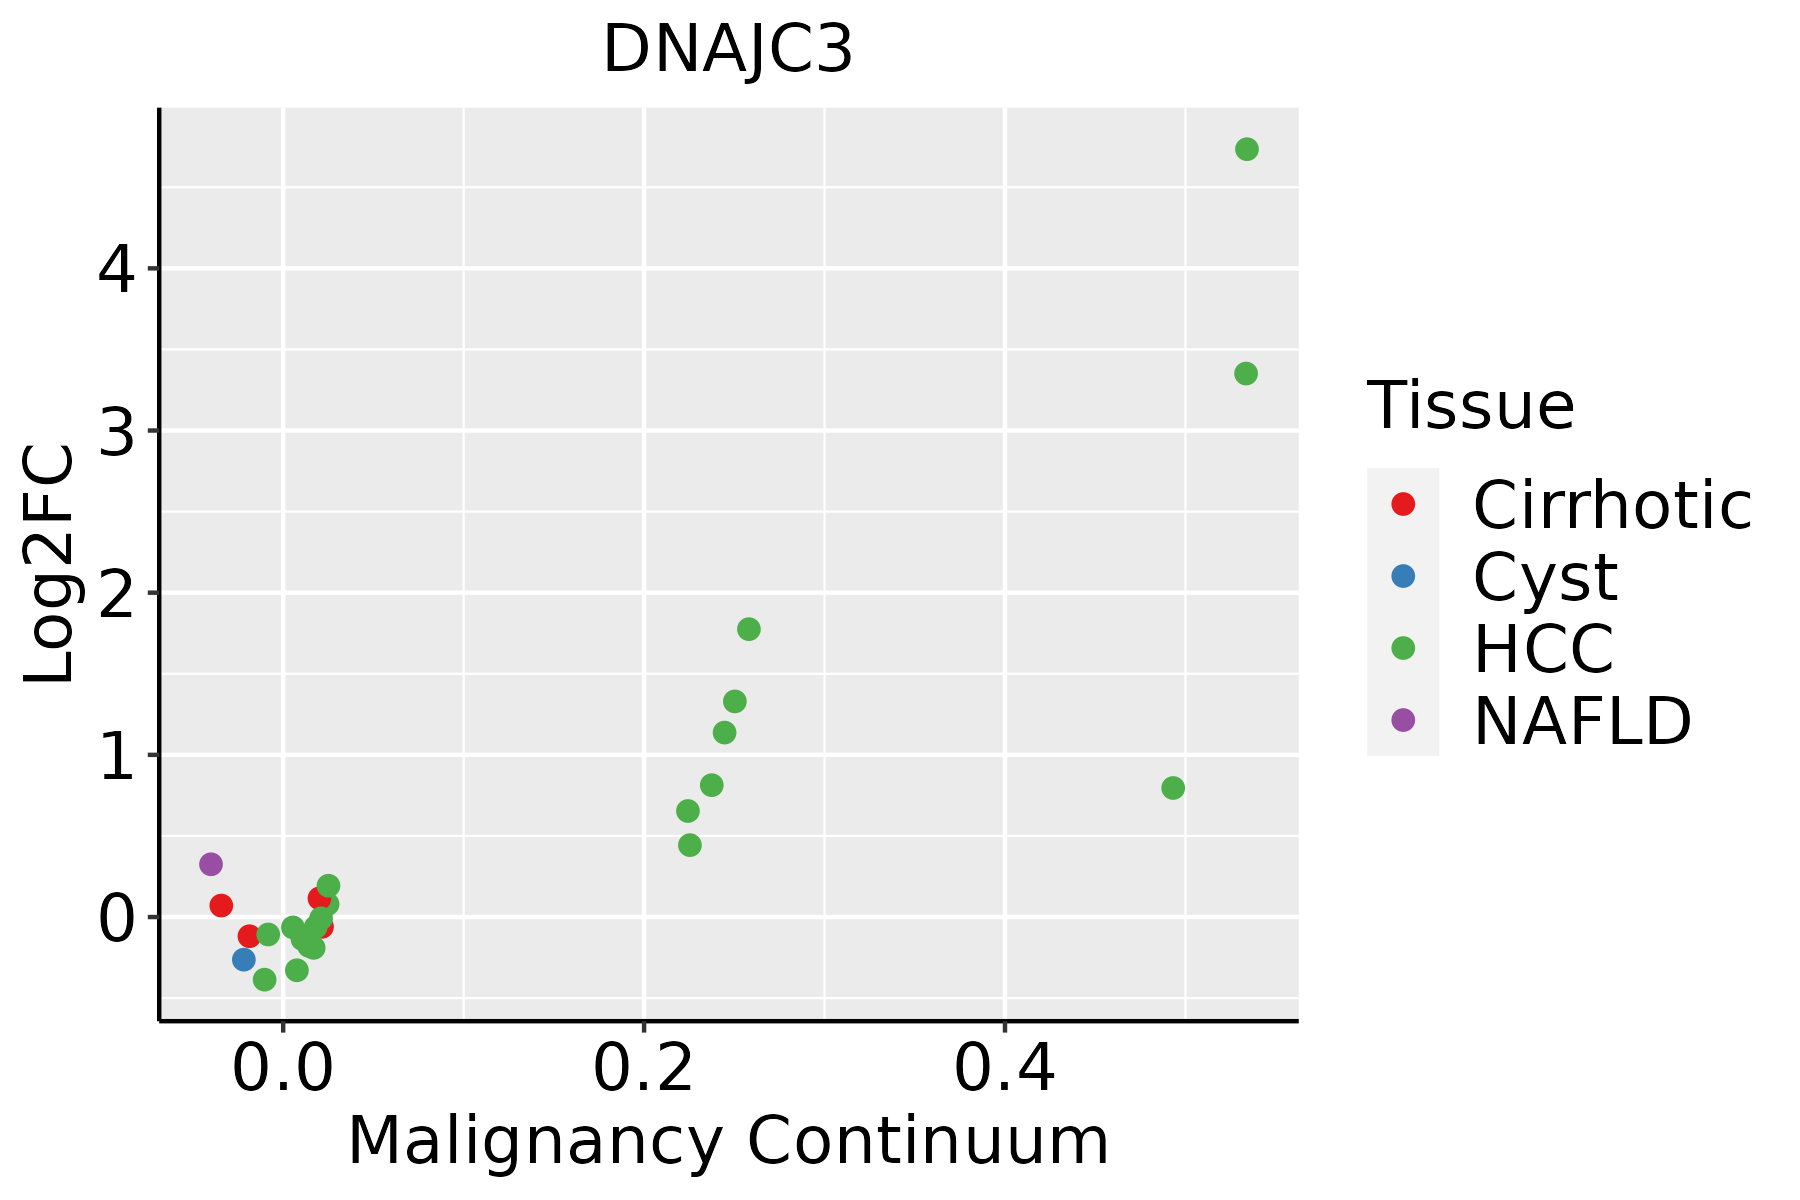 | HCC: Hepatocellular carcinoma |
| NAFLD: Non-alcoholic fatty liver disease |
| Lung | 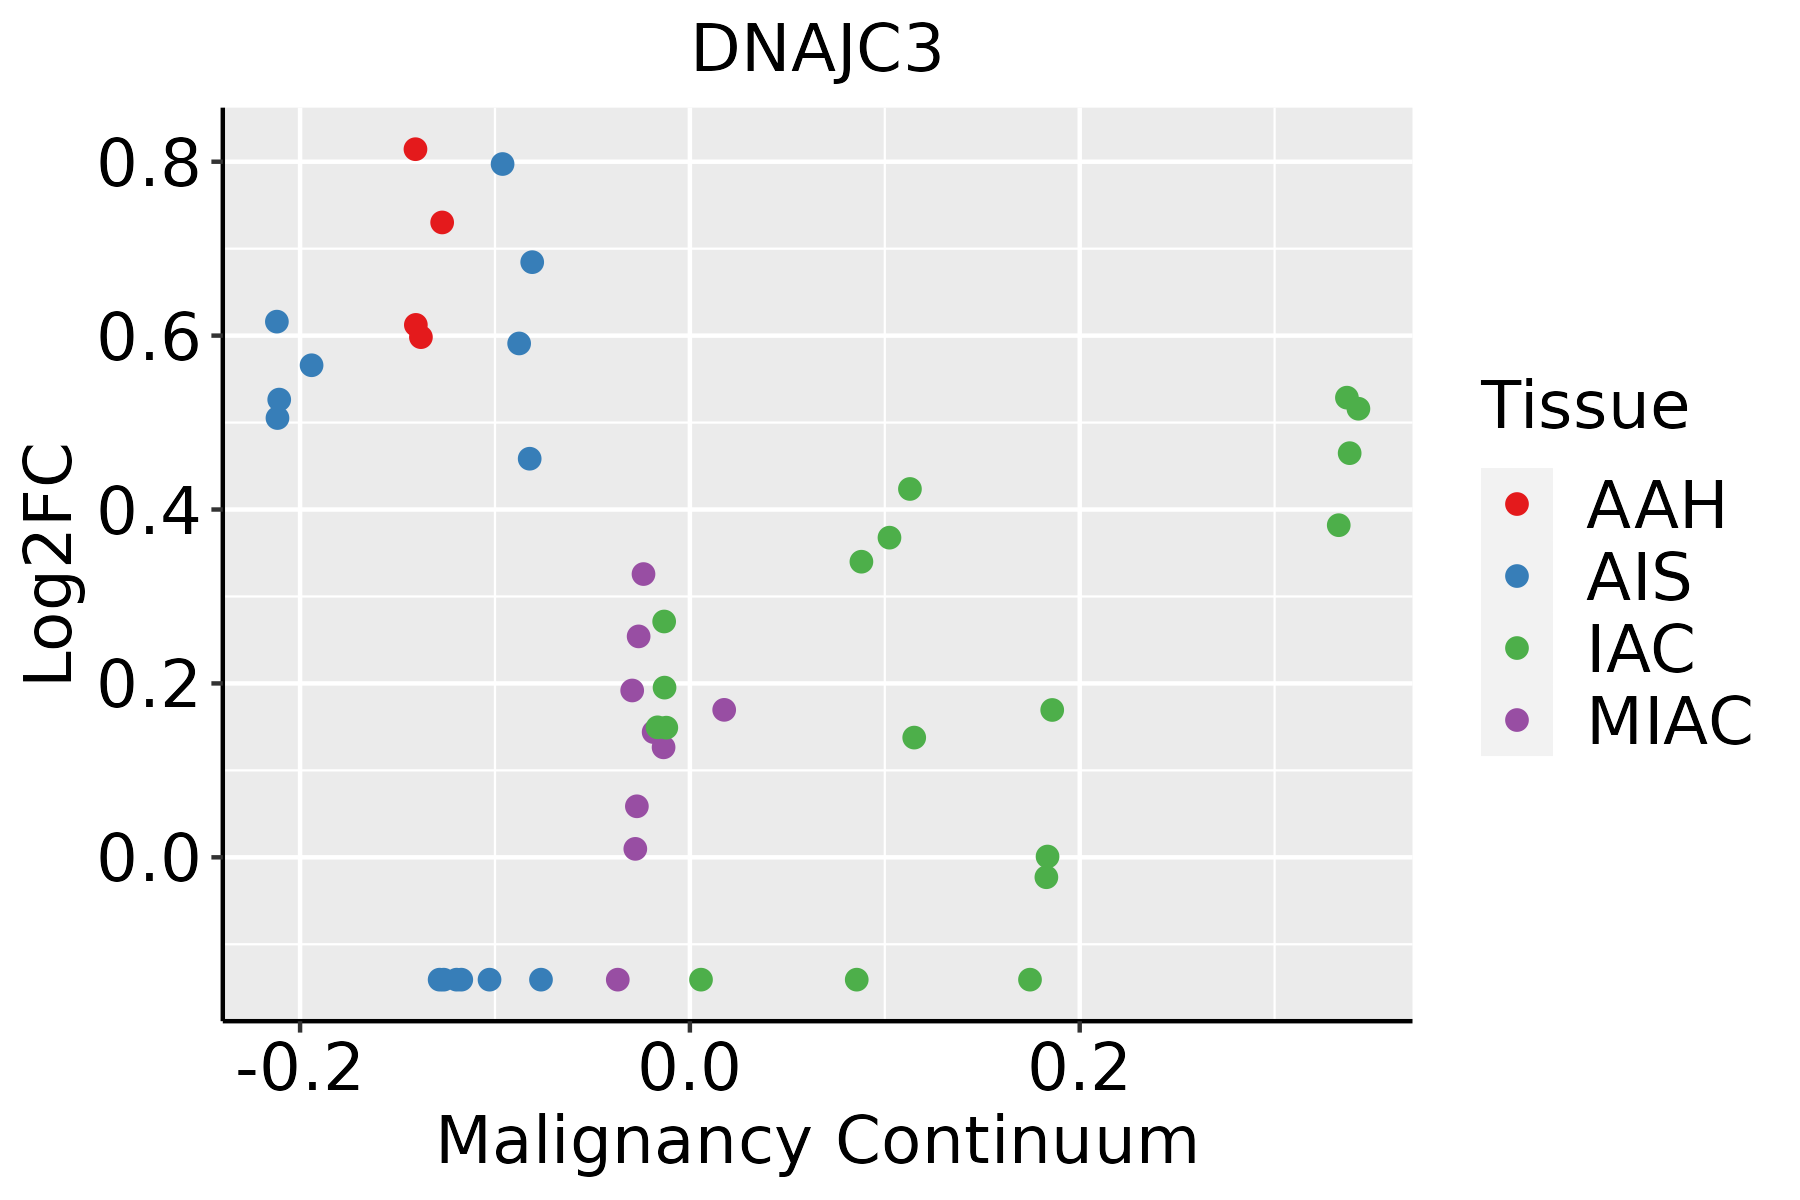 | AAH: Atypical adenomatous hyperplasia |
| AIS: Adenocarcinoma in situ |
| IAC: Invasive lung adenocarcinoma |
| MIA: Minimally invasive adenocarcinoma |
| Oral Cavity |  | EOLP: Erosive Oral lichen planus |
| LP: leukoplakia |
| NEOLP: Non-erosive oral lichen planus |
| OSCC: Oral squamous cell carcinoma |
| Prostate | 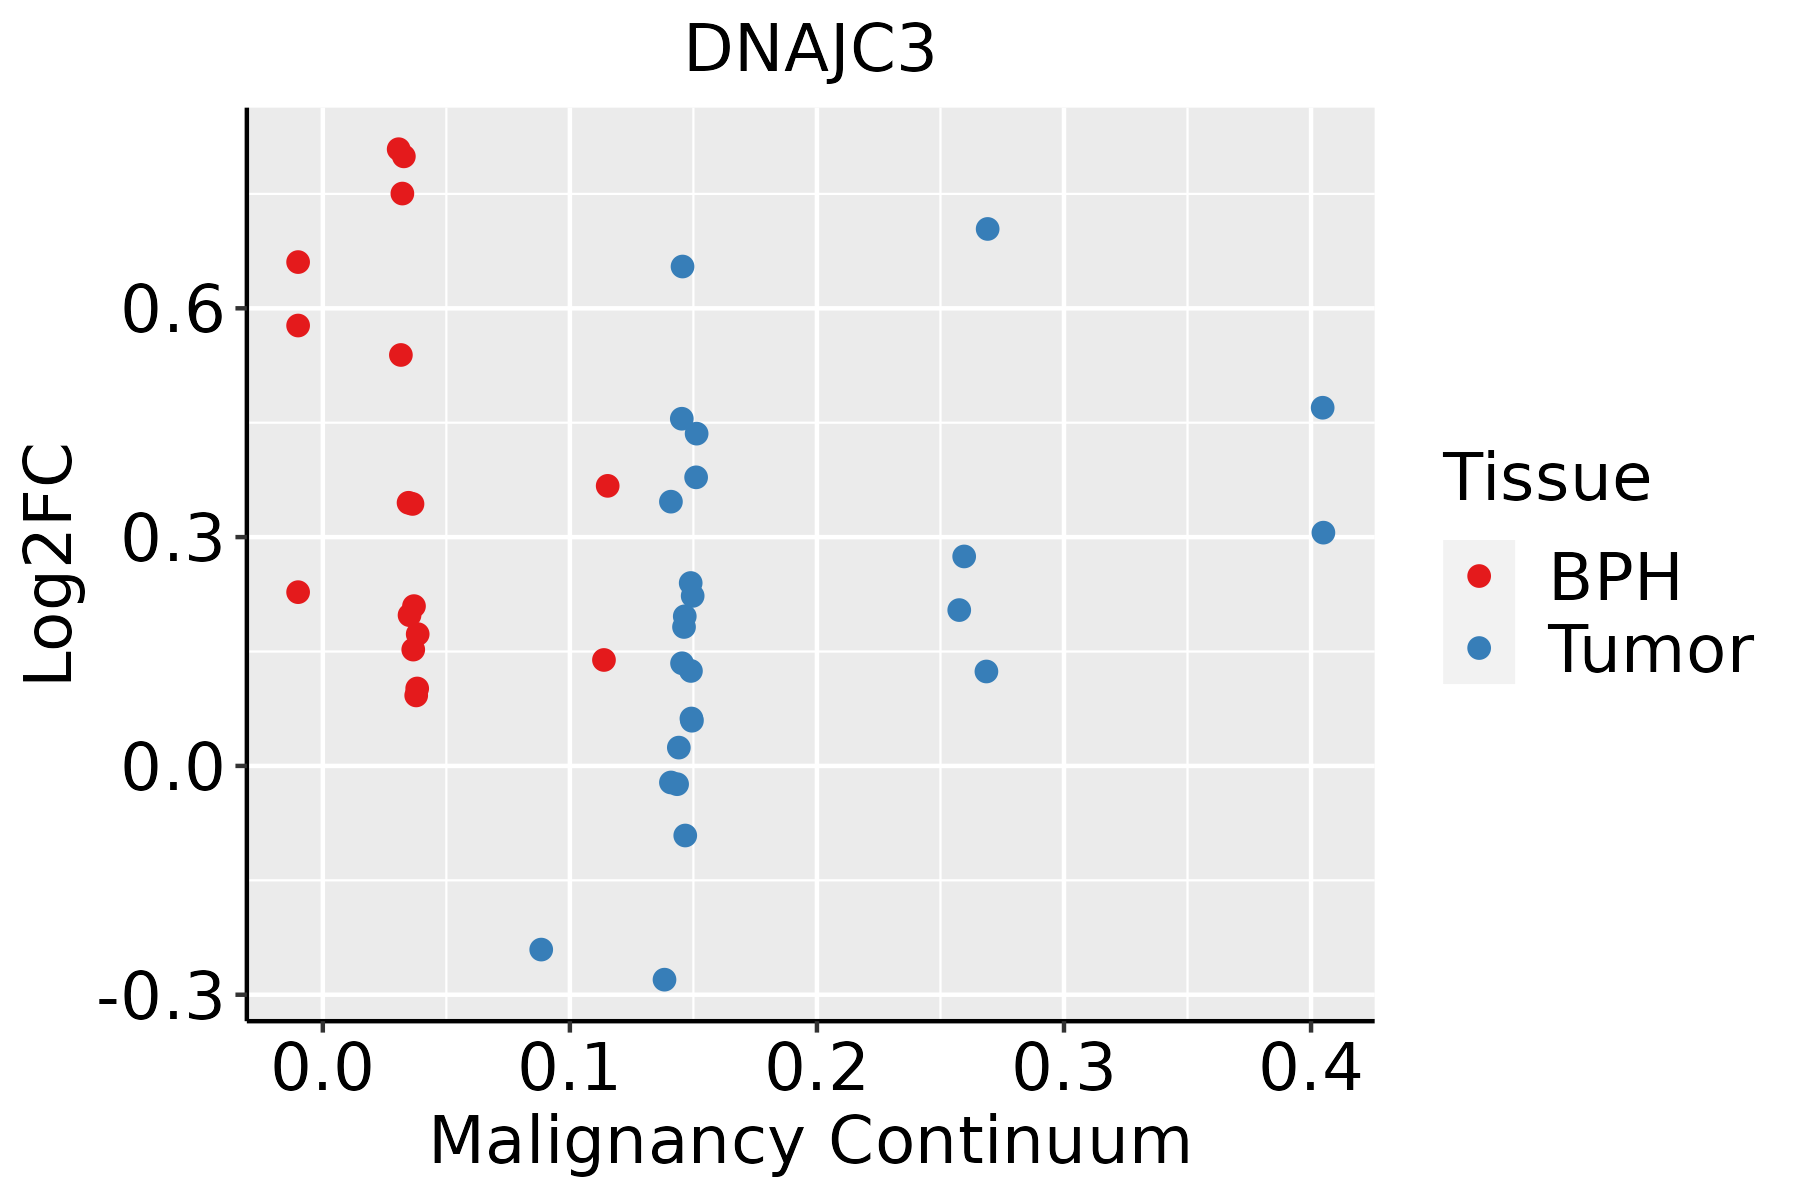 | BPH: Benign Prostatic Hyperplasia |
| Skin |  | AK: Actinic keratosis |
| cSCC: Cutaneous squamous cell carcinoma |
| SCCIS:squamous cell carcinoma in situ |
| Thyroid |  | ATC: Anaplastic thyroid cancer |
| HT: Hashimoto's thyroiditis |
| PTC: Papillary thyroid cancer |
| GO ID | Tissue | Disease Stage | Description | Gene Ratio | Bg Ratio | pvalue | p.adjust | Count |
| GO:000641727 | Esophagus | HGIN | regulation of translation | 139/2587 | 468/18723 | 1.46e-19 | 7.98e-17 | 139 |
| GO:000641320 | Esophagus | HGIN | translational initiation | 55/2587 | 118/18723 | 7.33e-18 | 2.31e-15 | 55 |
| GO:000645720 | Esophagus | HGIN | protein folding | 75/2587 | 212/18723 | 1.61e-15 | 3.86e-13 | 75 |
| GO:003497625 | Esophagus | HGIN | response to endoplasmic reticulum stress | 81/2587 | 256/18723 | 1.47e-13 | 2.32e-11 | 81 |
| GO:004572720 | Esophagus | HGIN | positive regulation of translation | 49/2587 | 136/18723 | 5.88e-11 | 6.30e-09 | 49 |
| GO:003596625 | Esophagus | HGIN | response to topologically incorrect protein | 54/2587 | 159/18723 | 8.53e-11 | 8.89e-09 | 54 |
| GO:000644610 | Esophagus | HGIN | regulation of translational initiation | 34/2587 | 79/18723 | 2.09e-10 | 1.97e-08 | 34 |
| GO:000698625 | Esophagus | HGIN | response to unfolded protein | 48/2587 | 137/18723 | 2.80e-10 | 2.54e-08 | 48 |
| GO:003425020 | Esophagus | HGIN | positive regulation of cellular amide metabolic process | 53/2587 | 162/18723 | 6.01e-10 | 5.15e-08 | 53 |
| GO:00435555 | Esophagus | HGIN | regulation of translation in response to stress | 10/2587 | 20/18723 | 1.22e-04 | 2.53e-03 | 10 |
| GO:004593626 | Esophagus | HGIN | negative regulation of phosphate metabolic process | 89/2587 | 441/18723 | 1.24e-04 | 2.54e-03 | 89 |
| GO:001056326 | Esophagus | HGIN | negative regulation of phosphorus metabolic process | 89/2587 | 442/18723 | 1.34e-04 | 2.71e-03 | 89 |
| GO:004232620 | Esophagus | HGIN | negative regulation of phosphorylation | 78/2587 | 385/18723 | 2.77e-04 | 4.77e-03 | 78 |
| GO:000926618 | Esophagus | HGIN | response to temperature stimulus | 42/2587 | 178/18723 | 2.91e-04 | 4.98e-03 | 42 |
| GO:000193320 | Esophagus | HGIN | negative regulation of protein phosphorylation | 69/2587 | 342/18723 | 6.81e-04 | 9.26e-03 | 69 |
| GO:00435585 | Esophagus | HGIN | regulation of translational initiation in response to stress | 7/2587 | 14/18723 | 1.34e-03 | 1.57e-02 | 7 |
| GO:00364905 | Esophagus | HGIN | regulation of translation in response to endoplasmic reticulum stress | 6/2587 | 11/18723 | 1.71e-03 | 1.86e-02 | 6 |
| GO:000961517 | Esophagus | HGIN | response to virus | 69/2587 | 367/18723 | 4.39e-03 | 3.86e-02 | 69 |
| GO:003238618 | Esophagus | ESCC | regulation of intracellular transport | 243/8552 | 337/18723 | 3.20e-23 | 7.25e-21 | 243 |
| GO:0006091110 | Esophagus | ESCC | generation of precursor metabolites and energy | 331/8552 | 490/18723 | 3.86e-23 | 8.45e-21 | 331 |
| Pathway ID | Tissue | Disease Stage | Description | Gene Ratio | Bg Ratio | pvalue | p.adjust | qvalue | Count |
| hsa0414139 | Esophagus | HGIN | Protein processing in endoplasmic reticulum | 67/1383 | 174/8465 | 1.06e-12 | 2.16e-11 | 1.72e-11 | 67 |
| hsa0516420 | Esophagus | HGIN | Influenza A | 42/1383 | 171/8465 | 3.41e-03 | 2.54e-02 | 2.02e-02 | 42 |
| hsa04141114 | Esophagus | HGIN | Protein processing in endoplasmic reticulum | 67/1383 | 174/8465 | 1.06e-12 | 2.16e-11 | 1.72e-11 | 67 |
| hsa05164110 | Esophagus | HGIN | Influenza A | 42/1383 | 171/8465 | 3.41e-03 | 2.54e-02 | 2.02e-02 | 42 |
| hsa04141211 | Esophagus | ESCC | Protein processing in endoplasmic reticulum | 147/4205 | 174/8465 | 3.29e-22 | 1.10e-19 | 5.64e-20 | 147 |
| hsa0516425 | Esophagus | ESCC | Influenza A | 122/4205 | 171/8465 | 5.01e-09 | 4.79e-08 | 2.45e-08 | 122 |
| hsa04141310 | Esophagus | ESCC | Protein processing in endoplasmic reticulum | 147/4205 | 174/8465 | 3.29e-22 | 1.10e-19 | 5.64e-20 | 147 |
| hsa0516435 | Esophagus | ESCC | Influenza A | 122/4205 | 171/8465 | 5.01e-09 | 4.79e-08 | 2.45e-08 | 122 |
| hsa0414114 | Liver | Cirrhotic | Protein processing in endoplasmic reticulum | 114/2530 | 174/8465 | 1.16e-22 | 9.67e-21 | 5.96e-21 | 114 |
| hsa0516410 | Liver | Cirrhotic | Influenza A | 66/2530 | 171/8465 | 8.56e-03 | 2.91e-02 | 1.79e-02 | 66 |
| hsa0414115 | Liver | Cirrhotic | Protein processing in endoplasmic reticulum | 114/2530 | 174/8465 | 1.16e-22 | 9.67e-21 | 5.96e-21 | 114 |
| hsa0516411 | Liver | Cirrhotic | Influenza A | 66/2530 | 171/8465 | 8.56e-03 | 2.91e-02 | 1.79e-02 | 66 |
| hsa0414122 | Liver | HCC | Protein processing in endoplasmic reticulum | 146/4020 | 174/8465 | 7.34e-24 | 2.46e-21 | 1.37e-21 | 146 |
| hsa0516421 | Liver | HCC | Influenza A | 101/4020 | 171/8465 | 1.41e-03 | 5.07e-03 | 2.82e-03 | 101 |
| hsa0414132 | Liver | HCC | Protein processing in endoplasmic reticulum | 146/4020 | 174/8465 | 7.34e-24 | 2.46e-21 | 1.37e-21 | 146 |
| hsa0516431 | Liver | HCC | Influenza A | 101/4020 | 171/8465 | 1.41e-03 | 5.07e-03 | 2.82e-03 | 101 |
| hsa0414116 | Lung | IAC | Protein processing in endoplasmic reticulum | 37/1053 | 174/8465 | 6.53e-04 | 5.73e-03 | 3.81e-03 | 37 |
| hsa0516412 | Lung | IAC | Influenza A | 35/1053 | 171/8465 | 1.82e-03 | 1.00e-02 | 6.66e-03 | 35 |
| hsa0414117 | Lung | IAC | Protein processing in endoplasmic reticulum | 37/1053 | 174/8465 | 6.53e-04 | 5.73e-03 | 3.81e-03 | 37 |
| hsa0516413 | Lung | IAC | Influenza A | 35/1053 | 171/8465 | 1.82e-03 | 1.00e-02 | 6.66e-03 | 35 |
| Hugo Symbol | Variant Class | Variant Classification | dbSNP RS | HGVSc | HGVSp | HGVSp Short | SWISSPROT | BIOTYPE | SIFT | PolyPhen | Tumor Sample Barcode | Tissue | Histology | Sex | Age | Stage | Therapy Types | Drugs | Outcome |
| DNAJC3 | SNV | Missense_Mutation | | c.1090G>A | p.Glu364Lys | p.E364K | Q13217 | protein_coding | tolerated(0.34) | benign(0.021) | TCGA-A2-A0EY-01 | Breast | breast invasive carcinoma | Female | <65 | I/II | Chemotherapy | adriamycin | SD |
| DNAJC3 | SNV | Missense_Mutation | rs533997604 | c.467G>A | p.Arg156His | p.R156H | Q13217 | protein_coding | tolerated(0.22) | benign(0.005) | TCGA-AN-A0AK-01 | Breast | breast invasive carcinoma | Female | >=65 | I/II | Unknown | Unknown | SD |
| DNAJC3 | SNV | Missense_Mutation | | c.640N>A | p.Ala214Thr | p.A214T | Q13217 | protein_coding | tolerated(0.93) | benign(0.003) | TCGA-C8-A26Z-01 | Breast | breast invasive carcinoma | Female | <65 | I/II | Hormone Therapy | tamoxiphen | CR |
| DNAJC3 | SNV | Missense_Mutation | rs778884455 | c.1423N>A | p.Gly475Ser | p.G475S | Q13217 | protein_coding | tolerated(0.35) | benign(0.124) | TCGA-D8-A1Y1-01 | Breast | breast invasive carcinoma | Female | >=65 | III/IV | Hormone Therapy | tamoxiphen | PD |
| DNAJC3 | SNV | Missense_Mutation | novel | c.337C>G | p.His113Asp | p.H113D | Q13217 | protein_coding | deleterious(0.02) | benign(0.132) | TCGA-E9-A226-01 | Breast | breast invasive carcinoma | Female | <65 | III/IV | Hormone Therapy | tamoxiphen | PD |
| DNAJC3 | insertion | Frame_Shift_Ins | novel | c.596dupT | p.Glu201ArgfsTer5 | p.E201Rfs*5 | Q13217 | protein_coding | | | TCGA-A8-A07J-01 | Breast | breast invasive carcinoma | Female | <65 | I/II | Chemotherapy | 5-fluorouracil | CR |
| DNAJC3 | insertion | Nonsense_Mutation | novel | c.597_598insTTGTAAGGCACATTTATATACTTCGACATGTCACATACCAC | p.Lys200LeufsTer2 | p.K200Lfs*2 | Q13217 | protein_coding | | | TCGA-A8-A07J-01 | Breast | breast invasive carcinoma | Female | <65 | I/II | Chemotherapy | 5-fluorouracil | CR |
| DNAJC3 | SNV | Missense_Mutation | rs144153992 | c.1483G>A | p.Gly495Arg | p.G495R | Q13217 | protein_coding | deleterious(0) | possibly_damaging(0.904) | TCGA-2W-A8YY-01 | Cervix | cervical & endocervical cancer | Female | <65 | I/II | Chemotherapy | cisplatin | CR |
| DNAJC3 | SNV | Missense_Mutation | | c.917T>C | p.Val306Ala | p.V306A | Q13217 | protein_coding | tolerated(0.46) | benign(0) | TCGA-AA-3815-01 | Colorectum | colon adenocarcinoma | Female | >=65 | I/II | Unknown | Unknown | SD |
| DNAJC3 | SNV | Missense_Mutation | novel | c.82N>A | p.Gly28Ser | p.G28S | Q13217 | protein_coding | tolerated(0.13) | benign(0.013) | TCGA-AA-3949-01 | Colorectum | colon adenocarcinoma | Female | >=65 | III/IV | Unknown | Unknown | SD |


