
|
|||||
|
 | |
| |
| |
| |
| |
| |
|
Gene: DNAJC22 |
Gene summary for DNAJC22 |
| Gene information | Species | Human | Gene symbol | DNAJC22 | Gene ID | 79962 |
| Gene name | DnaJ heat shock protein family (Hsp40) member C22 | |
| Gene Alias | wus | |
| Cytomap | 12q13.12 | |
| Gene Type | protein-coding | GO ID | GO:0005575 | UniProtAcc | A0A024R0Z2 |
Top |
Malignant transformation analysis |
| Identification of the aberrant gene expression in precancerous and cancerous lesions by comparing the gene expression of stem-like cells in diseased tissues with normal stem cells |
| Entrez ID | Symbol | Replicates | Species | Organ | Tissue | Adj P-value | Log2FC | Malignancy |
| 79962 | DNAJC22 | HTA11_2487_2000001011 | Human | Colorectum | SER | 3.09e-06 | 3.08e-01 | -0.1808 |
| 79962 | DNAJC22 | HTA11_1938_2000001011 | Human | Colorectum | AD | 1.39e-06 | 3.37e-01 | -0.0811 |
| 79962 | DNAJC22 | HTA11_78_2000001011 | Human | Colorectum | AD | 6.73e-04 | 2.87e-01 | -0.1088 |
| 79962 | DNAJC22 | HTA11_347_2000001011 | Human | Colorectum | AD | 4.99e-25 | 6.18e-01 | -0.1954 |
| 79962 | DNAJC22 | HTA11_411_2000001011 | Human | Colorectum | SER | 4.24e-04 | 7.43e-01 | -0.2602 |
| 79962 | DNAJC22 | HTA11_2112_2000001011 | Human | Colorectum | SER | 6.16e-08 | 8.00e-01 | -0.2196 |
| 79962 | DNAJC22 | HTA11_83_2000001011 | Human | Colorectum | SER | 1.34e-04 | 4.03e-01 | -0.1526 |
| 79962 | DNAJC22 | HTA11_696_2000001011 | Human | Colorectum | AD | 1.94e-06 | 3.68e-01 | -0.1464 |
| 79962 | DNAJC22 | HTA11_866_2000001011 | Human | Colorectum | AD | 2.39e-07 | 3.53e-01 | -0.1001 |
| 79962 | DNAJC22 | HTA11_1391_2000001011 | Human | Colorectum | AD | 2.83e-09 | 3.53e-01 | -0.059 |
| 79962 | DNAJC22 | HTA11_546_2000001011 | Human | Colorectum | AD | 5.81e-05 | 3.44e-01 | -0.0842 |
| 79962 | DNAJC22 | S43 | Human | Liver | Cirrhotic | 1.11e-07 | -2.21e-02 | -0.0187 |
| 79962 | DNAJC22 | HCC1_Meng | Human | Liver | HCC | 3.00e-68 | 1.81e-01 | 0.0246 |
| 79962 | DNAJC22 | HCC2_Meng | Human | Liver | HCC | 4.85e-21 | 9.01e-03 | 0.0107 |
| 79962 | DNAJC22 | HCC1 | Human | Liver | HCC | 1.75e-06 | 2.34e+00 | 0.5336 |
| 79962 | DNAJC22 | HCC2 | Human | Liver | HCC | 4.97e-19 | 3.60e+00 | 0.5341 |
| 79962 | DNAJC22 | HCC5 | Human | Liver | HCC | 7.65e-17 | 1.79e+00 | 0.4932 |
| 79962 | DNAJC22 | Pt13.c | Human | Liver | HCC | 4.12e-02 | -2.20e-01 | 0.0076 |
| 79962 | DNAJC22 | S014 | Human | Liver | HCC | 5.43e-07 | 5.00e-01 | 0.2254 |
| 79962 | DNAJC22 | S015 | Human | Liver | HCC | 8.37e-09 | 7.08e-01 | 0.2375 |
| Page: 1 2 |
| Tissue | Expression Dynamics | Abbreviation |
| Colorectum (GSE201348) |  | FAP: Familial adenomatous polyposis |
| CRC: Colorectal cancer | ||
| Colorectum (HTA11) |  | AD: Adenomas |
| SER: Sessile serrated lesions | ||
| MSI-H: Microsatellite-high colorectal cancer | ||
| MSS: Microsatellite stable colorectal cancer | ||
| Liver |  | HCC: Hepatocellular carcinoma |
| NAFLD: Non-alcoholic fatty liver disease | ||
| Thyroid | 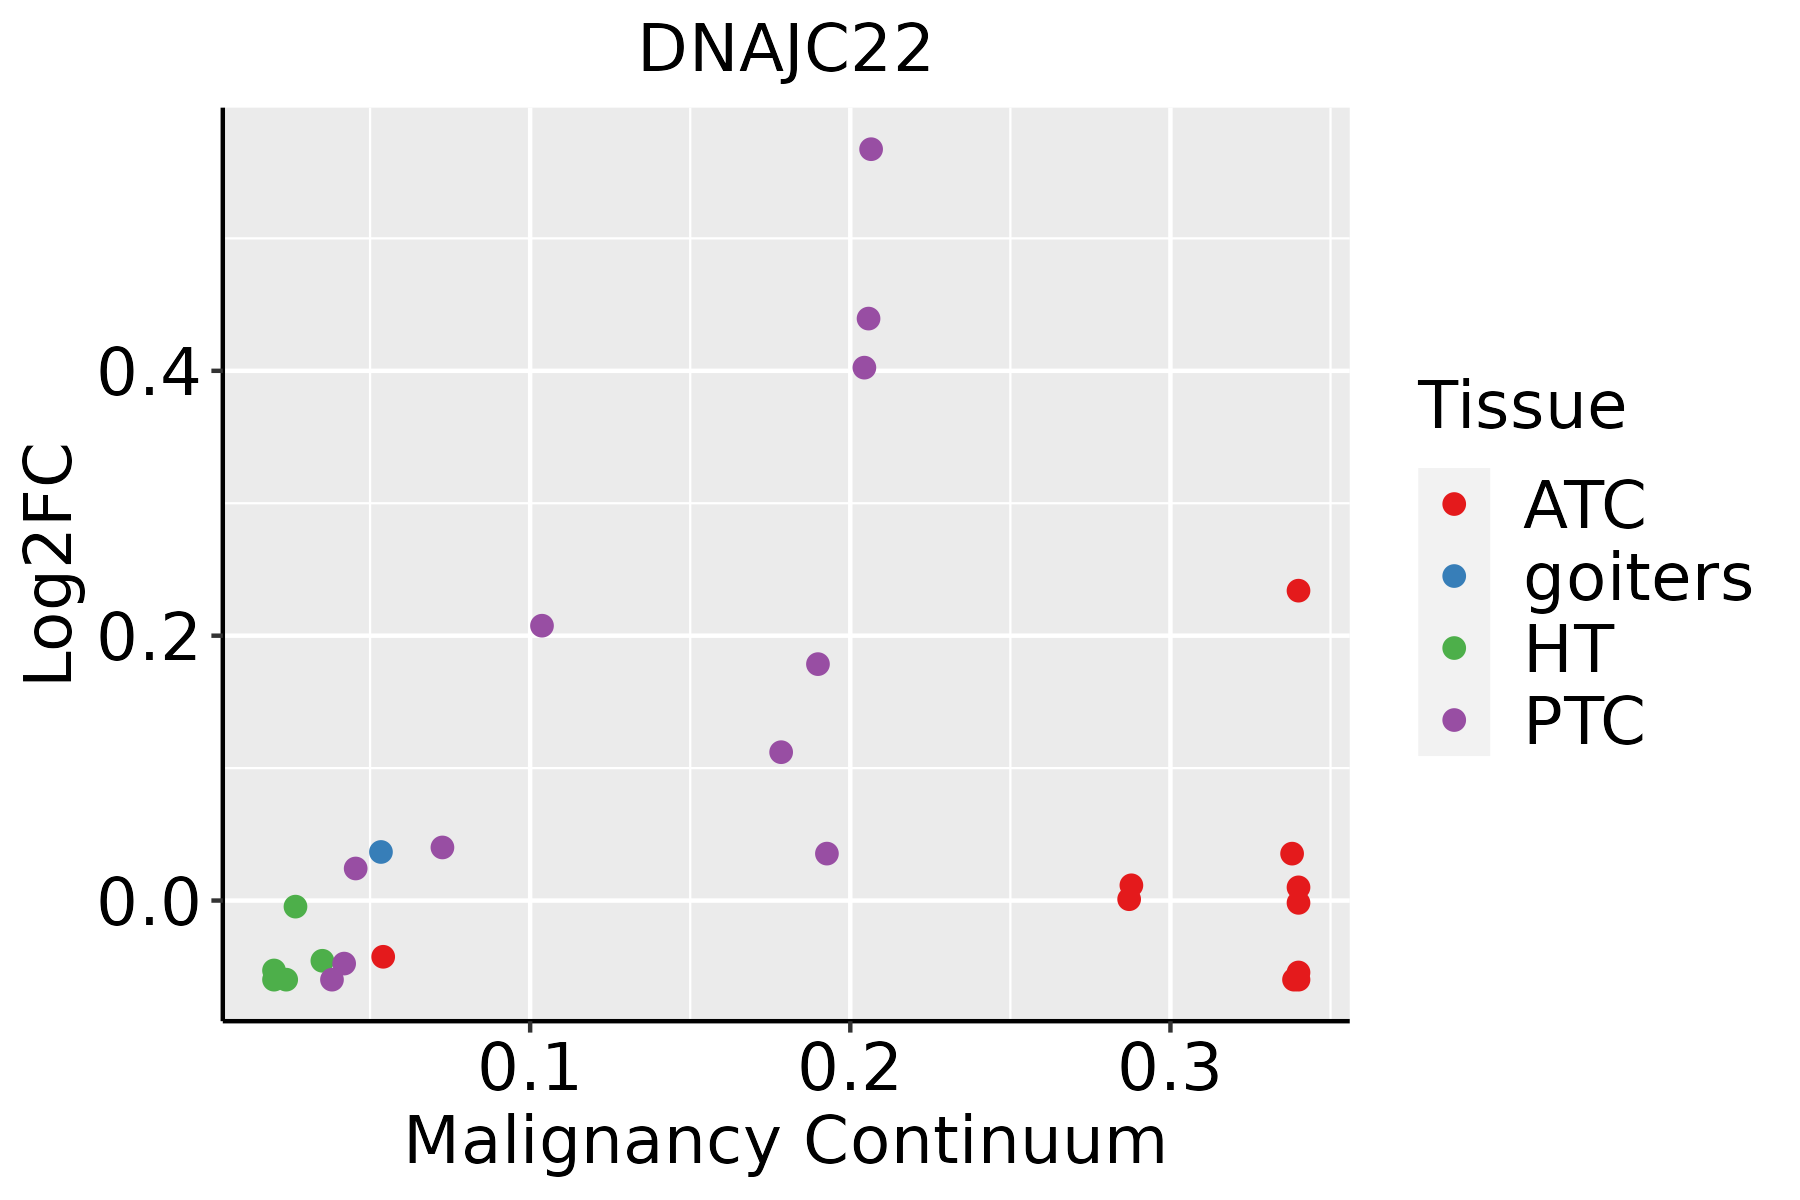 | ATC: Anaplastic thyroid cancer |
| HT: Hashimoto's thyroiditis | ||
| PTC: Papillary thyroid cancer |
| ∗log2FC in expression of this searched gene in stem-like cells from each diseased tissue sample relative to stem-like cells in normal samples in each tissue plotted against the malignancy continuum. Samples are colored based on if they are from different disease stage. |
Top |
Malignant transformation related pathway analysis |
| Find out the enriched GO biological processes and KEGG pathways involved in transition from healthy to precancer to cancer |
| Tissue | Disease Stage | Enriched GO biological Processes |
| Colorectum | AD |  |
| Colorectum | SER |  |
| Colorectum | MSS |  |
| Colorectum | MSI-H |  |
| Colorectum | FAP |  |
| ∗Top 15 enriched GO BP terms are showed in the bar plot of each disease state in each tissue. Each row represents a significant GO biological process which is colored according to the -log10(p.adjust). |
| Page: 1 2 3 4 5 6 7 8 9 |
| GO ID | Tissue | Disease Stage | Description | Gene Ratio | Bg Ratio | pvalue | p.adjust | Count |
| Page: 1 |
| Pathway ID | Tissue | Disease Stage | Description | Gene Ratio | Bg Ratio | pvalue | p.adjust | qvalue | Count |
| Page: 1 |
Top |
Cell-cell communication analysis |
| Identification of potential cell-cell interactions between two cell types and their ligand-receptor pairs for different disease states |
| Ligand | Receptor | LRpair | Pathway | Tissue | Disease Stage |
| Page: 1 |
Top |
Single-cell gene regulatory network inference analysis |
| Find out the significant the regulons (TFs) and the target genes of each regulon across cell types for different disease states |
| TF | Cell Type | Tissue | Disease Stage | Target Gene | RSS | Regulon Activity |
| ∗The dot plots of a searched regulon are shown for all cell subpopulations in each disease state of each tissue based on the regulon specific score inferred using pySCENIC and by calculating the average expression. |
| Page: 1 |
Top |
Somatic mutation of malignant transformation related genes |
| Annotation of somatic variants for genes involved in malignant transformation |
| Hugo Symbol | Variant Class | Variant Classification | dbSNP RS | HGVSc | HGVSp | HGVSp Short | SWISSPROT | BIOTYPE | SIFT | PolyPhen | Tumor Sample Barcode | Tissue | Histology | Sex | Age | Stage | Therapy Types | Drugs | Outcome |
| DNAJC22 | SNV | Missense_Mutation | rs757463642 | c.91N>A | p.Ala31Thr | p.A31T | Q8N4W6 | protein_coding | deleterious(0) | probably_damaging(0.999) | TCGA-BH-A0HW-01 | Breast | breast invasive carcinoma | Female | <65 | I/II | Chemotherapy | doxorubicin | SD |
| DNAJC22 | SNV | Missense_Mutation | novel | c.90N>A | p.His30Gln | p.H30Q | Q8N4W6 | protein_coding | tolerated(0.1) | probably_damaging(1) | TCGA-AA-3688-01 | Colorectum | colon adenocarcinoma | Male | >=65 | III/IV | Unknown | Unknown | SD |
| DNAJC22 | SNV | Missense_Mutation | rs761677583 | c.958N>C | p.Phe320Leu | p.F320L | Q8N4W6 | protein_coding | deleterious(0.01) | probably_damaging(0.994) | TCGA-AA-3949-01 | Colorectum | colon adenocarcinoma | Female | >=65 | III/IV | Unknown | Unknown | SD |
| DNAJC22 | SNV | Missense_Mutation | novel | c.68N>G | p.Leu23Arg | p.L23R | Q8N4W6 | protein_coding | deleterious(0) | probably_damaging(0.99) | TCGA-AA-3966-01 | Colorectum | colon adenocarcinoma | Female | >=65 | I/II | Unknown | Unknown | SD |
| DNAJC22 | SNV | Missense_Mutation | rs754538756 | c.475N>A | p.Ala159Thr | p.A159T | Q8N4W6 | protein_coding | deleterious(0.02) | benign(0.325) | TCGA-AA-A010-01 | Colorectum | colon adenocarcinoma | Female | <65 | I/II | Chemotherapy | folinic | CR |
| DNAJC22 | SNV | Missense_Mutation | novel | c.90C>A | p.His30Gln | p.H30Q | Q8N4W6 | protein_coding | tolerated(0.1) | probably_damaging(1) | TCGA-AY-4071-01 | Colorectum | colon adenocarcinoma | Female | <65 | I/II | Unknown | Unknown | SD |
| DNAJC22 | SNV | Missense_Mutation | rs775389117 | c.500G>A | p.Arg167His | p.R167H | Q8N4W6 | protein_coding | tolerated(0.12) | benign(0.042) | TCGA-AZ-6598-01 | Colorectum | colon adenocarcinoma | Female | >=65 | I/II | Unknown | Unknown | SD |
| DNAJC22 | SNV | Missense_Mutation | novel | c.164N>C | p.Phe55Ser | p.F55S | Q8N4W6 | protein_coding | deleterious(0.01) | possibly_damaging(0.521) | TCGA-CA-6718-01 | Colorectum | colon adenocarcinoma | Male | <65 | I/II | Unknown | Unknown | PD |
| DNAJC22 | SNV | Missense_Mutation | rs746569369 | c.238C>T | p.Arg80Cys | p.R80C | Q8N4W6 | protein_coding | deleterious(0.04) | possibly_damaging(0.886) | TCGA-CK-4951-01 | Colorectum | colon adenocarcinoma | Female | >=65 | I/II | Unknown | Unknown | PD |
| DNAJC22 | deletion | Frame_Shift_Del | rs751047585 | c.224delC | p.Pro75LeufsTer2 | p.P75Lfs*2 | Q8N4W6 | protein_coding | TCGA-AA-3845-01 | Colorectum | colon adenocarcinoma | Female | >=65 | I/II | Unknown | Unknown | PD |
| Page: 1 2 3 4 5 |
Top |
Related drugs of malignant transformation related genes |
| Identification of chemicals and drugs interact with genes involved in malignant transfromation |
| (DGIdb 4.0) |
| Entrez ID | Symbol | Category | Interaction Types | Drug Claim Name | Drug Name | PMIDs |
| Page: 1 |

Copyright 2023-Present -The University of Texas Health Science Center at Houston |