
|
|||||
|
 | |
| |
| |
| |
| |
| |
|
Gene: DNAJC21 |
Gene summary for DNAJC21 |
| Gene information | Species | Human | Gene symbol | DNAJC21 | Gene ID | 134218 |
| Gene name | DnaJ heat shock protein family (Hsp40) member C21 | |
| Gene Alias | BMFS3 | |
| Cytomap | 5p13.2 | |
| Gene Type | protein-coding | GO ID | GO:0006457 | UniProtAcc | Q5F1R6 |
Top |
Malignant transformation analysis |
| Identification of the aberrant gene expression in precancerous and cancerous lesions by comparing the gene expression of stem-like cells in diseased tissues with normal stem cells |
| Entrez ID | Symbol | Replicates | Species | Organ | Tissue | Adj P-value | Log2FC | Malignancy |
| 134218 | DNAJC21 | LZE2T | Human | Esophagus | ESCC | 2.92e-03 | 4.48e-01 | 0.082 |
| 134218 | DNAJC21 | LZE4T | Human | Esophagus | ESCC | 1.96e-06 | 2.76e-01 | 0.0811 |
| 134218 | DNAJC21 | LZE5T | Human | Esophagus | ESCC | 8.57e-03 | 2.76e-01 | 0.0514 |
| 134218 | DNAJC21 | LZE7T | Human | Esophagus | ESCC | 4.04e-04 | 1.70e-01 | 0.0667 |
| 134218 | DNAJC21 | LZE8T | Human | Esophagus | ESCC | 1.09e-07 | 3.48e-01 | 0.067 |
| 134218 | DNAJC21 | LZE20T | Human | Esophagus | ESCC | 2.36e-12 | 3.86e-01 | 0.0662 |
| 134218 | DNAJC21 | LZE22T | Human | Esophagus | ESCC | 4.44e-03 | 1.95e-01 | 0.068 |
| 134218 | DNAJC21 | LZE24T | Human | Esophagus | ESCC | 1.58e-07 | 1.78e-01 | 0.0596 |
| 134218 | DNAJC21 | LZE6T | Human | Esophagus | ESCC | 9.30e-10 | 6.70e-01 | 0.0845 |
| 134218 | DNAJC21 | P1T-E | Human | Esophagus | ESCC | 7.94e-04 | 3.34e-01 | 0.0875 |
| 134218 | DNAJC21 | P2T-E | Human | Esophagus | ESCC | 1.13e-23 | 3.12e-01 | 0.1177 |
| 134218 | DNAJC21 | P4T-E | Human | Esophagus | ESCC | 2.27e-29 | 7.19e-01 | 0.1323 |
| 134218 | DNAJC21 | P5T-E | Human | Esophagus | ESCC | 1.54e-25 | 5.13e-01 | 0.1327 |
| 134218 | DNAJC21 | P8T-E | Human | Esophagus | ESCC | 8.25e-30 | 4.34e-01 | 0.0889 |
| 134218 | DNAJC21 | P9T-E | Human | Esophagus | ESCC | 4.35e-15 | 3.16e-01 | 0.1131 |
| 134218 | DNAJC21 | P10T-E | Human | Esophagus | ESCC | 7.42e-30 | 5.51e-01 | 0.116 |
| 134218 | DNAJC21 | P11T-E | Human | Esophagus | ESCC | 5.07e-11 | 2.76e-01 | 0.1426 |
| 134218 | DNAJC21 | P12T-E | Human | Esophagus | ESCC | 1.12e-20 | 3.91e-01 | 0.1122 |
| 134218 | DNAJC21 | P15T-E | Human | Esophagus | ESCC | 2.47e-13 | 3.16e-01 | 0.1149 |
| 134218 | DNAJC21 | P16T-E | Human | Esophagus | ESCC | 1.31e-16 | 2.44e-01 | 0.1153 |
| Page: 1 2 3 4 5 6 7 |
| Tissue | Expression Dynamics | Abbreviation |
| Esophagus | 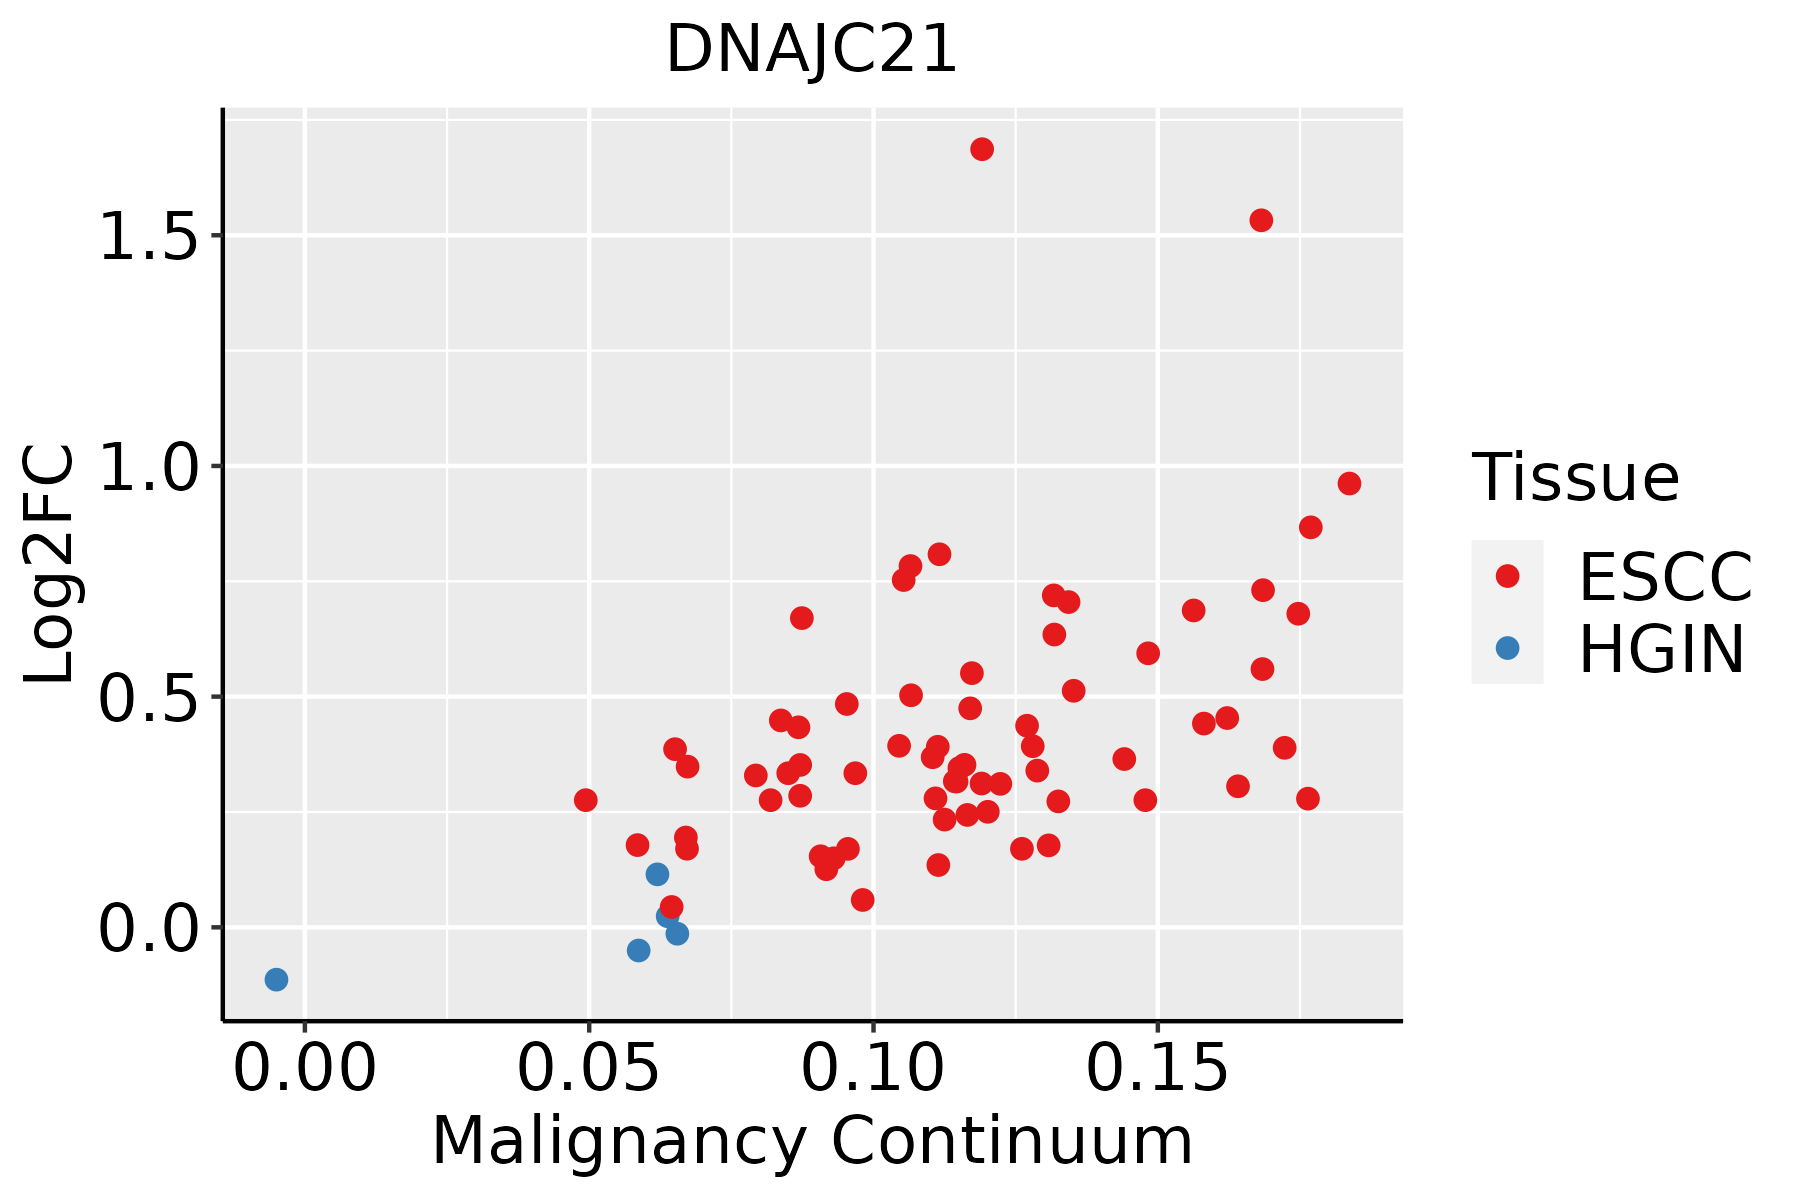 | ESCC: Esophageal squamous cell carcinoma |
| HGIN: High-grade intraepithelial neoplasias | ||
| LGIN: Low-grade intraepithelial neoplasias | ||
| Liver | 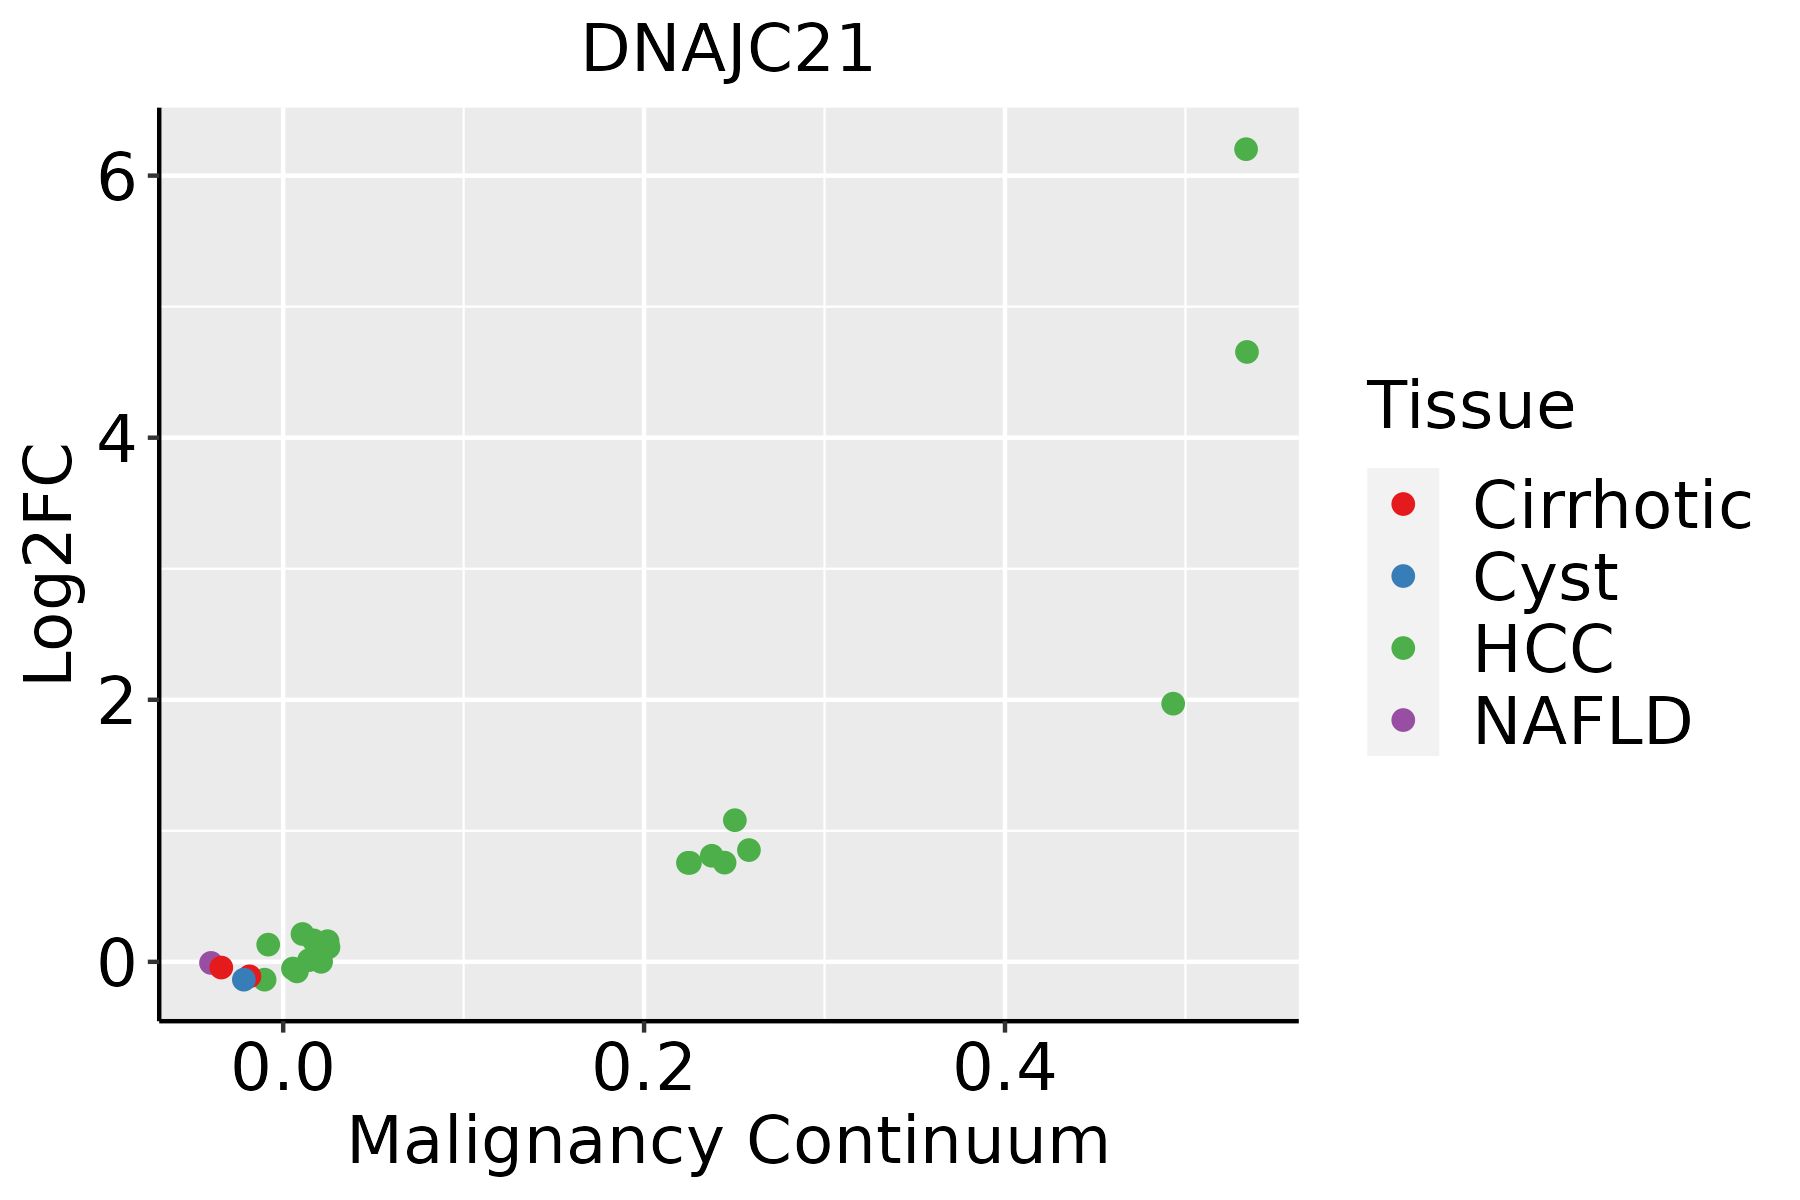 | HCC: Hepatocellular carcinoma |
| NAFLD: Non-alcoholic fatty liver disease | ||
| Oral Cavity | 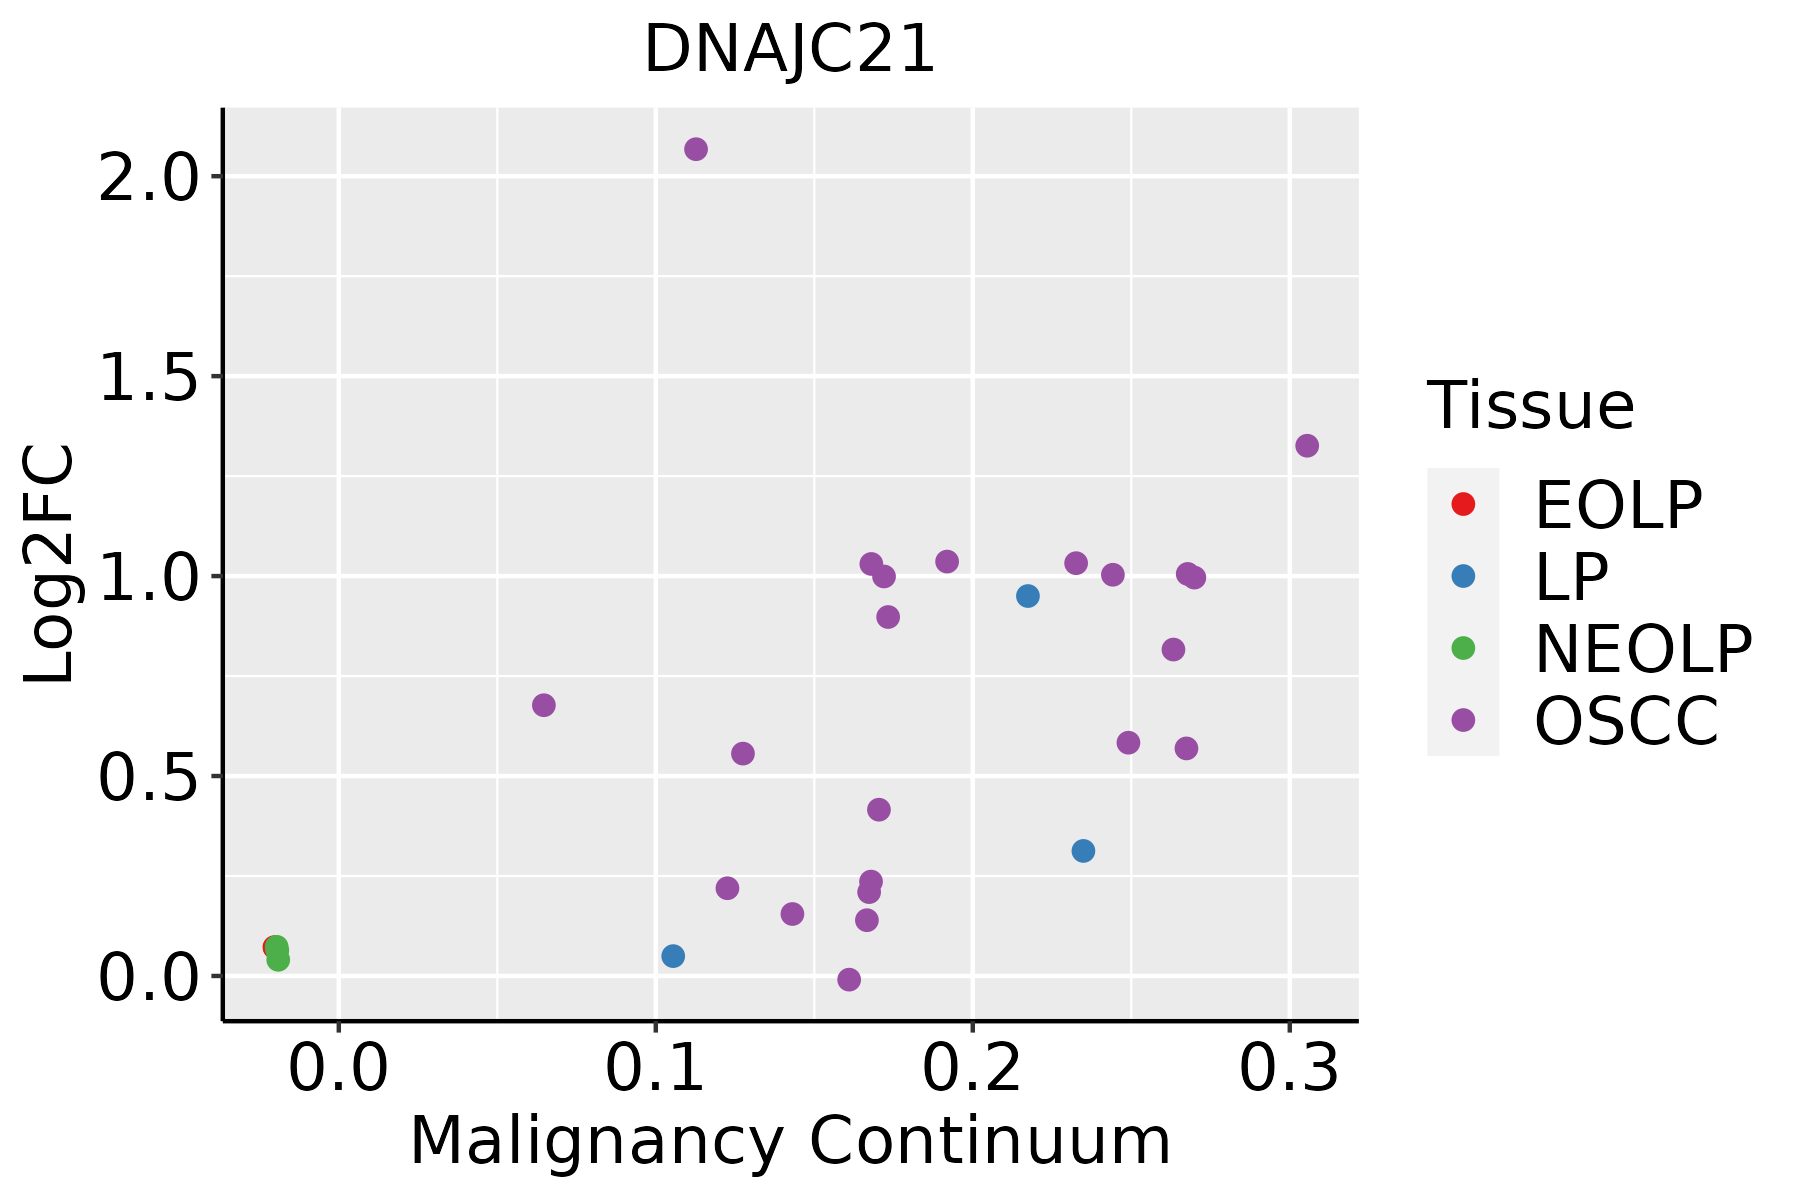 | EOLP: Erosive Oral lichen planus |
| LP: leukoplakia | ||
| NEOLP: Non-erosive oral lichen planus | ||
| OSCC: Oral squamous cell carcinoma | ||
| Prostate | 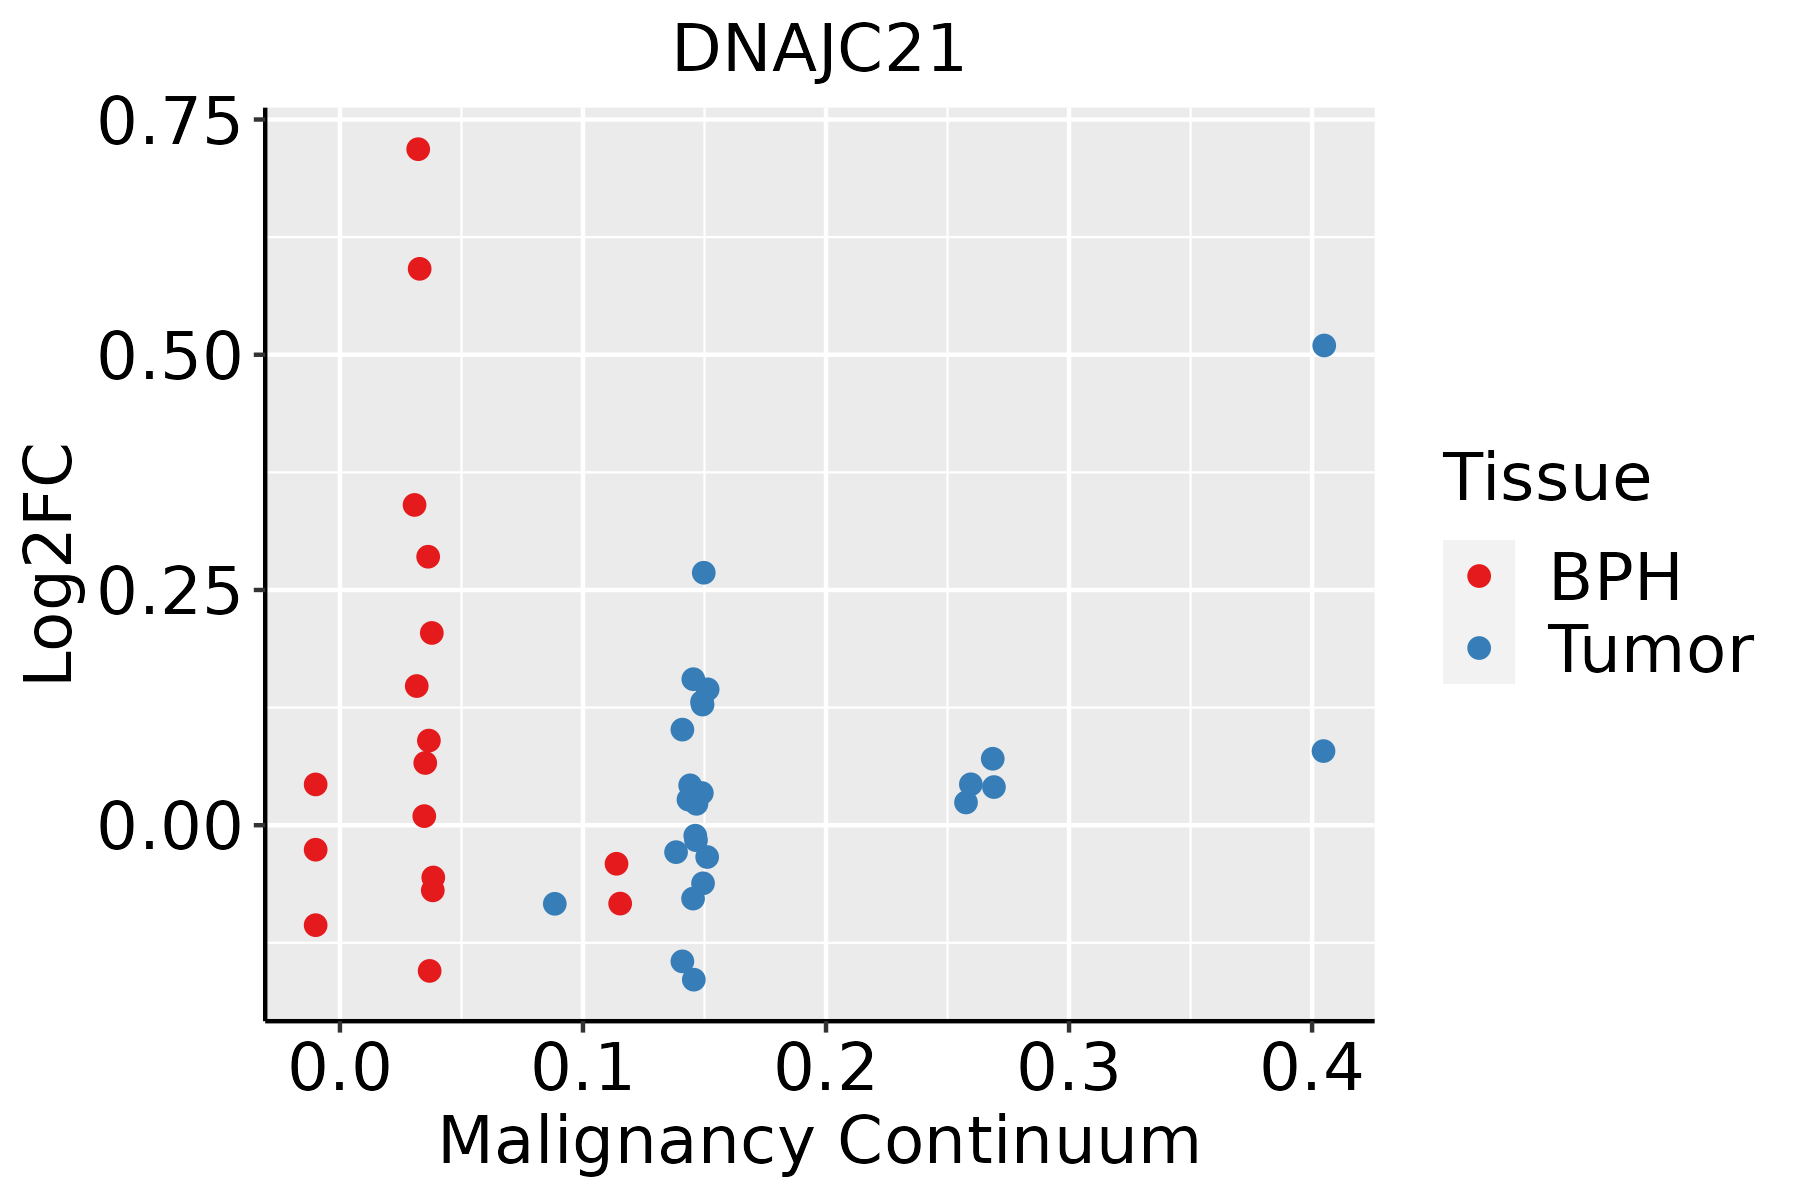 | BPH: Benign Prostatic Hyperplasia |
| Skin |  | AK: Actinic keratosis |
| cSCC: Cutaneous squamous cell carcinoma | ||
| SCCIS:squamous cell carcinoma in situ | ||
| Thyroid | 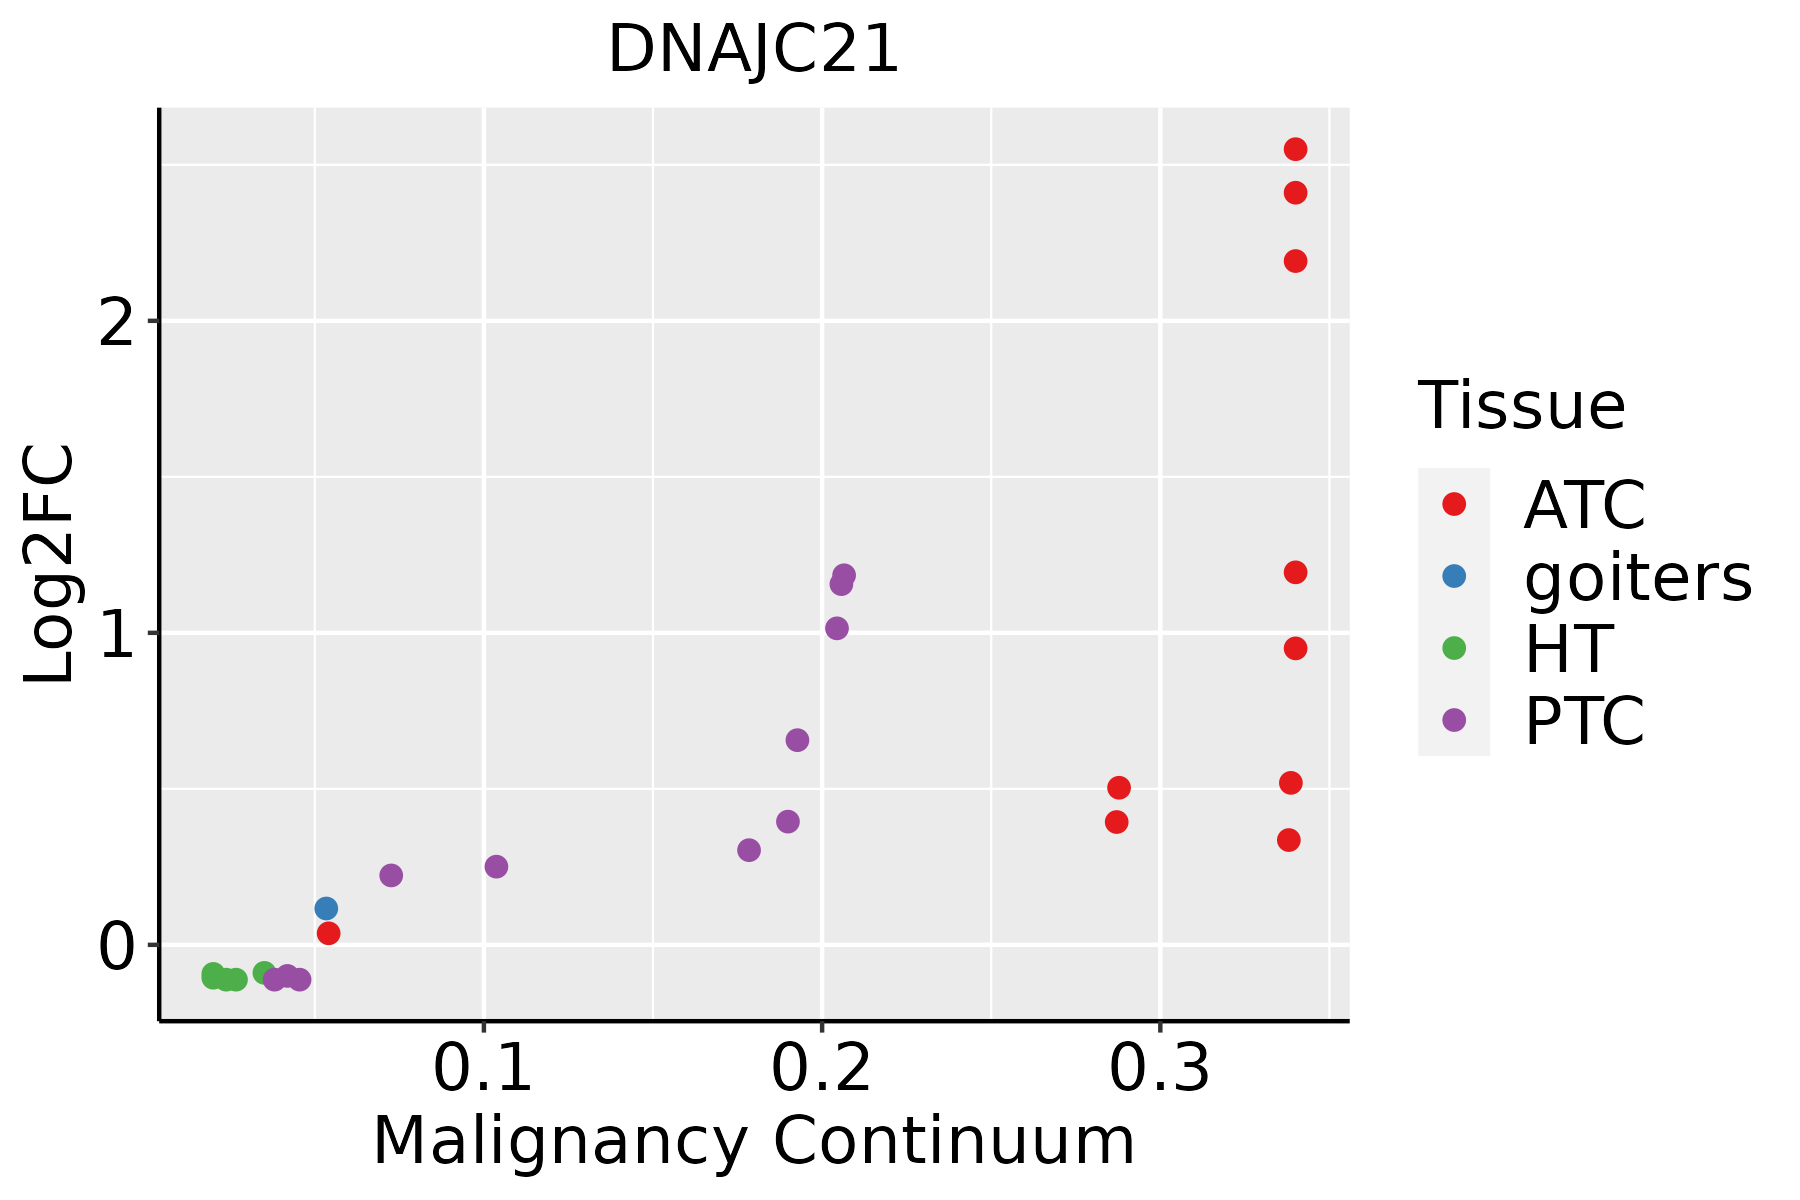 | ATC: Anaplastic thyroid cancer |
| HT: Hashimoto's thyroiditis | ||
| PTC: Papillary thyroid cancer |
| ∗log2FC in expression of this searched gene in stem-like cells from each diseased tissue sample relative to stem-like cells in normal samples in each tissue plotted against the malignancy continuum. Samples are colored based on if they are from different disease stage. |
Top |
Malignant transformation related pathway analysis |
| Find out the enriched GO biological processes and KEGG pathways involved in transition from healthy to precancer to cancer |
| Tissue | Disease Stage | Enriched GO biological Processes |
| Colorectum | AD |  |
| Colorectum | SER |  |
| Colorectum | MSS |  |
| Colorectum | MSI-H |  |
| Colorectum | FAP |  |
| ∗Top 15 enriched GO BP terms are showed in the bar plot of each disease state in each tissue. Each row represents a significant GO biological process which is colored according to the -log10(p.adjust). |
| Page: 1 2 3 4 5 6 7 8 9 |
| GO ID | Tissue | Disease Stage | Description | Gene Ratio | Bg Ratio | pvalue | p.adjust | Count |
| GO:0006457110 | Esophagus | ESCC | protein folding | 163/8552 | 212/18723 | 1.13e-20 | 1.74e-18 | 163 |
| GO:000645712 | Liver | HCC | protein folding | 160/7958 | 212/18723 | 1.07e-22 | 1.88e-20 | 160 |
| GO:000645718 | Oral cavity | OSCC | protein folding | 154/7305 | 212/18723 | 1.89e-23 | 4.60e-21 | 154 |
| GO:000645716 | Prostate | BPH | protein folding | 85/3107 | 212/18723 | 2.37e-16 | 4.74e-14 | 85 |
| GO:000645717 | Prostate | Tumor | protein folding | 85/3246 | 212/18723 | 3.37e-15 | 5.37e-13 | 85 |
| GO:000645726 | Skin | AK | protein folding | 44/1910 | 212/18723 | 3.54e-06 | 8.91e-05 | 44 |
| GO:0006457111 | Skin | cSCC | protein folding | 131/4864 | 212/18723 | 2.96e-28 | 1.32e-25 | 131 |
| GO:0006457112 | Thyroid | PTC | protein folding | 137/5968 | 212/18723 | 8.29e-23 | 2.01e-20 | 137 |
| GO:000645733 | Thyroid | ATC | protein folding | 140/6293 | 212/18723 | 3.46e-22 | 8.09e-20 | 140 |
| Page: 1 |
| Pathway ID | Tissue | Disease Stage | Description | Gene Ratio | Bg Ratio | pvalue | p.adjust | qvalue | Count |
| Page: 1 |
Top |
Cell-cell communication analysis |
| Identification of potential cell-cell interactions between two cell types and their ligand-receptor pairs for different disease states |
| Ligand | Receptor | LRpair | Pathway | Tissue | Disease Stage |
| Page: 1 |
Top |
Single-cell gene regulatory network inference analysis |
| Find out the significant the regulons (TFs) and the target genes of each regulon across cell types for different disease states |
| TF | Cell Type | Tissue | Disease Stage | Target Gene | RSS | Regulon Activity |
| ∗The dot plots of a searched regulon are shown for all cell subpopulations in each disease state of each tissue based on the regulon specific score inferred using pySCENIC and by calculating the average expression. |
| Page: 1 |
Top |
Somatic mutation of malignant transformation related genes |
| Annotation of somatic variants for genes involved in malignant transformation |
| Hugo Symbol | Variant Class | Variant Classification | dbSNP RS | HGVSc | HGVSp | HGVSp Short | SWISSPROT | BIOTYPE | SIFT | PolyPhen | Tumor Sample Barcode | Tissue | Histology | Sex | Age | Stage | Therapy Types | Drugs | Outcome |
| DNAJC21 | SNV | Missense_Mutation | c.1078N>G | p.Gln360Glu | p.Q360E | Q5F1R6 | protein_coding | tolerated(1) | benign(0.399) | TCGA-AC-A23H-01 | Breast | breast invasive carcinoma | Female | >=65 | I/II | Unknown | Unknown | PD | |
| DNAJC21 | SNV | Missense_Mutation | novel | c.176N>T | p.Pro59Leu | p.P59L | Q5F1R6 | protein_coding | deleterious(0) | probably_damaging(0.958) | TCGA-W8-A86G-01 | Breast | breast invasive carcinoma | Female | >=65 | I/II | Hormone Therapy | arimidex | SD |
| DNAJC21 | insertion | Nonsense_Mutation | novel | c.542_543insGCCTGAAATTTCTGCTTAGATTGTTGCTTTT | p.Arg182ProfsTer6 | p.R182Pfs*6 | Q5F1R6 | protein_coding | TCGA-A8-A08H-01 | Breast | breast invasive carcinoma | Female | >=65 | I/II | Unknown | Unknown | SD | ||
| DNAJC21 | insertion | Nonsense_Mutation | novel | c.758_759insTTTACTGCTTTTCTAAAAAAAAATCTTAAAG | p.Arg254LeufsTer5 | p.R254Lfs*5 | Q5F1R6 | protein_coding | TCGA-BH-A0B1-01 | Breast | breast invasive carcinoma | Female | >=65 | I/II | Chemotherapy | adriamycin | SD | ||
| DNAJC21 | deletion | Frame_Shift_Del | novel | c.912delN | p.Ala305ProfsTer25 | p.A305Pfs*25 | Q5F1R6 | protein_coding | TCGA-D8-A27V-01 | Breast | breast invasive carcinoma | Female | <65 | I/II | Hormone Therapy | tamoxiphen | SD | ||
| DNAJC21 | SNV | Missense_Mutation | novel | c.555A>C | p.Glu185Asp | p.E185D | Q5F1R6 | protein_coding | deleterious(0) | probably_damaging(0.995) | TCGA-2W-A8YY-01 | Cervix | cervical & endocervical cancer | Female | <65 | I/II | Chemotherapy | cisplatin | CR |
| DNAJC21 | SNV | Missense_Mutation | novel | c.208N>C | p.Glu70Gln | p.E70Q | Q5F1R6 | protein_coding | deleterious(0) | probably_damaging(0.934) | TCGA-EA-A3HU-01 | Cervix | cervical & endocervical cancer | Female | <65 | I/II | Unknown | Unknown | SD |
| DNAJC21 | SNV | Missense_Mutation | c.1090N>C | p.Asn364His | p.N364H | Q5F1R6 | protein_coding | deleterious(0.02) | probably_damaging(0.991) | TCGA-FU-A3HZ-01 | Cervix | cervical & endocervical cancer | Female | <65 | I/II | Chemotherapy | cisplatin | CR | |
| DNAJC21 | SNV | Missense_Mutation | novel | c.505N>A | p.Glu169Lys | p.E169K | Q5F1R6 | protein_coding | tolerated(0.3) | possibly_damaging(0.535) | TCGA-JW-A5VL-01 | Cervix | cervical & endocervical cancer | Female | <65 | I/II | Unknown | Unknown | SD |
| DNAJC21 | SNV | Missense_Mutation | c.70N>G | p.Arg24Gly | p.R24G | Q5F1R6 | protein_coding | deleterious(0) | probably_damaging(0.999) | TCGA-LP-A5U2-01 | Cervix | cervical & endocervical cancer | Female | <65 | III/IV | Unknown | Unknown | SD |
| Page: 1 2 3 4 5 6 7 |
Top |
Related drugs of malignant transformation related genes |
| Identification of chemicals and drugs interact with genes involved in malignant transfromation |
| (DGIdb 4.0) |
| Entrez ID | Symbol | Category | Interaction Types | Drug Claim Name | Drug Name | PMIDs |
| Page: 1 |

Copyright 2023-Present -The University of Texas Health Science Center at Houston |