
|
|||||
|
 | |
| |
| |
| |
| |
| |
|
Gene: DNAJC2 |
Gene summary for DNAJC2 |
| Gene information | Species | Human | Gene symbol | DNAJC2 | Gene ID | 27000 |
| Gene name | DnaJ heat shock protein family (Hsp40) member C2 | |
| Gene Alias | MPHOSPH11 | |
| Cytomap | 7q22.1 | |
| Gene Type | protein-coding | GO ID | GO:0006139 | UniProtAcc | Q99543 |
Top |
Malignant transformation analysis |
| Identification of the aberrant gene expression in precancerous and cancerous lesions by comparing the gene expression of stem-like cells in diseased tissues with normal stem cells |
| Entrez ID | Symbol | Replicates | Species | Organ | Tissue | Adj P-value | Log2FC | Malignancy |
| 27000 | DNAJC2 | LZE4T | Human | Esophagus | ESCC | 2.34e-08 | 4.79e-01 | 0.0811 |
| 27000 | DNAJC2 | LZE7T | Human | Esophagus | ESCC | 3.26e-03 | 6.41e-01 | 0.0667 |
| 27000 | DNAJC2 | LZE8T | Human | Esophagus | ESCC | 7.72e-05 | 2.74e-01 | 0.067 |
| 27000 | DNAJC2 | LZE20T | Human | Esophagus | ESCC | 1.86e-08 | 3.01e-01 | 0.0662 |
| 27000 | DNAJC2 | LZE22D1 | Human | Esophagus | HGIN | 1.12e-03 | 4.08e-02 | 0.0595 |
| 27000 | DNAJC2 | LZE24T | Human | Esophagus | ESCC | 1.30e-21 | 8.26e-01 | 0.0596 |
| 27000 | DNAJC2 | LZE6T | Human | Esophagus | ESCC | 9.00e-08 | 1.73e-01 | 0.0845 |
| 27000 | DNAJC2 | P1T-E | Human | Esophagus | ESCC | 7.65e-10 | 6.24e-01 | 0.0875 |
| 27000 | DNAJC2 | P2T-E | Human | Esophagus | ESCC | 2.01e-78 | 1.50e+00 | 0.1177 |
| 27000 | DNAJC2 | P4T-E | Human | Esophagus | ESCC | 1.86e-36 | 1.17e+00 | 0.1323 |
| 27000 | DNAJC2 | P5T-E | Human | Esophagus | ESCC | 4.52e-47 | 1.06e+00 | 0.1327 |
| 27000 | DNAJC2 | P8T-E | Human | Esophagus | ESCC | 8.65e-20 | 4.17e-01 | 0.0889 |
| 27000 | DNAJC2 | P9T-E | Human | Esophagus | ESCC | 1.00e-23 | 8.36e-01 | 0.1131 |
| 27000 | DNAJC2 | P10T-E | Human | Esophagus | ESCC | 4.83e-50 | 8.23e-01 | 0.116 |
| 27000 | DNAJC2 | P11T-E | Human | Esophagus | ESCC | 1.78e-13 | 7.92e-01 | 0.1426 |
| 27000 | DNAJC2 | P12T-E | Human | Esophagus | ESCC | 1.27e-37 | 8.87e-01 | 0.1122 |
| 27000 | DNAJC2 | P15T-E | Human | Esophagus | ESCC | 1.12e-49 | 1.42e+00 | 0.1149 |
| 27000 | DNAJC2 | P16T-E | Human | Esophagus | ESCC | 6.22e-58 | 1.09e+00 | 0.1153 |
| 27000 | DNAJC2 | P17T-E | Human | Esophagus | ESCC | 1.89e-15 | 1.38e+00 | 0.1278 |
| 27000 | DNAJC2 | P19T-E | Human | Esophagus | ESCC | 1.48e-02 | 9.32e-01 | 0.1662 |
| Page: 1 2 3 4 5 6 7 |
| Tissue | Expression Dynamics | Abbreviation |
| Esophagus | 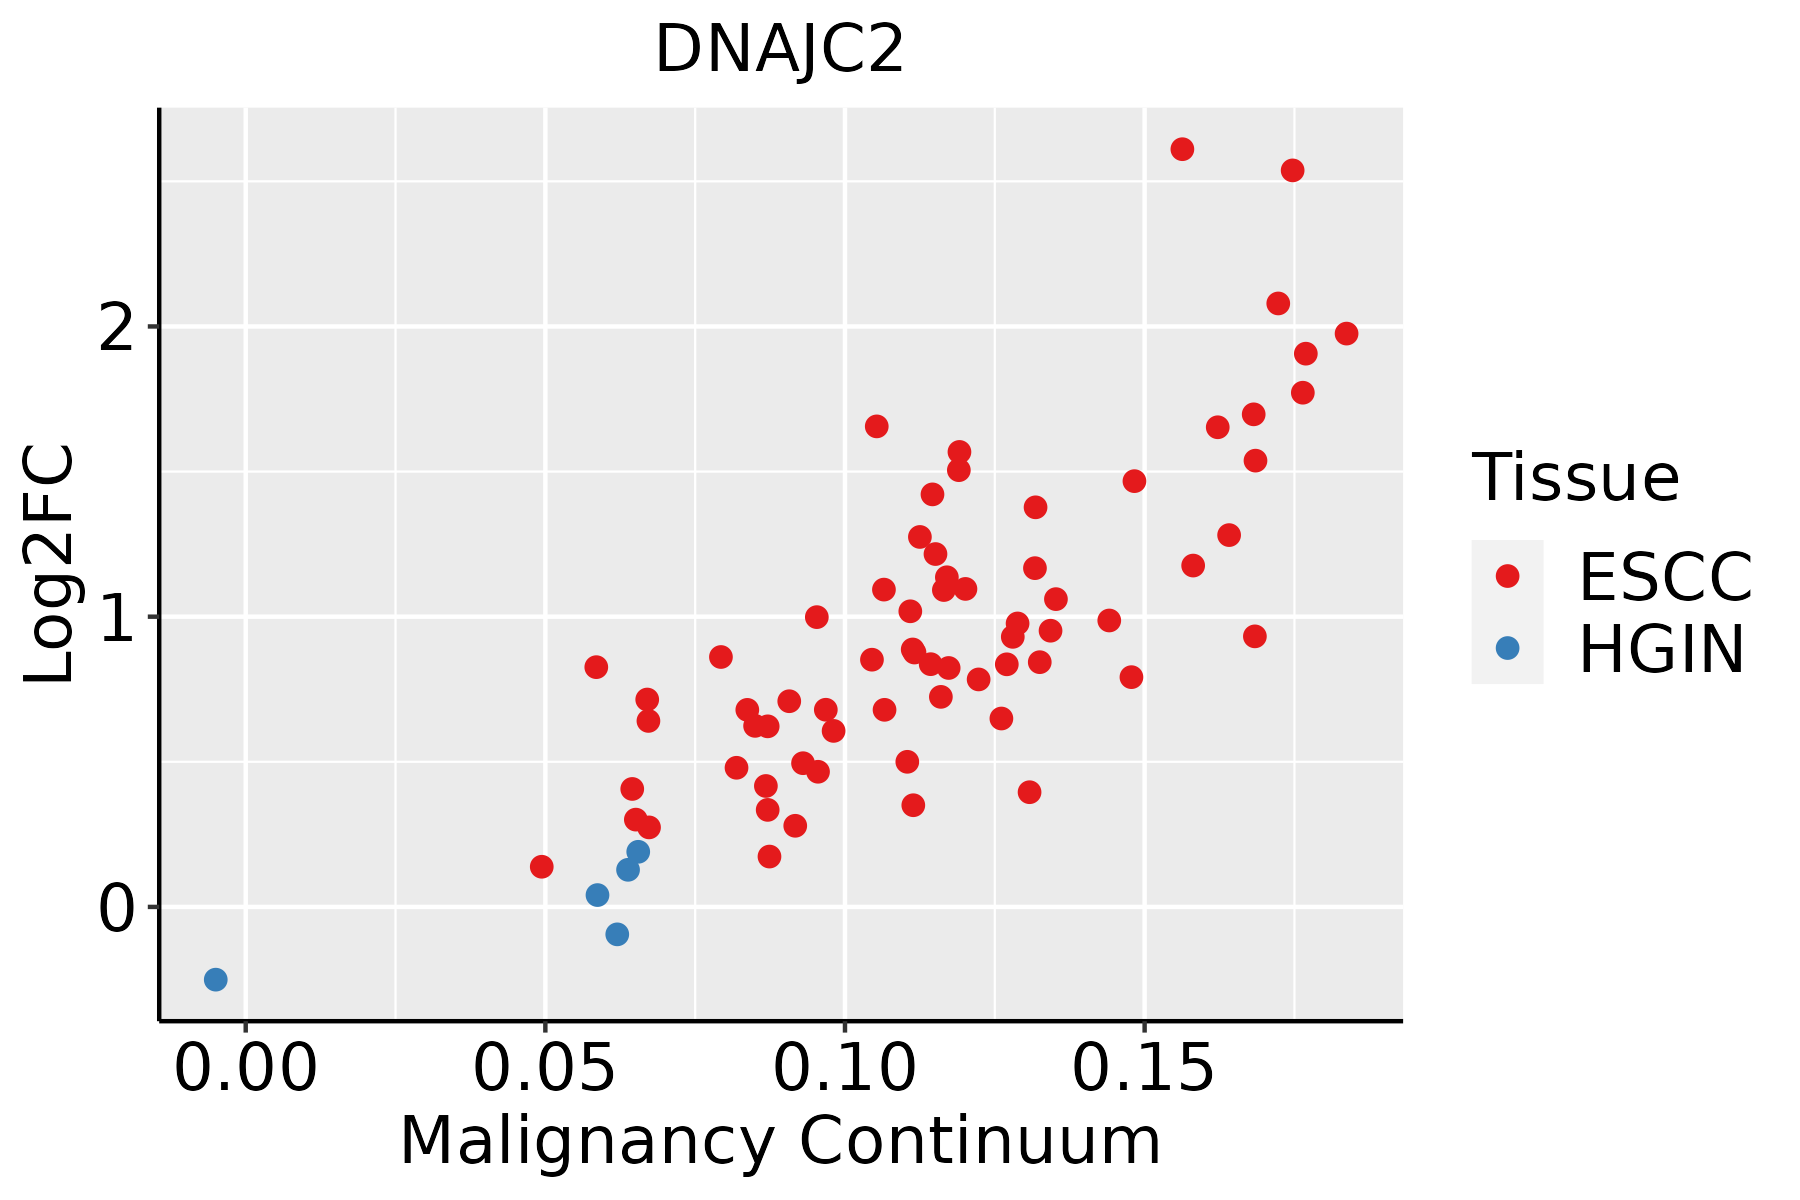 | ESCC: Esophageal squamous cell carcinoma |
| HGIN: High-grade intraepithelial neoplasias | ||
| LGIN: Low-grade intraepithelial neoplasias | ||
| Liver | 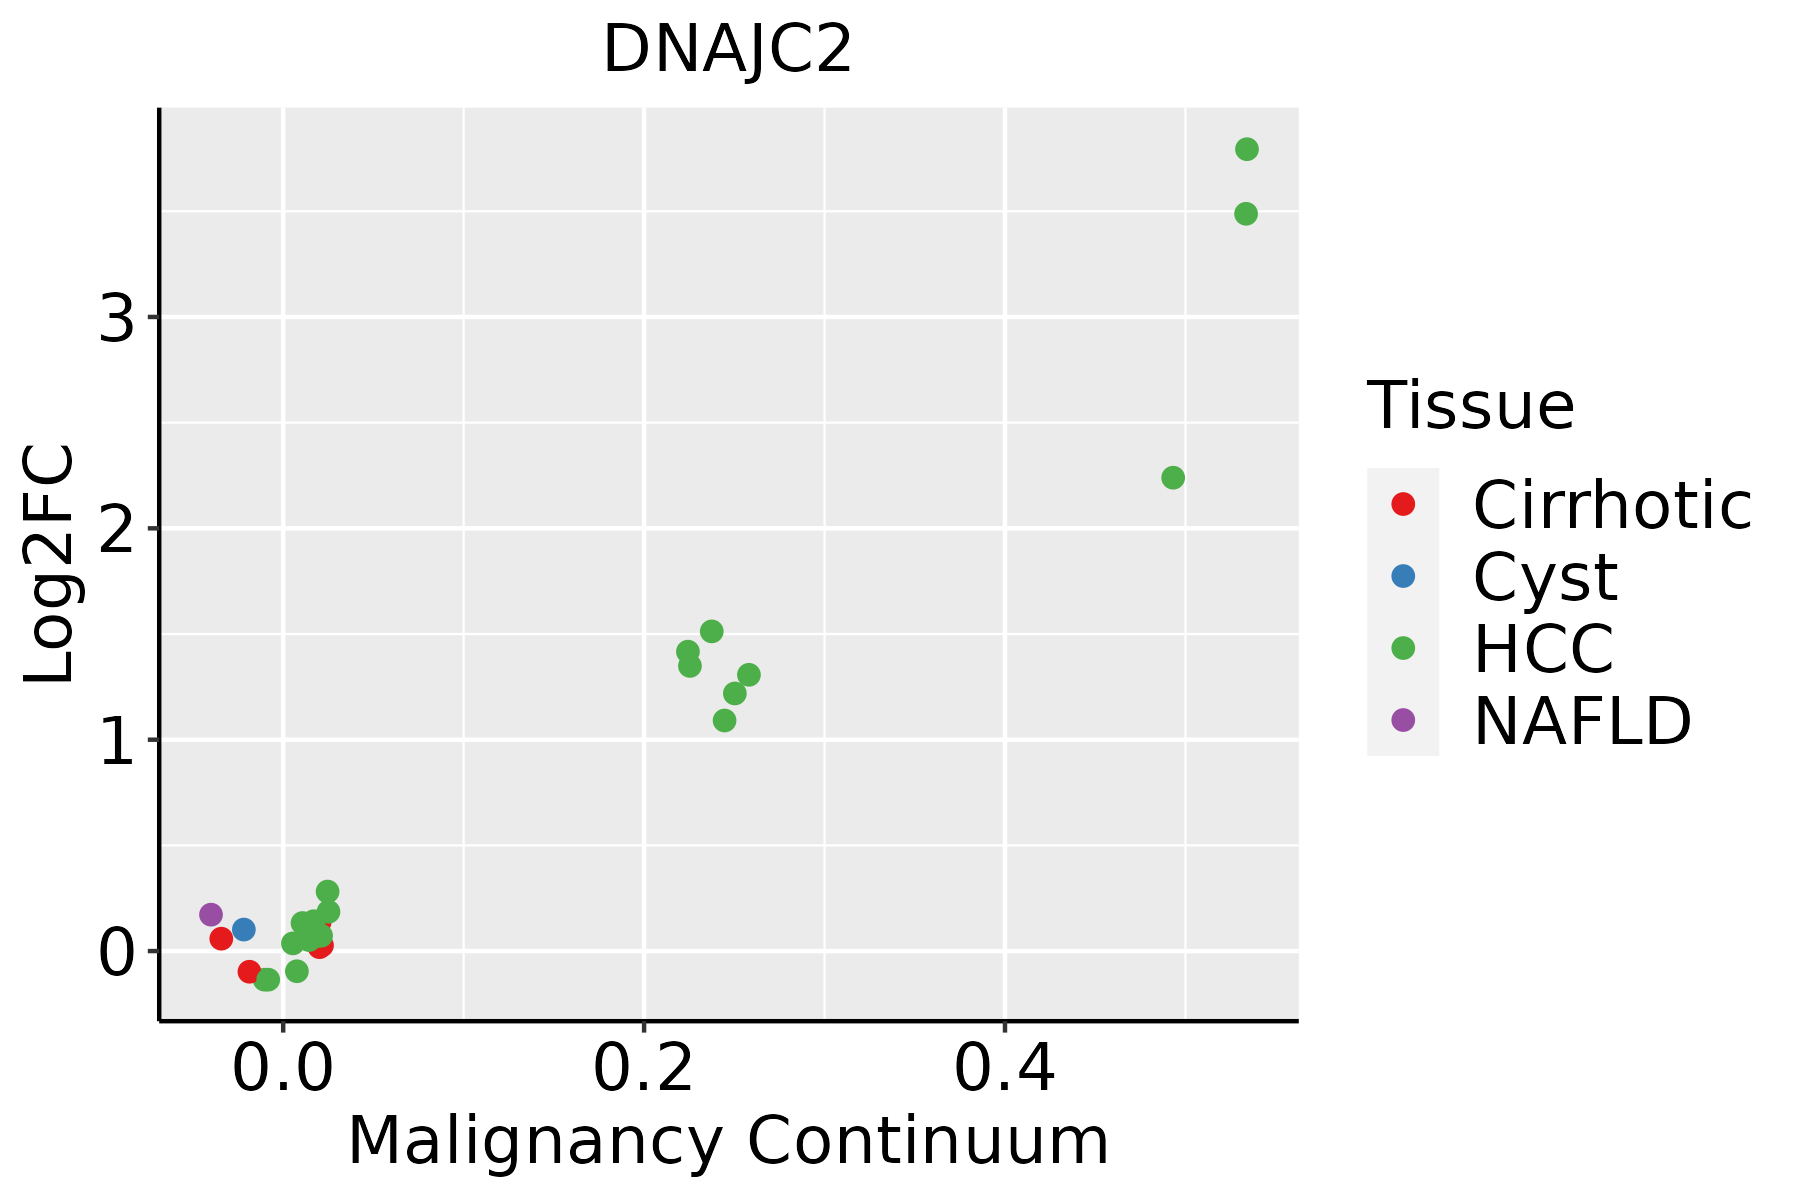 | HCC: Hepatocellular carcinoma |
| NAFLD: Non-alcoholic fatty liver disease | ||
| Oral Cavity | 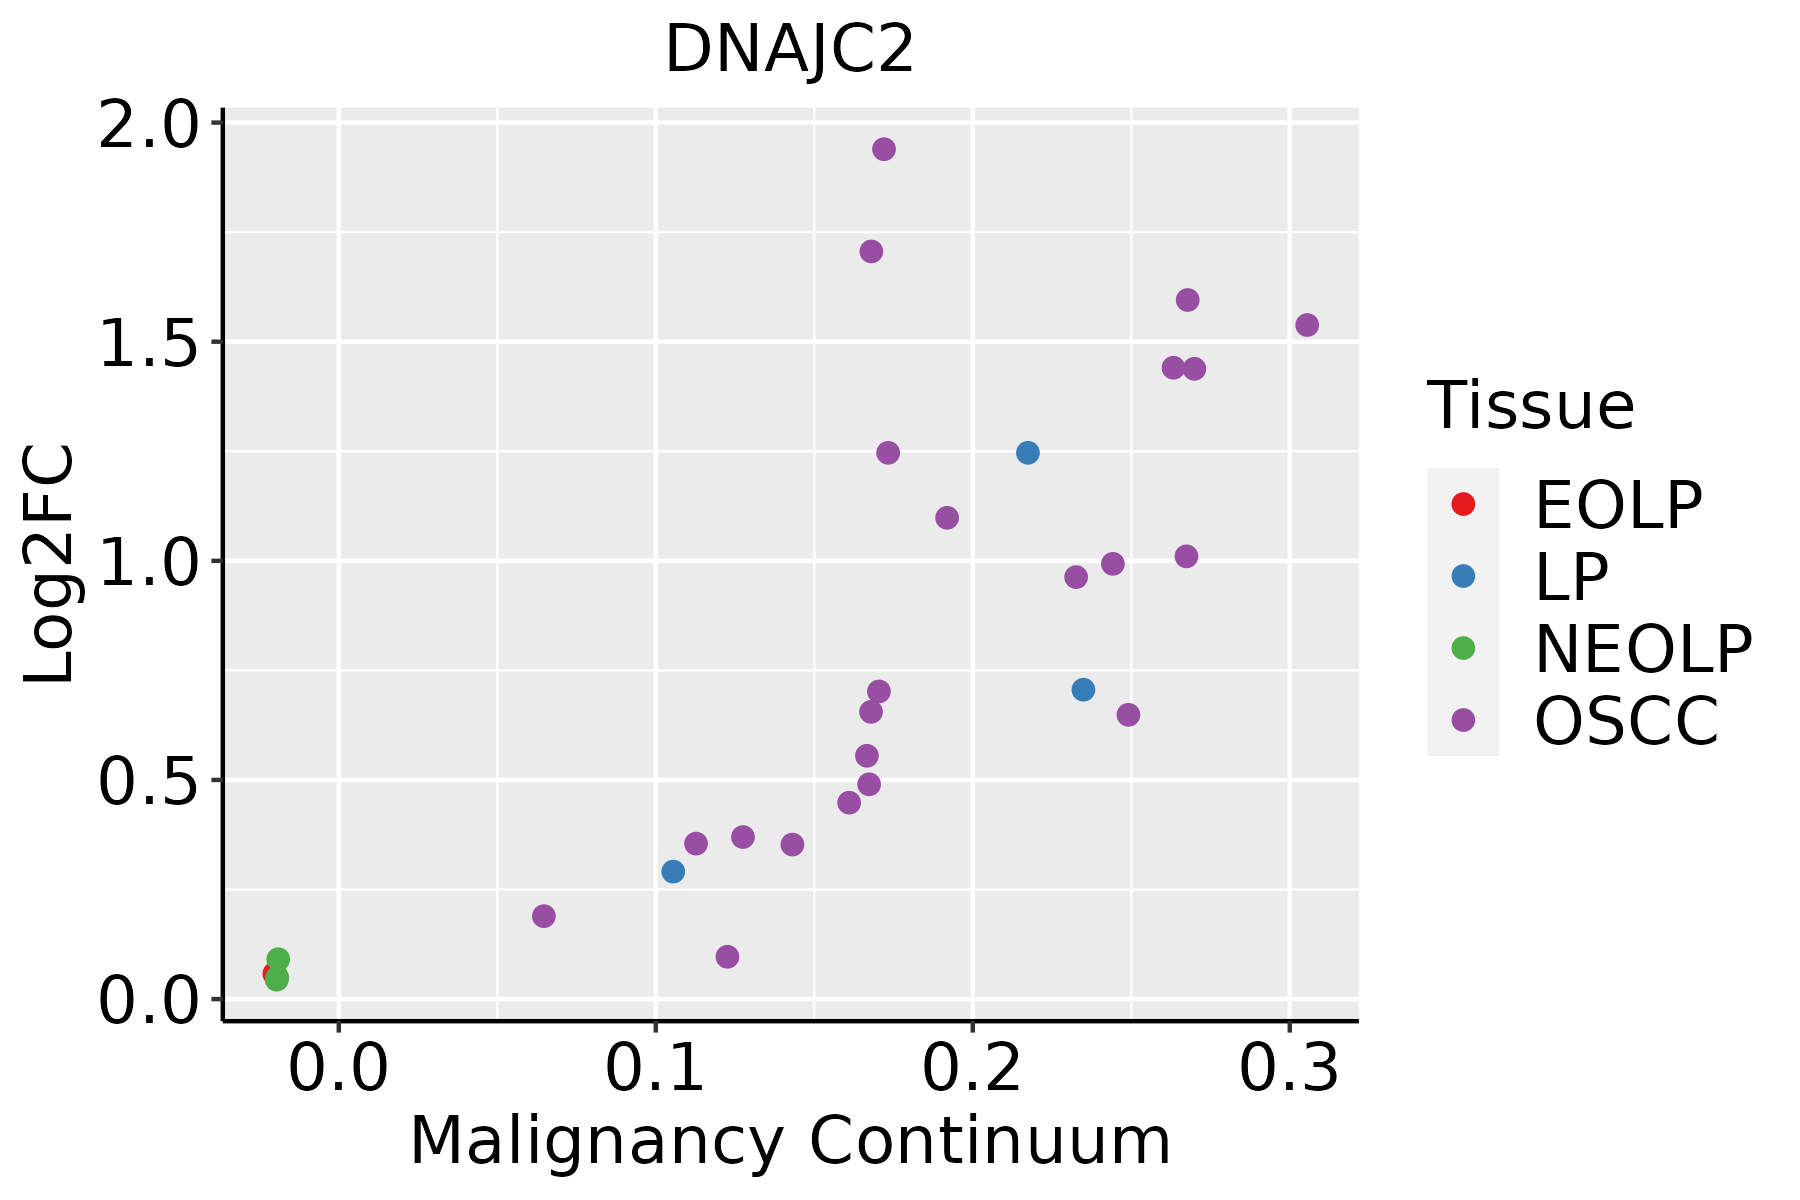 | EOLP: Erosive Oral lichen planus |
| LP: leukoplakia | ||
| NEOLP: Non-erosive oral lichen planus | ||
| OSCC: Oral squamous cell carcinoma | ||
| Prostate | 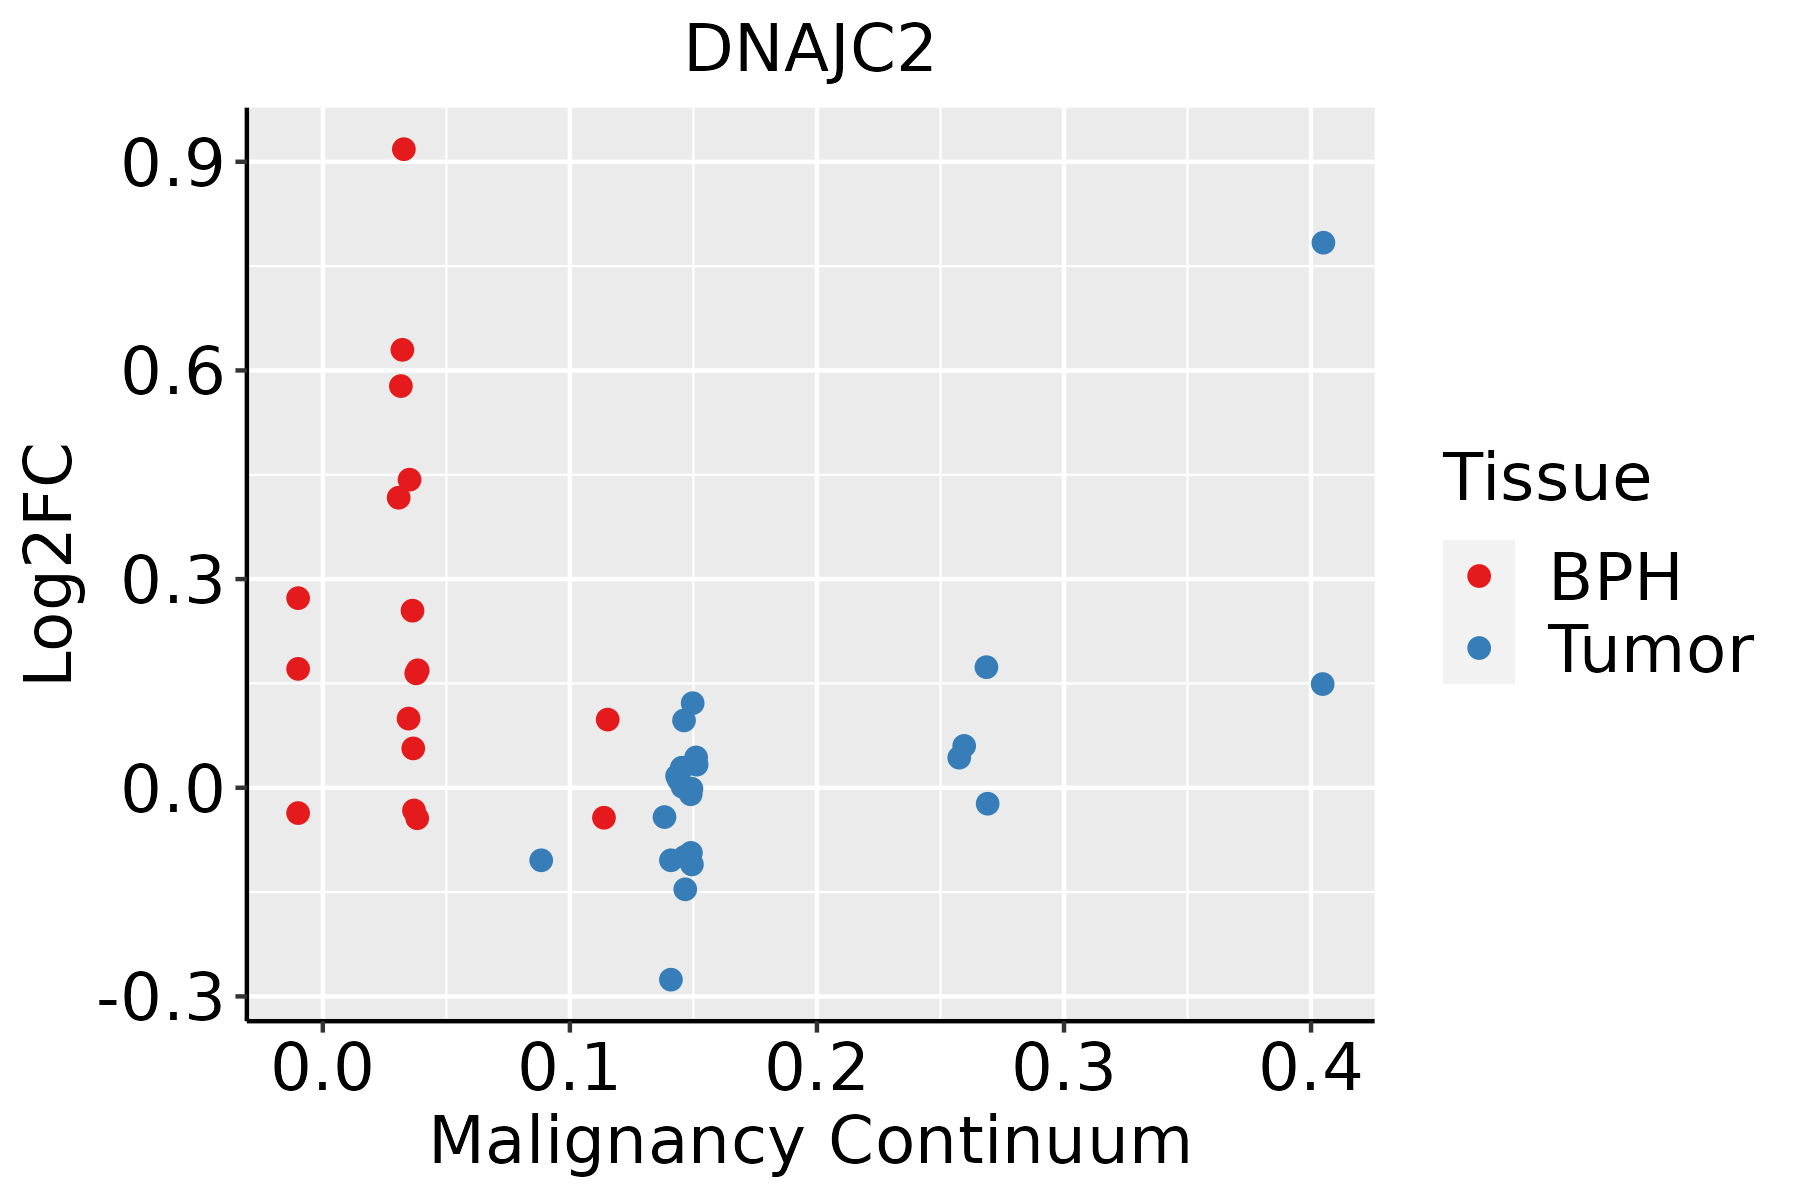 | BPH: Benign Prostatic Hyperplasia |
| Skin |  | AK: Actinic keratosis |
| cSCC: Cutaneous squamous cell carcinoma | ||
| SCCIS:squamous cell carcinoma in situ | ||
| Thyroid |  | ATC: Anaplastic thyroid cancer |
| HT: Hashimoto's thyroiditis | ||
| PTC: Papillary thyroid cancer |
| ∗log2FC in expression of this searched gene in stem-like cells from each diseased tissue sample relative to stem-like cells in normal samples in each tissue plotted against the malignancy continuum. Samples are colored based on if they are from different disease stage. |
Top |
Malignant transformation related pathway analysis |
| Find out the enriched GO biological processes and KEGG pathways involved in transition from healthy to precancer to cancer |
| Tissue | Disease Stage | Enriched GO biological Processes |
| Colorectum | AD |  |
| Colorectum | SER |  |
| Colorectum | MSS |  |
| Colorectum | MSI-H |  |
| Colorectum | FAP |  |
| ∗Top 15 enriched GO BP terms are showed in the bar plot of each disease state in each tissue. Each row represents a significant GO biological process which is colored according to the -log10(p.adjust). |
| Page: 1 2 3 4 5 6 7 8 9 |
| GO ID | Tissue | Disease Stage | Description | Gene Ratio | Bg Ratio | pvalue | p.adjust | Count |
| GO:000645720 | Esophagus | HGIN | protein folding | 75/2587 | 212/18723 | 1.61e-15 | 3.86e-13 | 75 |
| GO:003460520 | Esophagus | HGIN | cellular response to heat | 30/2587 | 69/18723 | 1.78e-09 | 1.35e-07 | 30 |
| GO:000632516 | Esophagus | HGIN | chromatin organization | 92/2587 | 409/18723 | 1.05e-06 | 4.16e-05 | 92 |
| GO:000645820 | Esophagus | HGIN | 'de novo' protein folding | 19/2587 | 43/18723 | 1.25e-06 | 4.83e-05 | 19 |
| GO:000940819 | Esophagus | HGIN | response to heat | 34/2587 | 110/18723 | 2.94e-06 | 1.01e-04 | 34 |
| GO:005105214 | Esophagus | HGIN | regulation of DNA metabolic process | 79/2587 | 359/18723 | 1.38e-05 | 3.85e-04 | 79 |
| GO:007189710 | Esophagus | HGIN | DNA biosynthetic process | 44/2587 | 180/18723 | 8.97e-05 | 1.96e-03 | 44 |
| GO:000926618 | Esophagus | HGIN | response to temperature stimulus | 42/2587 | 178/18723 | 2.91e-04 | 4.98e-03 | 42 |
| GO:200027819 | Esophagus | HGIN | regulation of DNA biosynthetic process | 28/2587 | 106/18723 | 4.30e-04 | 6.47e-03 | 28 |
| GO:19000344 | Esophagus | HGIN | regulation of cellular response to heat | 7/2587 | 17/18723 | 5.21e-03 | 4.30e-02 | 7 |
| GO:0002181111 | Esophagus | ESCC | cytoplasmic translation | 135/8552 | 148/18723 | 4.17e-32 | 2.65e-29 | 135 |
| GO:0006457110 | Esophagus | ESCC | protein folding | 163/8552 | 212/18723 | 1.13e-20 | 1.74e-18 | 163 |
| GO:0006417111 | Esophagus | ESCC | regulation of translation | 304/8552 | 468/18723 | 1.53e-17 | 1.33e-15 | 304 |
| GO:00062604 | Esophagus | ESCC | DNA replication | 181/8552 | 260/18723 | 3.55e-15 | 2.05e-13 | 181 |
| GO:005105215 | Esophagus | ESCC | regulation of DNA metabolic process | 232/8552 | 359/18723 | 2.40e-13 | 1.13e-11 | 232 |
| GO:007189716 | Esophagus | ESCC | DNA biosynthetic process | 127/8552 | 180/18723 | 1.04e-11 | 3.85e-10 | 127 |
| GO:2000278110 | Esophagus | ESCC | regulation of DNA biosynthetic process | 81/8552 | 106/18723 | 9.81e-11 | 2.96e-09 | 81 |
| GO:0061077110 | Esophagus | ESCC | chaperone-mediated protein folding | 56/8552 | 67/18723 | 1.52e-10 | 4.36e-09 | 56 |
| GO:000632517 | Esophagus | ESCC | chromatin organization | 240/8552 | 409/18723 | 6.52e-08 | 1.14e-06 | 240 |
| GO:0009408110 | Esophagus | ESCC | response to heat | 77/8552 | 110/18723 | 2.01e-07 | 3.11e-06 | 77 |
| Page: 1 2 3 4 5 6 7 |
| Pathway ID | Tissue | Disease Stage | Description | Gene Ratio | Bg Ratio | pvalue | p.adjust | qvalue | Count |
| Page: 1 |
Top |
Cell-cell communication analysis |
| Identification of potential cell-cell interactions between two cell types and their ligand-receptor pairs for different disease states |
| Ligand | Receptor | LRpair | Pathway | Tissue | Disease Stage |
| Page: 1 |
Top |
Single-cell gene regulatory network inference analysis |
| Find out the significant the regulons (TFs) and the target genes of each regulon across cell types for different disease states |
| TF | Cell Type | Tissue | Disease Stage | Target Gene | RSS | Regulon Activity |
| ∗The dot plots of a searched regulon are shown for all cell subpopulations in each disease state of each tissue based on the regulon specific score inferred using pySCENIC and by calculating the average expression. |
| Page: 1 |
Top |
Somatic mutation of malignant transformation related genes |
| Annotation of somatic variants for genes involved in malignant transformation |
| Hugo Symbol | Variant Class | Variant Classification | dbSNP RS | HGVSc | HGVSp | HGVSp Short | SWISSPROT | BIOTYPE | SIFT | PolyPhen | Tumor Sample Barcode | Tissue | Histology | Sex | Age | Stage | Therapy Types | Drugs | Outcome |
| DNAJC2 | SNV | Missense_Mutation | c.1337N>T | p.Gly446Val | p.G446V | Q99543 | protein_coding | tolerated(0.22) | benign(0.036) | TCGA-AC-A23H-01 | Breast | breast invasive carcinoma | Female | >=65 | I/II | Unknown | Unknown | PD | |
| DNAJC2 | SNV | Missense_Mutation | novel | c.1633N>C | p.Glu545Gln | p.E545Q | Q99543 | protein_coding | deleterious(0.03) | benign(0.255) | TCGA-BH-A0B6-01 | Breast | breast invasive carcinoma | Female | <65 | I/II | Unknown | Unknown | SD |
| DNAJC2 | SNV | Missense_Mutation | c.214G>C | p.Glu72Gln | p.E72Q | Q99543 | protein_coding | tolerated(0.07) | probably_damaging(0.979) | TCGA-C8-A12T-01 | Breast | breast invasive carcinoma | Female | <65 | I/II | Unknown | Unknown | SD | |
| DNAJC2 | deletion | Frame_Shift_Del | c.1196_1197delTC | p.Leu399HisfsTer21 | p.L399Hfs*21 | Q99543 | protein_coding | TCGA-A2-A0D3-01 | Breast | breast invasive carcinoma | Female | <65 | I/II | Chemotherapy | carboplatin | SD | |||
| DNAJC2 | SNV | Missense_Mutation | novel | c.1234G>C | p.Glu412Gln | p.E412Q | Q99543 | protein_coding | tolerated(0.62) | benign(0.123) | TCGA-DS-A1OB-01 | Cervix | cervical & endocervical cancer | Female | <65 | I/II | Chemotherapy | carboplatin | PD |
| DNAJC2 | SNV | Missense_Mutation | c.1070N>T | p.Arg357Leu | p.R357L | Q99543 | protein_coding | deleterious(0) | probably_damaging(0.947) | TCGA-MU-A51Y-01 | Cervix | cervical & endocervical cancer | Female | <65 | I/II | Unknown | Unknown | SD | |
| DNAJC2 | SNV | Missense_Mutation | c.1860G>T | p.Lys620Asn | p.K620N | Q99543 | protein_coding | deleterious_low_confidence(0.01) | benign(0.224) | TCGA-A6-5664-01 | Colorectum | colon adenocarcinoma | Male | >=65 | III/IV | Chemotherapy | fluorouracil | SD | |
| DNAJC2 | SNV | Missense_Mutation | c.647N>A | p.Ser216Tyr | p.S216Y | Q99543 | protein_coding | deleterious(0) | possibly_damaging(0.768) | TCGA-A6-6141-01 | Colorectum | colon adenocarcinoma | Male | <65 | I/II | Chemotherapy | 5-fu | SD | |
| DNAJC2 | SNV | Missense_Mutation | c.668C>A | p.Ser223Tyr | p.S223Y | Q99543 | protein_coding | deleterious(0) | probably_damaging(0.974) | TCGA-AA-3984-01 | Colorectum | colon adenocarcinoma | Female | <65 | I/II | Unknown | Unknown | SD | |
| DNAJC2 | SNV | Missense_Mutation | c.784N>A | p.Glu262Lys | p.E262K | Q99543 | protein_coding | deleterious(0.04) | probably_damaging(0.98) | TCGA-AZ-4315-01 | Colorectum | colon adenocarcinoma | Male | <65 | I/II | Unknown | Unknown | SD |
| Page: 1 2 3 4 5 6 7 |
Top |
Related drugs of malignant transformation related genes |
| Identification of chemicals and drugs interact with genes involved in malignant transfromation |
| (DGIdb 4.0) |
| Entrez ID | Symbol | Category | Interaction Types | Drug Claim Name | Drug Name | PMIDs |
| Page: 1 |

Copyright 2023-Present -The University of Texas Health Science Center at Houston |