
|
|||||
|
 | |
| |
| |
| |
| |
| |
|
Gene: DNAJC18 |
Gene summary for DNAJC18 |
| Gene information | Species | Human | Gene symbol | DNAJC18 | Gene ID | 202052 |
| Gene name | DnaJ heat shock protein family (Hsp40) member C18 | |
| Gene Alias | DNAJC18 | |
| Cytomap | 5q31.2 | |
| Gene Type | protein-coding | GO ID | GO:0006457 | UniProtAcc | Q9H819 |
Top |
Malignant transformation analysis |
| Identification of the aberrant gene expression in precancerous and cancerous lesions by comparing the gene expression of stem-like cells in diseased tissues with normal stem cells |
| Entrez ID | Symbol | Replicates | Species | Organ | Tissue | Adj P-value | Log2FC | Malignancy |
| 202052 | DNAJC18 | HCC1_Meng | Human | Liver | HCC | 6.99e-20 | 2.38e-02 | 0.0246 |
| 202052 | DNAJC18 | HCC1 | Human | Liver | HCC | 2.57e-02 | 1.40e+00 | 0.5336 |
| 202052 | DNAJC18 | HCC2 | Human | Liver | HCC | 8.62e-07 | 7.37e-01 | 0.5341 |
| 202052 | DNAJC18 | HCC5 | Human | Liver | HCC | 3.43e-08 | 1.44e+00 | 0.4932 |
| 202052 | DNAJC18 | S015 | Human | Liver | HCC | 4.32e-03 | 1.57e-01 | 0.2375 |
| Page: 1 |
| Tissue | Expression Dynamics | Abbreviation |
| Liver | 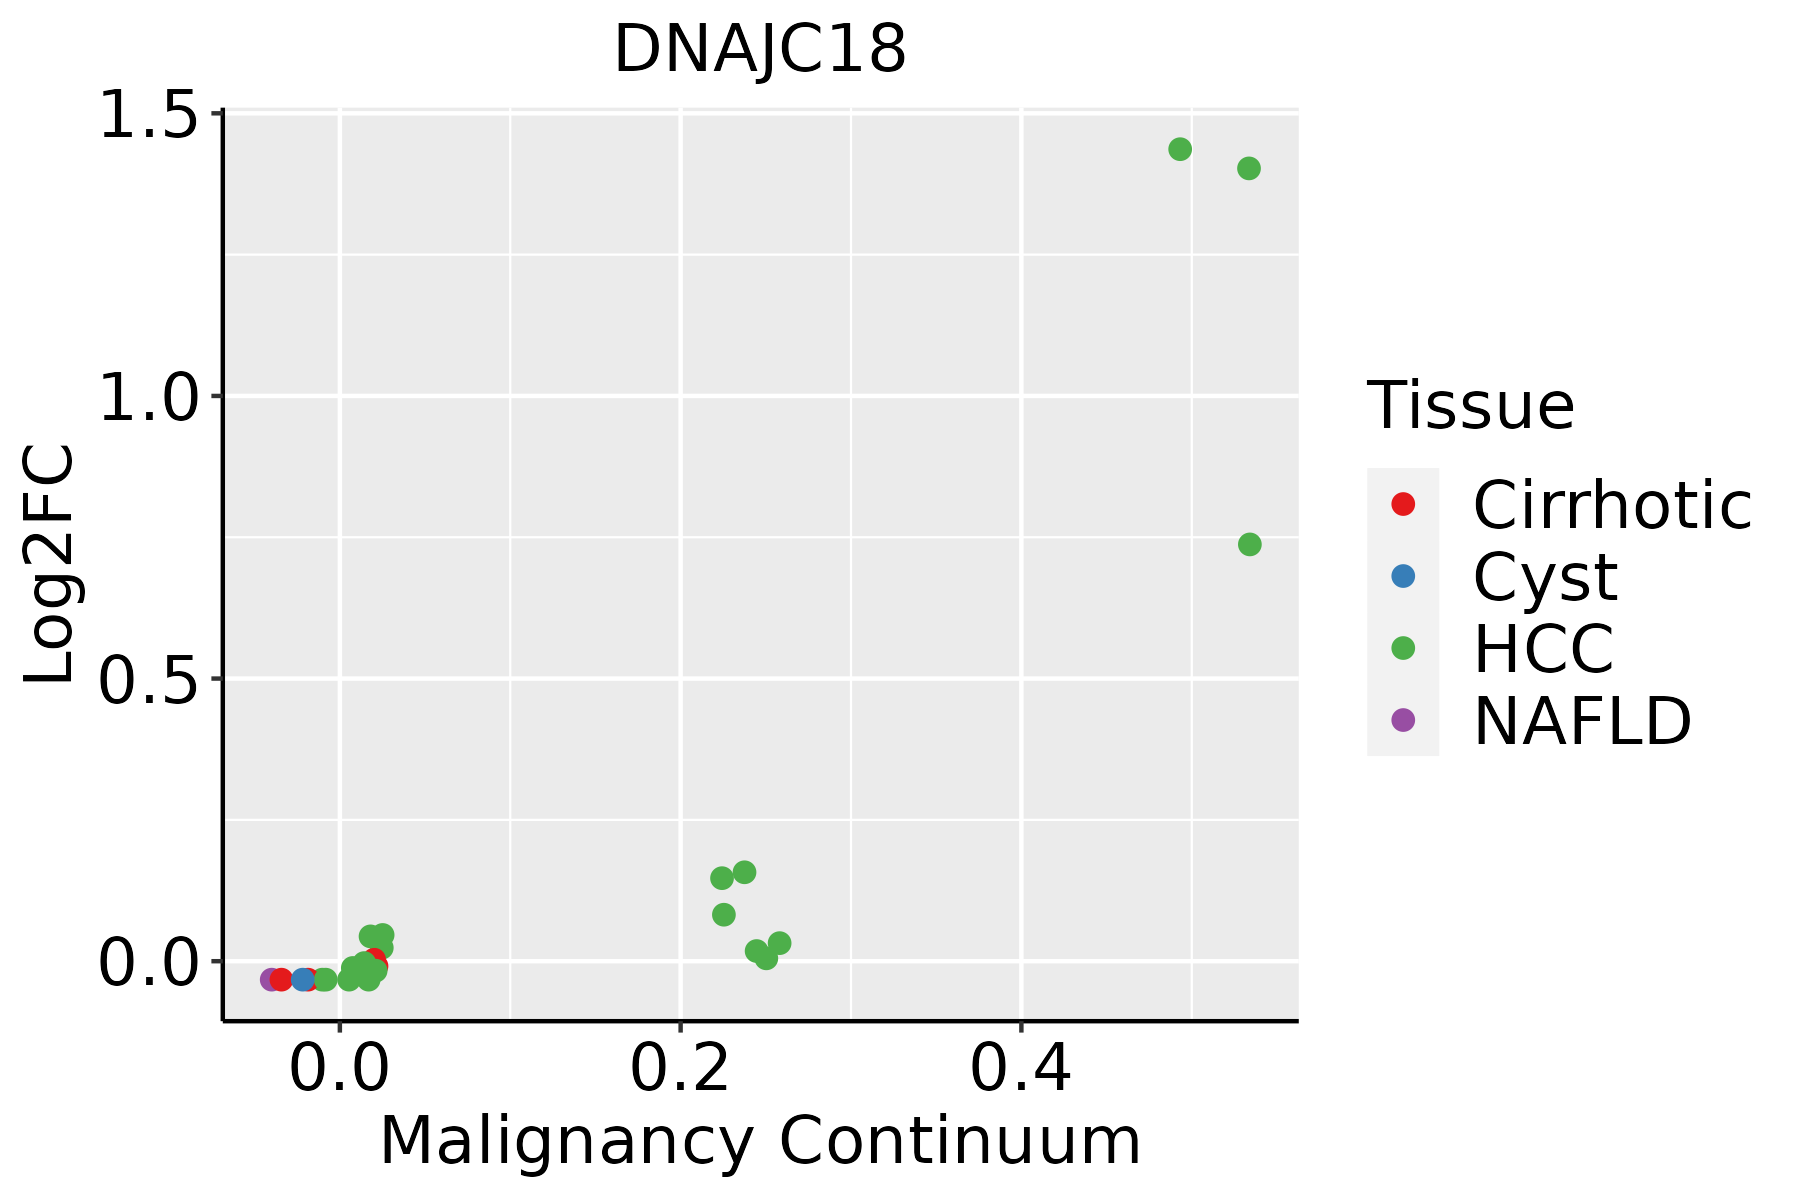 | HCC: Hepatocellular carcinoma |
| NAFLD: Non-alcoholic fatty liver disease |
| ∗log2FC in expression of this searched gene in stem-like cells from each diseased tissue sample relative to stem-like cells in normal samples in each tissue plotted against the malignancy continuum. Samples are colored based on if they are from different disease stage. |
Top |
Malignant transformation related pathway analysis |
| Find out the enriched GO biological processes and KEGG pathways involved in transition from healthy to precancer to cancer |
| Tissue | Disease Stage | Enriched GO biological Processes |
| Colorectum | AD |  |
| Colorectum | SER |  |
| Colorectum | MSS |  |
| Colorectum | MSI-H |  |
| Colorectum | FAP |  |
| ∗Top 15 enriched GO BP terms are showed in the bar plot of each disease state in each tissue. Each row represents a significant GO biological process which is colored according to the -log10(p.adjust). |
| Page: 1 2 3 4 5 6 7 8 9 |
| GO ID | Tissue | Disease Stage | Description | Gene Ratio | Bg Ratio | pvalue | p.adjust | Count |
| GO:001049822 | Liver | HCC | proteasomal protein catabolic process | 351/7958 | 490/18723 | 6.92e-40 | 1.46e-36 | 351 |
| GO:004316122 | Liver | HCC | proteasome-mediated ubiquitin-dependent protein catabolic process | 299/7958 | 412/18723 | 7.82e-36 | 8.27e-33 | 299 |
| GO:003497612 | Liver | HCC | response to endoplasmic reticulum stress | 189/7958 | 256/18723 | 1.43e-24 | 4.06e-22 | 189 |
| GO:000645712 | Liver | HCC | protein folding | 160/7958 | 212/18723 | 1.07e-22 | 1.88e-20 | 160 |
| GO:003596612 | Liver | HCC | response to topologically incorrect protein | 123/7958 | 159/18723 | 2.60e-19 | 3.44e-17 | 123 |
| GO:003650311 | Liver | HCC | ERAD pathway | 88/7958 | 107/18723 | 2.87e-17 | 2.85e-15 | 88 |
| GO:00304331 | Liver | HCC | ubiquitin-dependent ERAD pathway | 72/7958 | 85/18723 | 9.78e-16 | 7.47e-14 | 72 |
| GO:003596712 | Liver | HCC | cellular response to topologically incorrect protein | 89/7958 | 116/18723 | 5.61e-14 | 3.39e-12 | 89 |
| GO:006107712 | Liver | HCC | chaperone-mediated protein folding | 56/7958 | 67/18723 | 4.86e-12 | 2.14e-10 | 56 |
| GO:000645812 | Liver | HCC | 'de novo' protein folding | 36/7958 | 43/18723 | 3.15e-08 | 7.10e-07 | 36 |
| GO:00517882 | Liver | HCC | response to misfolded protein | 23/7958 | 25/18723 | 2.95e-07 | 5.14e-06 | 23 |
| GO:005108412 | Liver | HCC | 'de novo' posttranslational protein folding | 32/7958 | 39/18723 | 4.73e-07 | 7.69e-06 | 32 |
| GO:007121811 | Liver | HCC | cellular response to misfolded protein | 21/7958 | 23/18723 | 1.39e-06 | 2.01e-05 | 21 |
| GO:005108512 | Liver | HCC | chaperone cofactor-dependent protein refolding | 27/7958 | 34/18723 | 1.24e-05 | 1.39e-04 | 27 |
| Page: 1 |
| Pathway ID | Tissue | Disease Stage | Description | Gene Ratio | Bg Ratio | pvalue | p.adjust | qvalue | Count |
| Page: 1 |
Top |
Cell-cell communication analysis |
| Identification of potential cell-cell interactions between two cell types and their ligand-receptor pairs for different disease states |
| Ligand | Receptor | LRpair | Pathway | Tissue | Disease Stage |
| Page: 1 |
Top |
Single-cell gene regulatory network inference analysis |
| Find out the significant the regulons (TFs) and the target genes of each regulon across cell types for different disease states |
| TF | Cell Type | Tissue | Disease Stage | Target Gene | RSS | Regulon Activity |
| ∗The dot plots of a searched regulon are shown for all cell subpopulations in each disease state of each tissue based on the regulon specific score inferred using pySCENIC and by calculating the average expression. |
| Page: 1 |
Top |
Somatic mutation of malignant transformation related genes |
| Annotation of somatic variants for genes involved in malignant transformation |
| Hugo Symbol | Variant Class | Variant Classification | dbSNP RS | HGVSc | HGVSp | HGVSp Short | SWISSPROT | BIOTYPE | SIFT | PolyPhen | Tumor Sample Barcode | Tissue | Histology | Sex | Age | Stage | Therapy Types | Drugs | Outcome |
| DNAJC18 | insertion | Frame_Shift_Ins | novel | c.530_531insAGGCAAGGAAGGGTCAGGCG | p.Asn177LysfsTer26 | p.N177Kfs*26 | Q9H819 | protein_coding | TCGA-A2-A0ER-01 | Breast | breast invasive carcinoma | Female | <65 | I/II | Chemotherapy | cytoxan | SD | ||
| DNAJC18 | insertion | Nonsense_Mutation | novel | c.461_462insTTGATGGTACATGGTCAAGTTTTAGAAGTTGAACCTGAGATATGTT | p.Pro155Ter | p.P155* | Q9H819 | protein_coding | TCGA-AO-A0JB-01 | Breast | breast invasive carcinoma | Female | <65 | III/IV | Chemotherapy | cyclophosphamide | SD | ||
| DNAJC18 | SNV | Missense_Mutation | novel | c.913N>C | p.Asp305His | p.D305H | Q9H819 | protein_coding | deleterious(0.03) | probably_damaging(0.957) | TCGA-JW-A5VL-01 | Cervix | cervical & endocervical cancer | Female | <65 | I/II | Unknown | Unknown | SD |
| DNAJC18 | SNV | Missense_Mutation | c.1043N>G | p.Leu348Arg | p.L348R | Q9H819 | protein_coding | deleterious(0) | probably_damaging(0.999) | TCGA-AA-A00N-01 | Colorectum | colon adenocarcinoma | Male | >=65 | I/II | Unknown | Unknown | PD | |
| DNAJC18 | SNV | Missense_Mutation | rs202006277 | c.611N>A | p.Arg204Gln | p.R204Q | Q9H819 | protein_coding | tolerated(0.21) | benign(0) | TCGA-AA-A00N-01 | Colorectum | colon adenocarcinoma | Male | >=65 | I/II | Unknown | Unknown | PD |
| DNAJC18 | SNV | Missense_Mutation | c.872N>A | p.Ser291Tyr | p.S291Y | Q9H819 | protein_coding | deleterious(0.03) | benign(0.358) | TCGA-AZ-4315-01 | Colorectum | colon adenocarcinoma | Male | <65 | I/II | Unknown | Unknown | SD | |
| DNAJC18 | SNV | Missense_Mutation | c.589N>T | p.Asp197Tyr | p.D197Y | Q9H819 | protein_coding | tolerated(1) | benign(0.143) | TCGA-AZ-4315-01 | Colorectum | colon adenocarcinoma | Male | <65 | I/II | Unknown | Unknown | SD | |
| DNAJC18 | SNV | Missense_Mutation | c.80N>G | p.Asp27Gly | p.D27G | Q9H819 | protein_coding | tolerated(0.84) | benign(0) | TCGA-CK-5913-01 | Colorectum | colon adenocarcinoma | Female | <65 | I/II | Unknown | Unknown | SD | |
| DNAJC18 | SNV | Missense_Mutation | novel | c.722T>C | p.Ile241Thr | p.I241T | Q9H819 | protein_coding | deleterious(0) | benign(0.395) | TCGA-F4-6809-01 | Colorectum | colon adenocarcinoma | Female | <65 | I/II | Unknown | Unknown | PD |
| DNAJC18 | SNV | Missense_Mutation | rs201230885 | c.620N>A | p.Arg207Gln | p.R207Q | Q9H819 | protein_coding | deleterious(0.04) | probably_damaging(0.987) | TCGA-AG-3892-01 | Colorectum | rectum adenocarcinoma | Female | <65 | I/II | Unknown | Unknown | SD |
| Page: 1 2 3 4 |
Top |
Related drugs of malignant transformation related genes |
| Identification of chemicals and drugs interact with genes involved in malignant transfromation |
| (DGIdb 4.0) |
| Entrez ID | Symbol | Category | Interaction Types | Drug Claim Name | Drug Name | PMIDs |
| Page: 1 |

Copyright 2023-Present -The University of Texas Health Science Center at Houston |