| Tissue | Expression Dynamics | Abbreviation |
| Cervix |  | CC: Cervix cancer |
| HSIL_HPV: HPV-infected high-grade squamous intraepithelial lesions |
| N_HPV: HPV-infected normal cervix |
| Colorectum (GSE201348) | 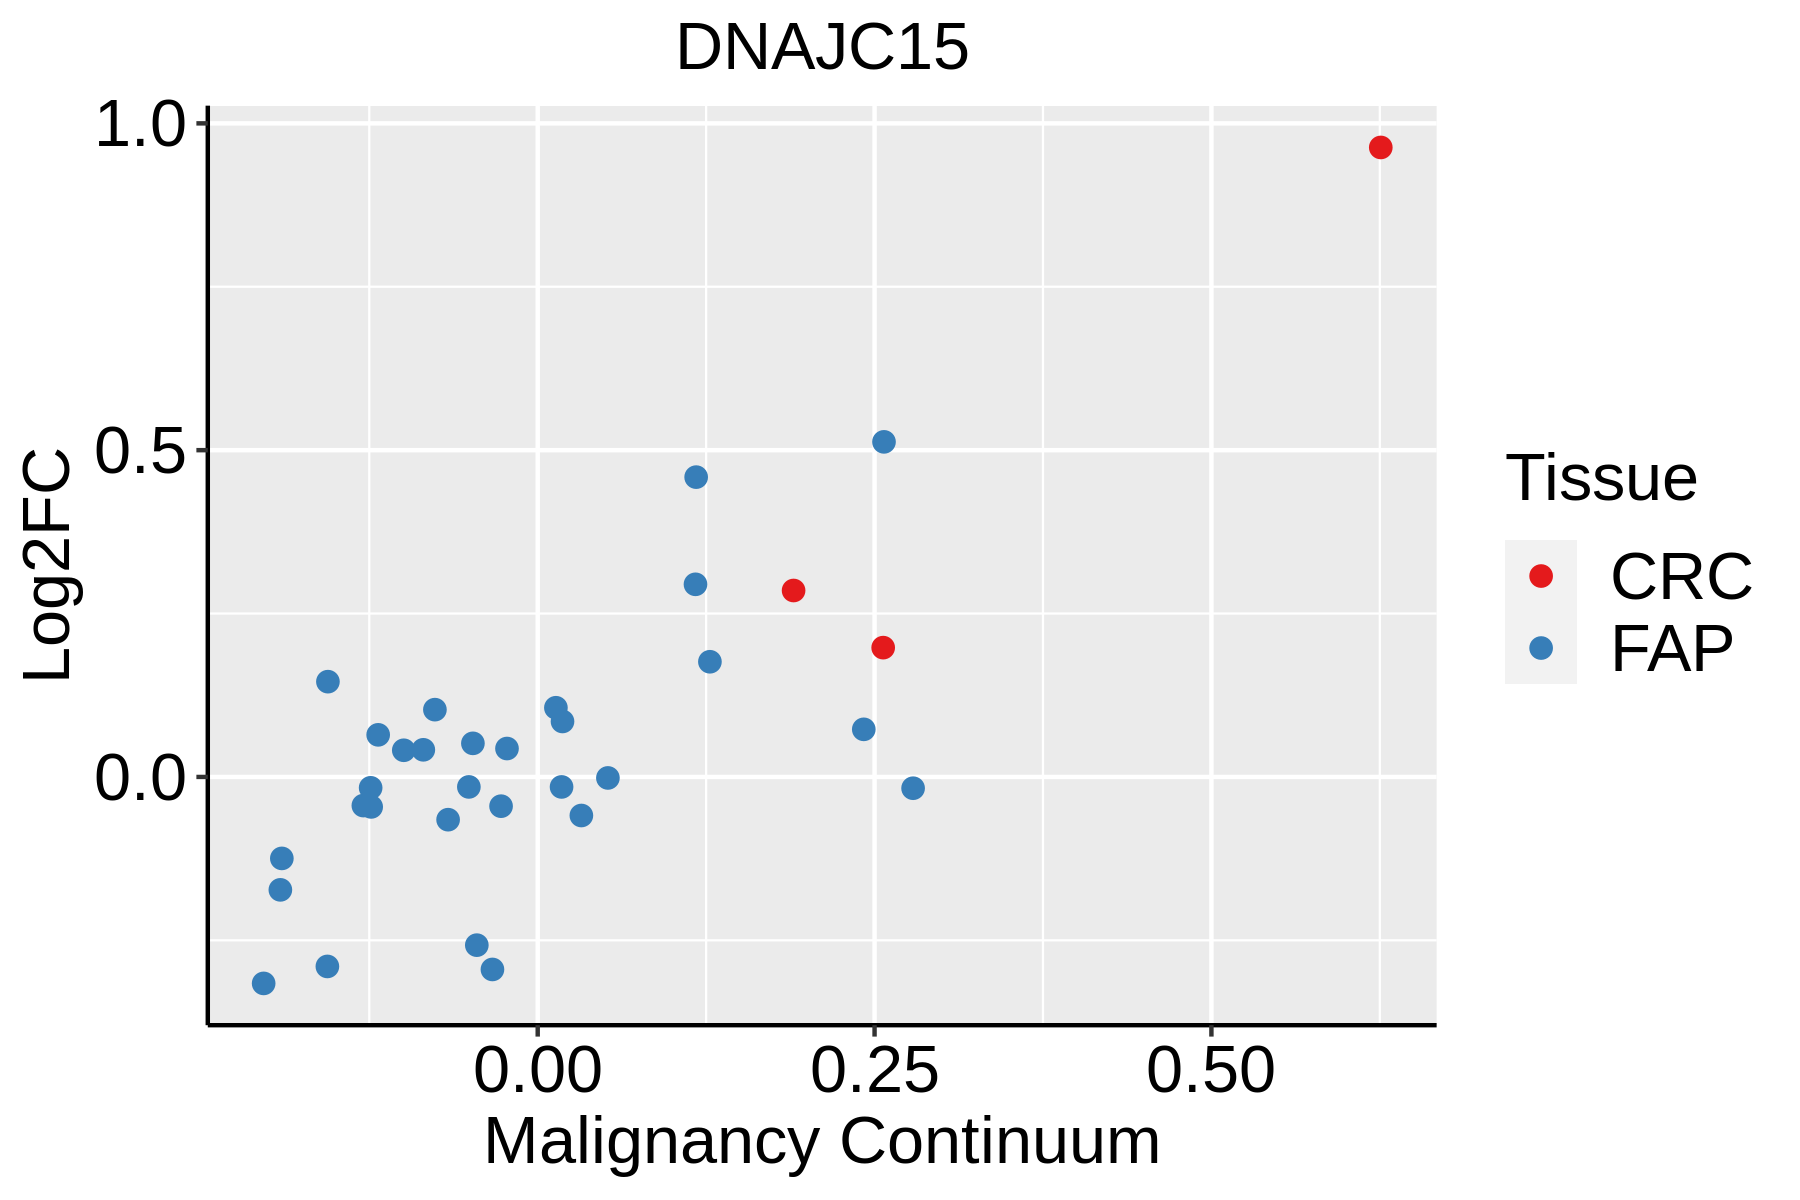 | FAP: Familial adenomatous polyposis |
| CRC: Colorectal cancer |
| Colorectum (HTA11) | 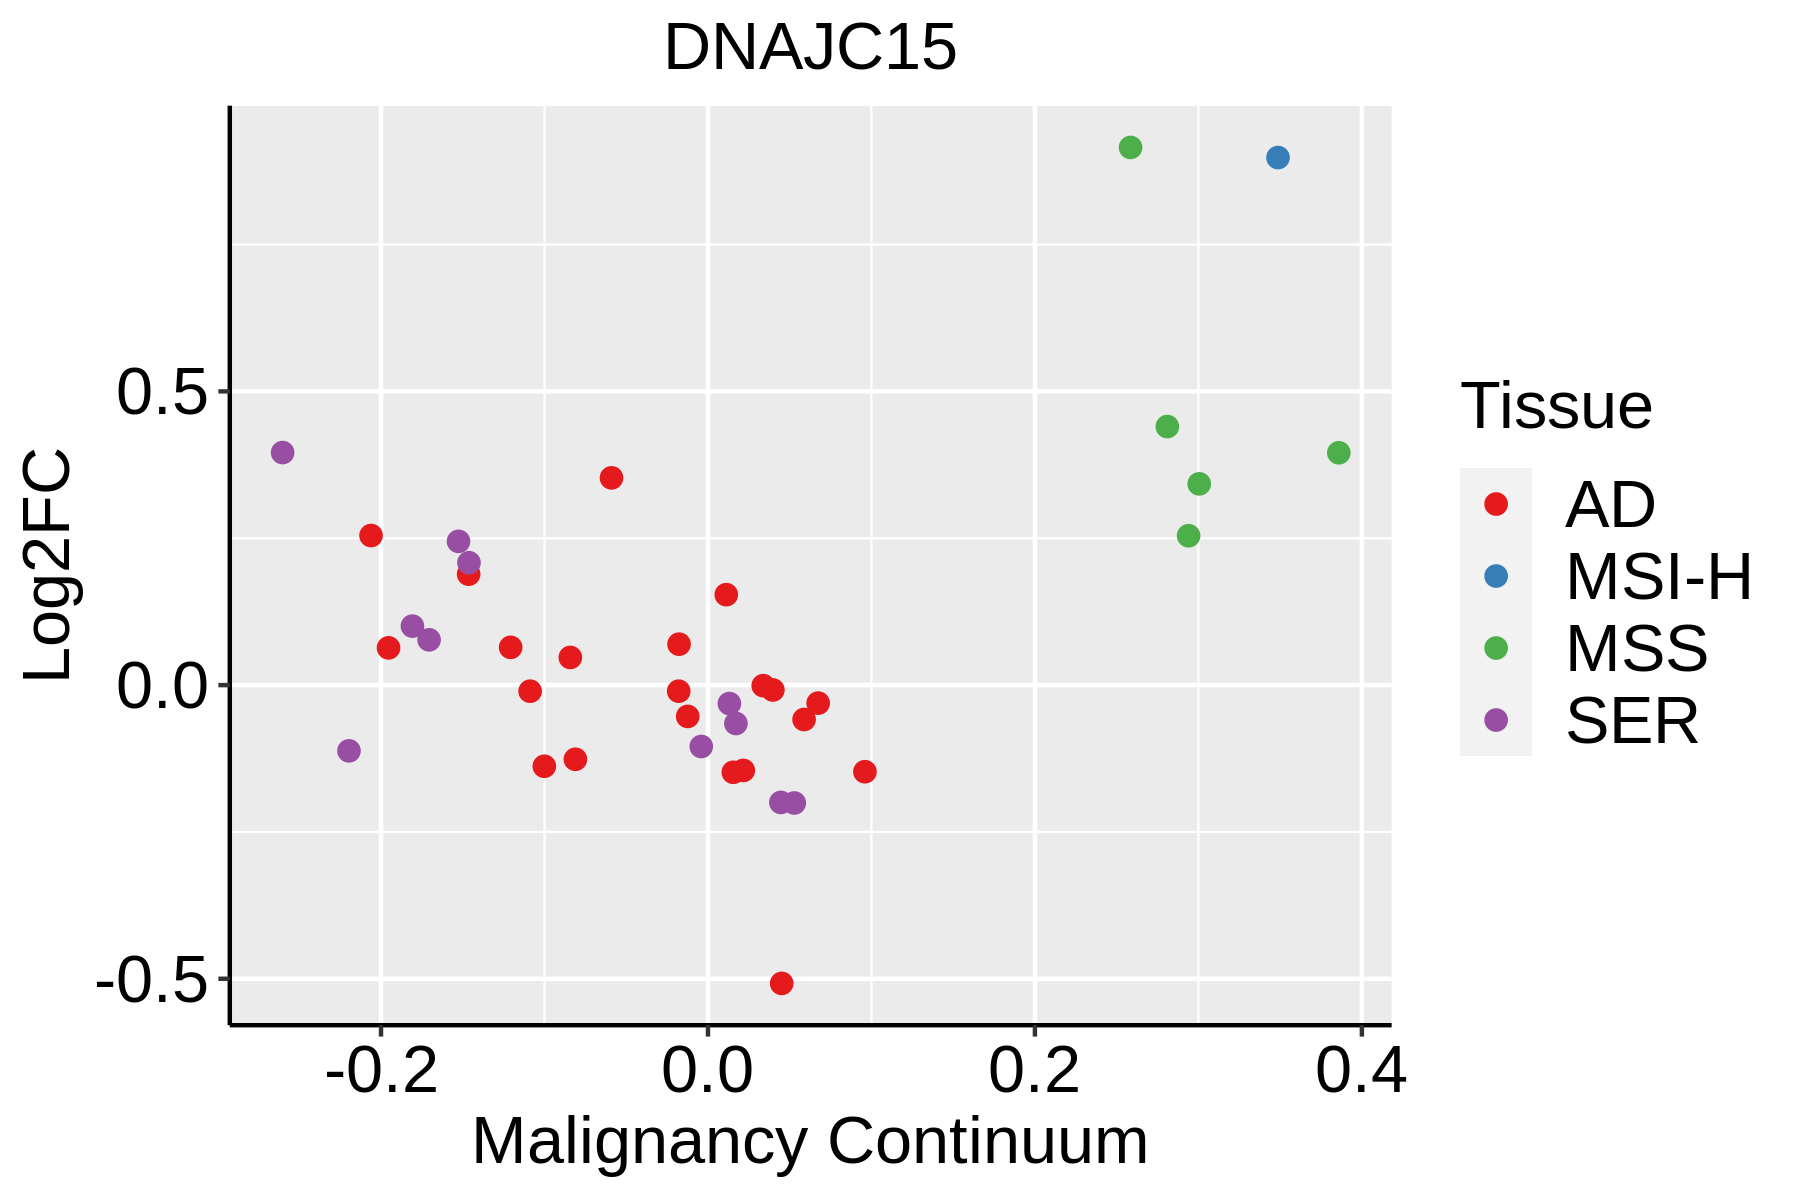 | AD: Adenomas |
| SER: Sessile serrated lesions |
| MSI-H: Microsatellite-high colorectal cancer |
| MSS: Microsatellite stable colorectal cancer |
| Endometrium | 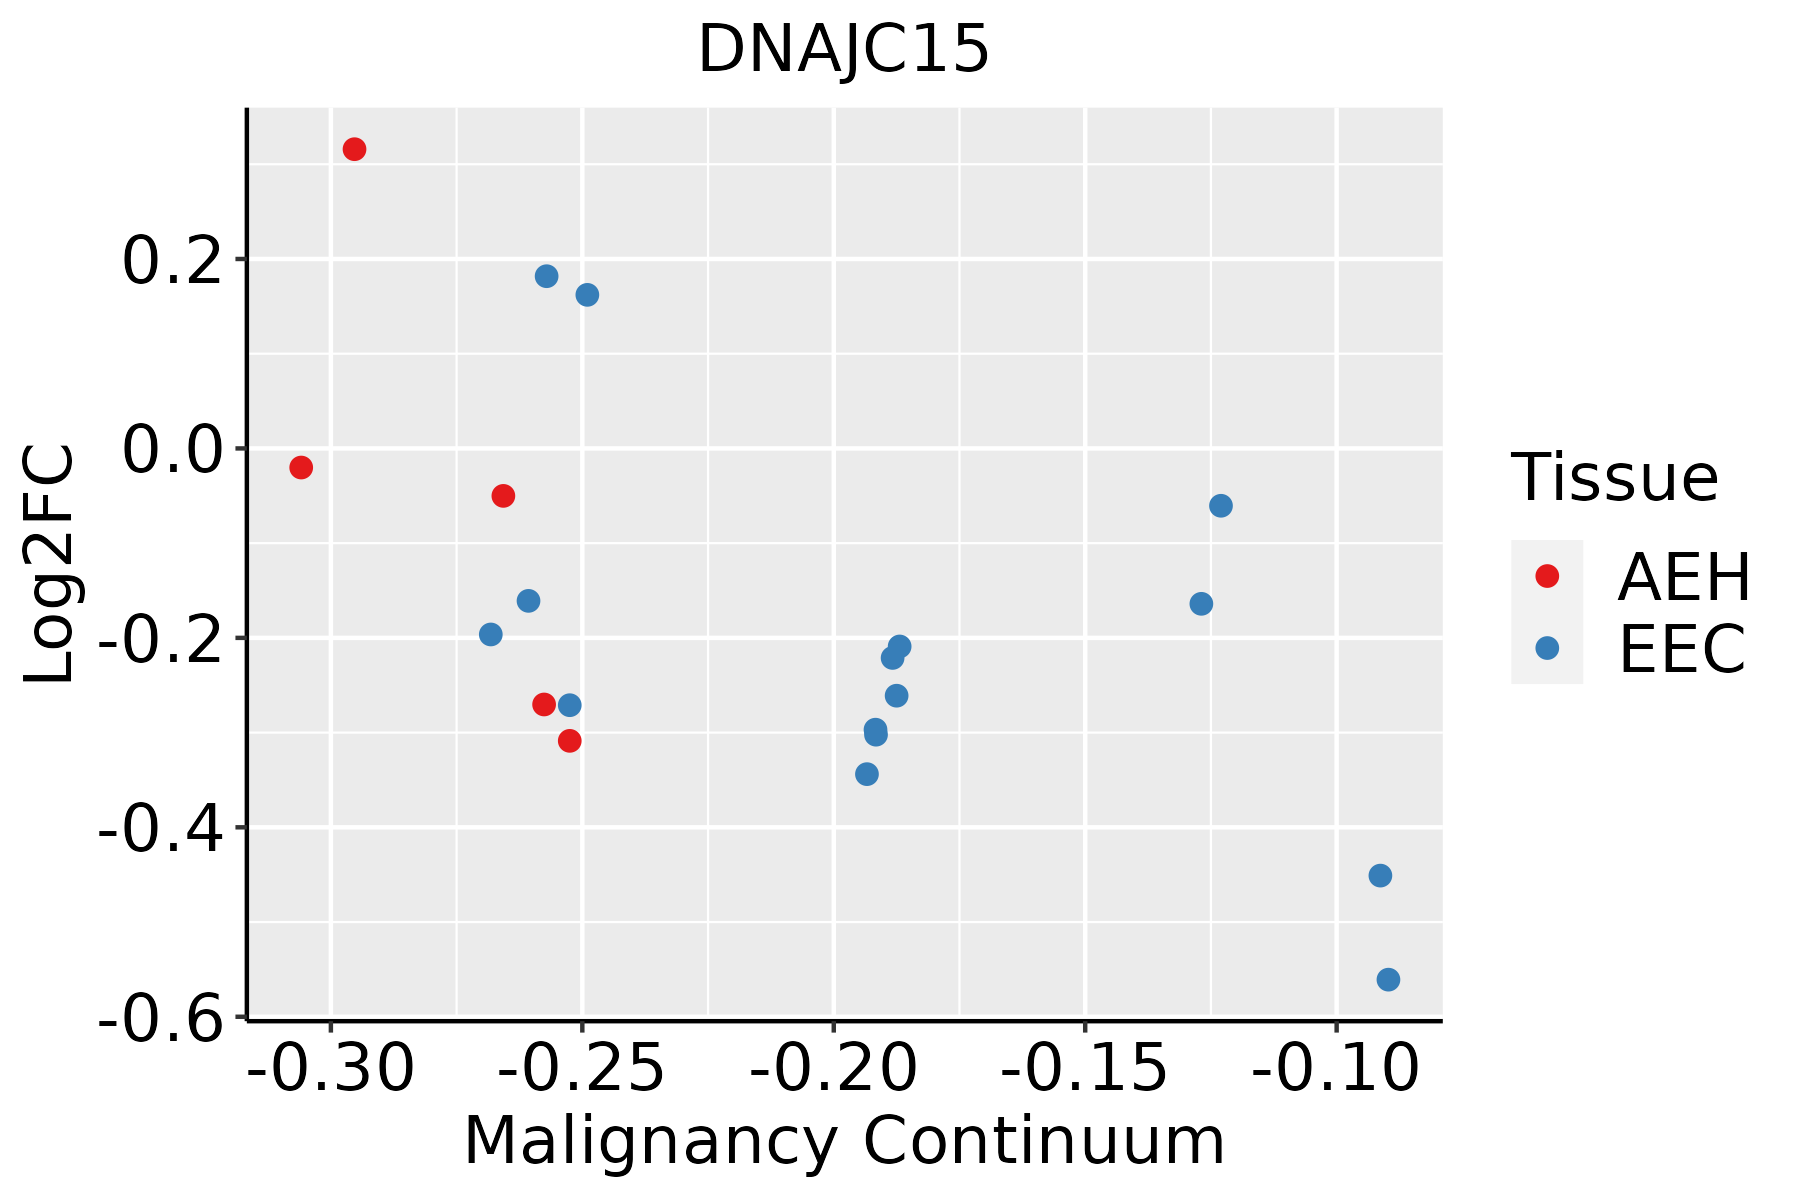 | AEH: Atypical endometrial hyperplasia |
| EEC: Endometrioid Cancer |
| Esophagus | 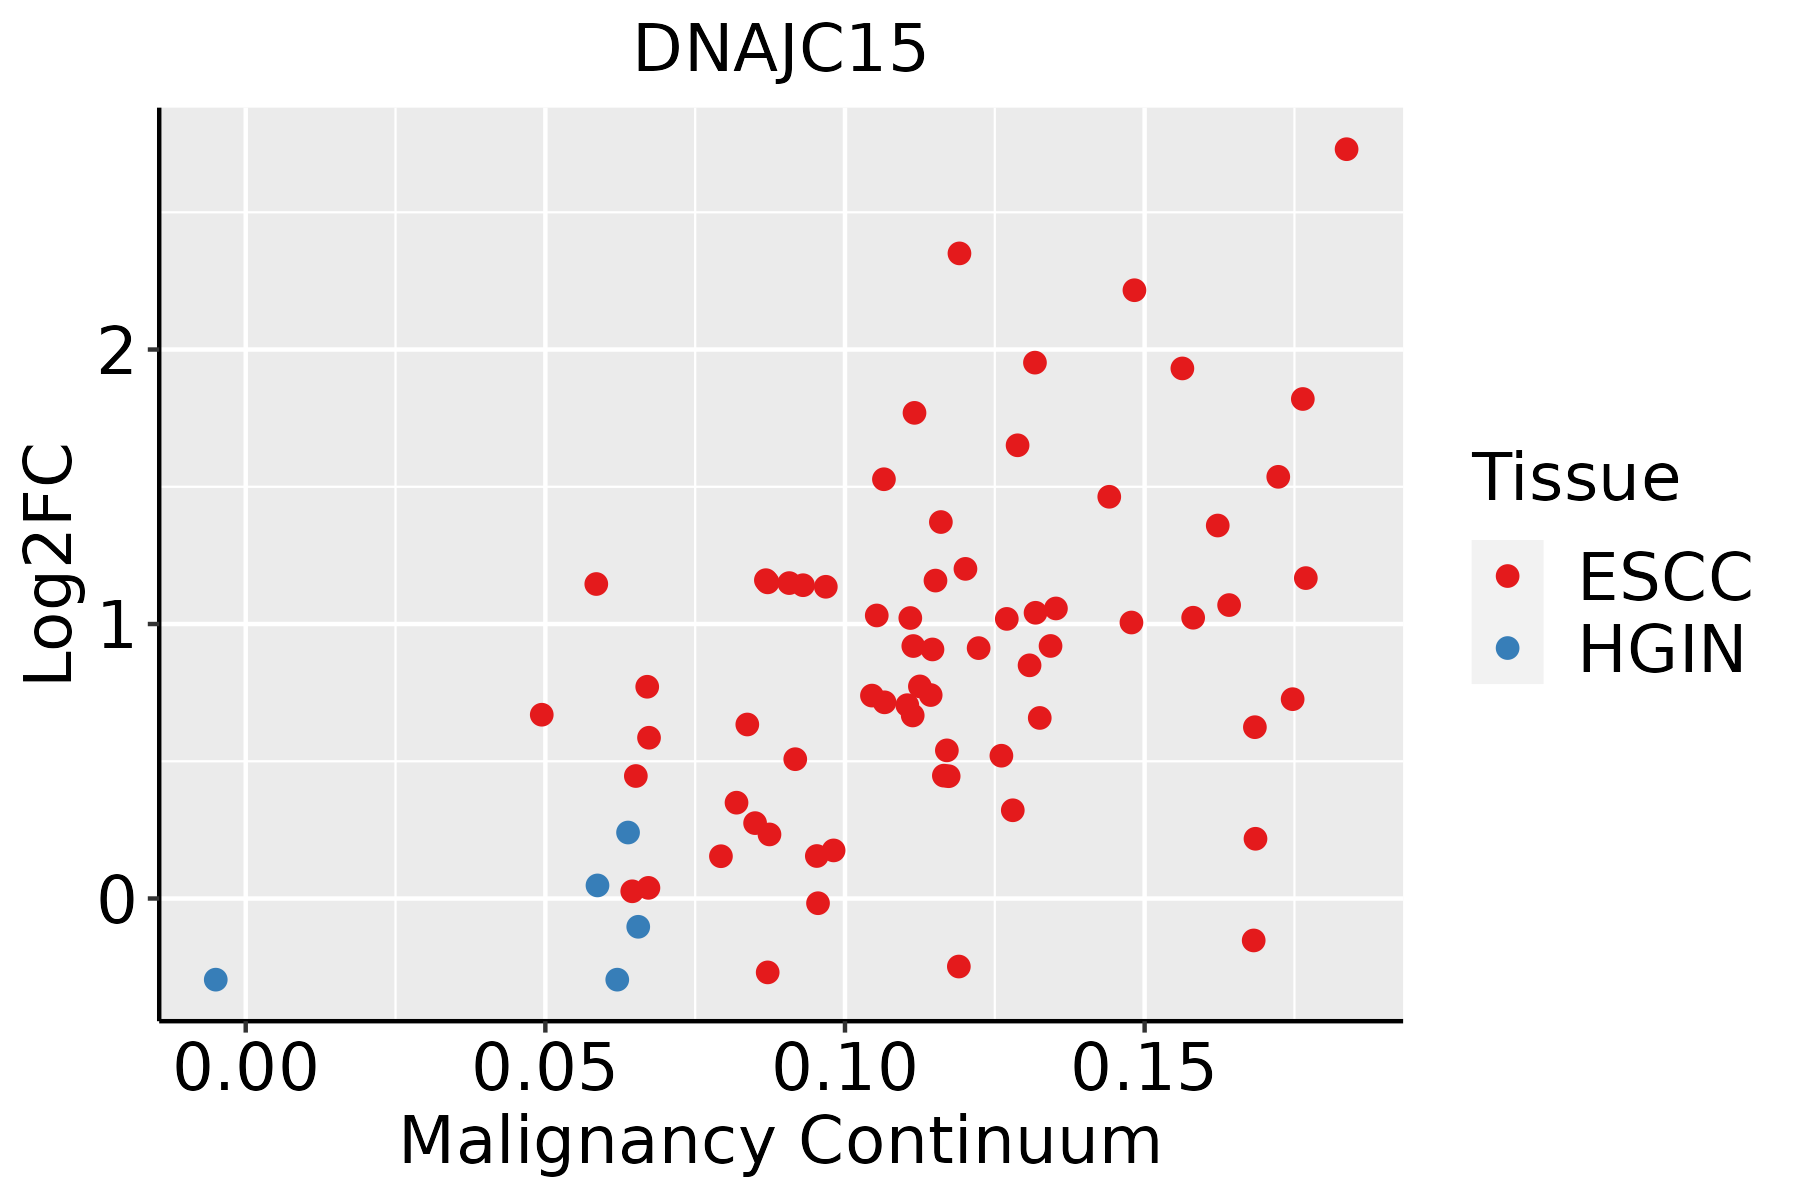 | ESCC: Esophageal squamous cell carcinoma |
| HGIN: High-grade intraepithelial neoplasias |
| LGIN: Low-grade intraepithelial neoplasias |
| Liver |  | HCC: Hepatocellular carcinoma |
| NAFLD: Non-alcoholic fatty liver disease |
| Oral Cavity |  | EOLP: Erosive Oral lichen planus |
| LP: leukoplakia |
| NEOLP: Non-erosive oral lichen planus |
| OSCC: Oral squamous cell carcinoma |
| Skin |  | AK: Actinic keratosis |
| cSCC: Cutaneous squamous cell carcinoma |
| SCCIS:squamous cell carcinoma in situ |
| Thyroid | 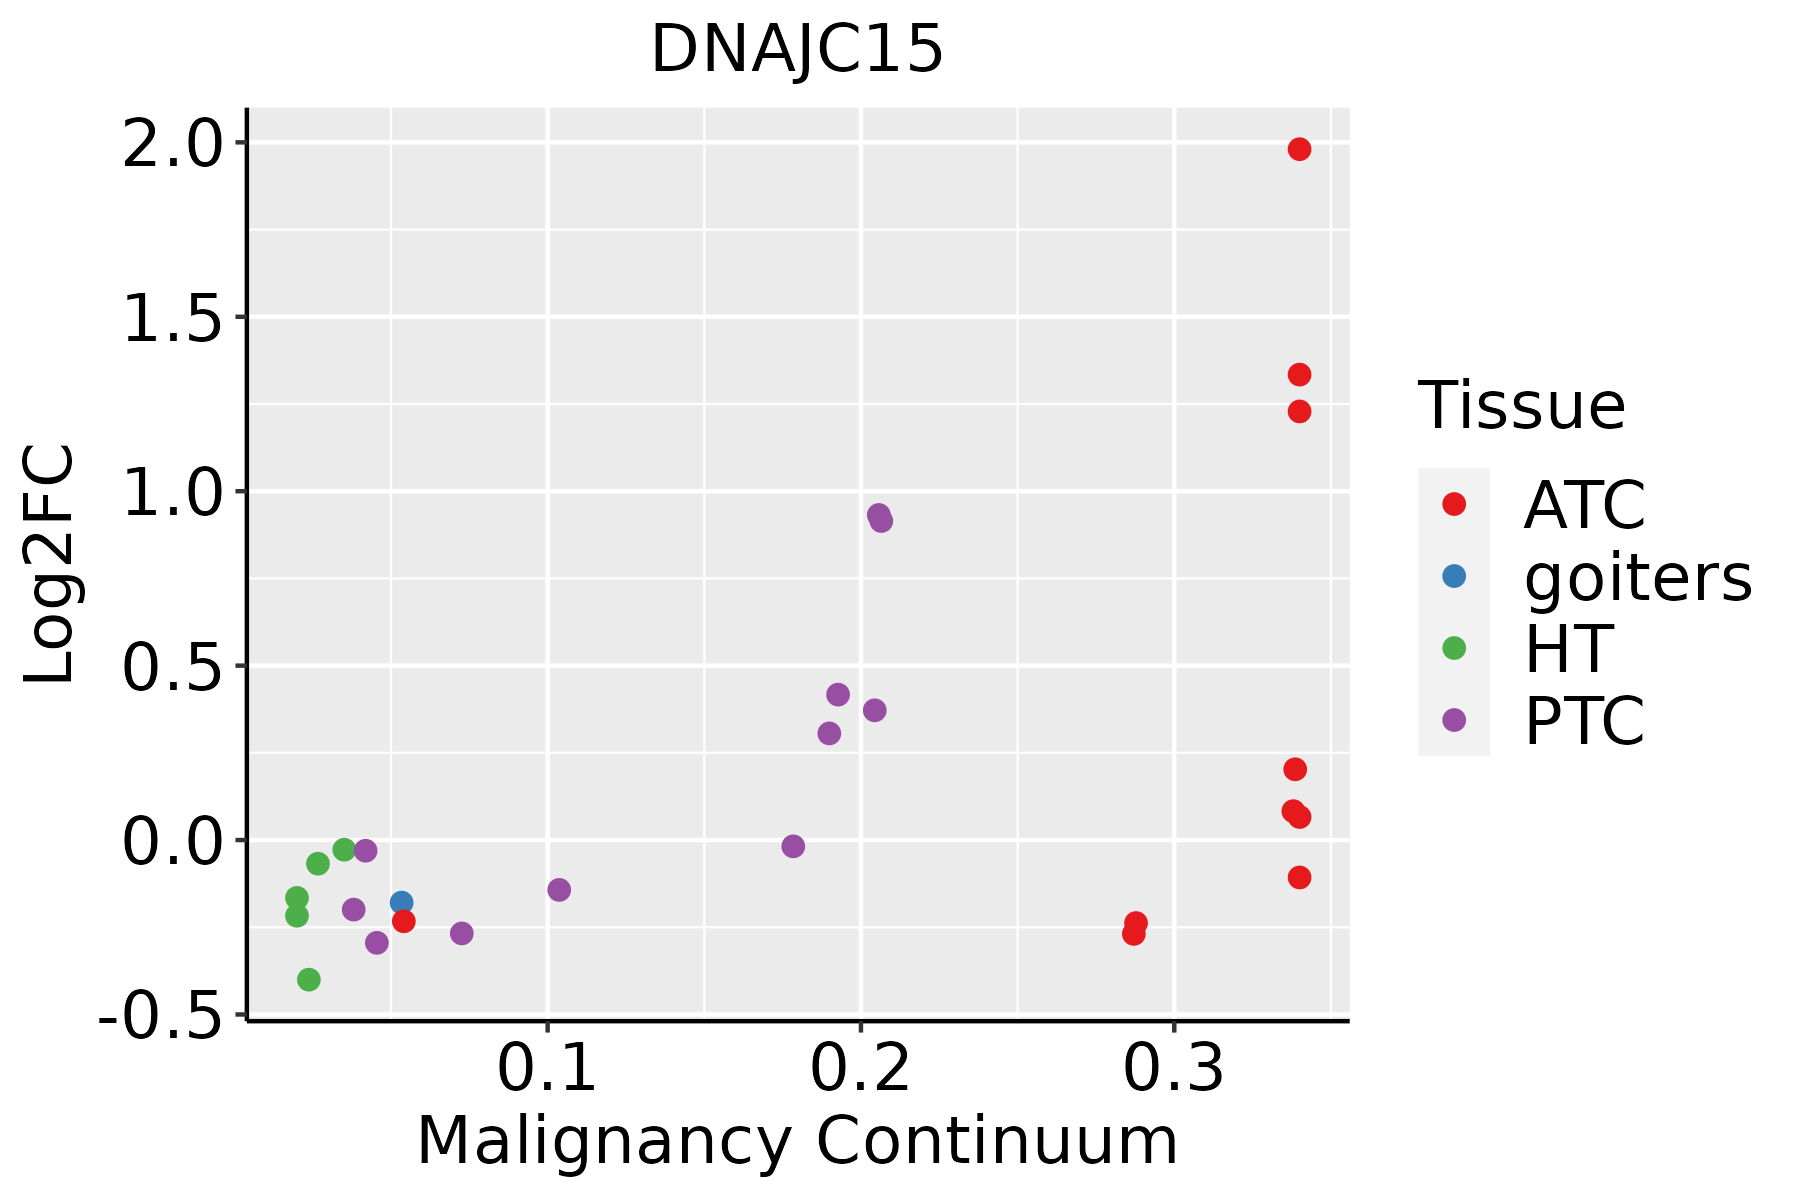 | ATC: Anaplastic thyroid cancer |
| HT: Hashimoto's thyroiditis |
| PTC: Papillary thyroid cancer |
| GO ID | Tissue | Disease Stage | Description | Gene Ratio | Bg Ratio | pvalue | p.adjust | Count |
| GO:004603410 | Cervix | CC | ATP metabolic process | 90/2311 | 277/18723 | 7.90e-19 | 2.36e-15 | 90 |
| GO:000611910 | Cervix | CC | oxidative phosphorylation | 55/2311 | 141/18723 | 7.12e-16 | 1.42e-12 | 55 |
| GO:00090609 | Cervix | CC | aerobic respiration | 60/2311 | 189/18723 | 1.59e-12 | 6.36e-10 | 60 |
| GO:00427739 | Cervix | CC | ATP synthesis coupled electron transport | 38/2311 | 95/18723 | 8.45e-12 | 2.66e-09 | 38 |
| GO:00427759 | Cervix | CC | mitochondrial ATP synthesis coupled electron transport | 38/2311 | 95/18723 | 8.45e-12 | 2.66e-09 | 38 |
| GO:00196469 | Cervix | CC | aerobic electron transport chain | 36/2311 | 87/18723 | 9.15e-12 | 2.74e-09 | 36 |
| GO:00229049 | Cervix | CC | respiratory electron transport chain | 42/2311 | 114/18723 | 1.67e-11 | 4.77e-09 | 42 |
| GO:00453339 | Cervix | CC | cellular respiration | 66/2311 | 230/18723 | 2.07e-11 | 5.39e-09 | 66 |
| GO:00725949 | Cervix | CC | establishment of protein localization to organelle | 99/2311 | 422/18723 | 1.23e-10 | 2.11e-08 | 99 |
| GO:00229009 | Cervix | CC | electron transport chain | 53/2311 | 175/18723 | 2.23e-10 | 3.43e-08 | 53 |
| GO:007149610 | Cervix | CC | cellular response to external stimulus | 78/2311 | 320/18723 | 1.82e-09 | 1.98e-07 | 78 |
| GO:004325410 | Cervix | CC | regulation of protein-containing complex assembly | 96/2311 | 428/18723 | 2.91e-09 | 3.05e-07 | 96 |
| GO:00060919 | Cervix | CC | generation of precursor metabolites and energy | 105/2311 | 490/18723 | 7.40e-09 | 6.61e-07 | 105 |
| GO:00159809 | Cervix | CC | energy derivation by oxidation of organic compounds | 74/2311 | 318/18723 | 3.83e-08 | 2.53e-06 | 74 |
| GO:00061209 | Cervix | CC | mitochondrial electron transport, NADH to ubiquinone | 22/2311 | 51/18723 | 4.01e-08 | 2.54e-06 | 22 |
| GO:00316689 | Cervix | CC | cellular response to extracellular stimulus | 59/2311 | 246/18723 | 3.03e-07 | 1.24e-05 | 59 |
| GO:00068399 | Cervix | CC | mitochondrial transport | 60/2311 | 254/18723 | 4.21e-07 | 1.67e-05 | 60 |
| GO:000660510 | Cervix | CC | protein targeting | 68/2311 | 314/18723 | 2.17e-06 | 6.55e-05 | 68 |
| GO:003166710 | Cervix | CC | response to nutrient levels | 92/2311 | 474/18723 | 5.80e-06 | 1.42e-04 | 92 |
| GO:00170388 | Cervix | CC | protein import | 48/2311 | 206/18723 | 8.62e-06 | 1.98e-04 | 48 |
| Hugo Symbol | Variant Class | Variant Classification | dbSNP RS | HGVSc | HGVSp | HGVSp Short | SWISSPROT | BIOTYPE | SIFT | PolyPhen | Tumor Sample Barcode | Tissue | Histology | Sex | Age | Stage | Therapy Types | Drugs | Outcome |
| DNAJC15 | SNV | Missense_Mutation | novel | c.22G>T | p.Ala8Ser | p.A8S | Q9Y5T4 | protein_coding | tolerated_low_confidence(0.24) | benign(0.049) | TCGA-BH-A0HK-01 | Breast | breast invasive carcinoma | Female | >=65 | I/II | Hormone Therapy | arimidex | SD |
| DNAJC15 | SNV | Missense_Mutation | rs756868611 | c.68C>T | p.Ser23Leu | p.S23L | Q9Y5T4 | protein_coding | deleterious_low_confidence(0.03) | benign(0.017) | TCGA-EK-A2PG-01 | Cervix | cervical & endocervical cancer | Female | >=65 | I/II | Unknown | Unknown | SD |
| DNAJC15 | SNV | Missense_Mutation | | c.43C>T | p.Arg15Cys | p.R15C | Q9Y5T4 | protein_coding | deleterious_low_confidence(0.04) | probably_damaging(0.997) | TCGA-AD-6895-01 | Colorectum | colon adenocarcinoma | Male | >=65 | III/IV | Unknown | Unknown | SD |
| DNAJC15 | SNV | Missense_Mutation | novel | c.269N>C | p.Gln90Pro | p.Q90P | Q9Y5T4 | protein_coding | tolerated(0.69) | benign(0.011) | TCGA-A5-A0G2-01 | Endometrium | uterine corpus endometrioid carcinoma | Female | <65 | III/IV | Unknown | Unknown | SD |
| DNAJC15 | SNV | Missense_Mutation | novel | c.215N>T | p.Ala72Val | p.A72V | Q9Y5T4 | protein_coding | tolerated(0.56) | benign(0.003) | TCGA-AX-A3G8-01 | Endometrium | uterine corpus endometrioid carcinoma | Female | >=65 | I/II | Unknown | Unknown | SD |
| DNAJC15 | SNV | Missense_Mutation | rs115803506 | c.284N>A | p.Arg95Gln | p.R95Q | Q9Y5T4 | protein_coding | tolerated(0.09) | probably_damaging(0.98) | TCGA-B5-A0JY-01 | Endometrium | uterine corpus endometrioid carcinoma | Female | <65 | III/IV | Chemotherapy | doxorubicin | SD |
| DNAJC15 | SNV | Missense_Mutation | | c.450T>G | p.His150Gln | p.H150Q | Q9Y5T4 | protein_coding | tolerated_low_confidence(0.19) | benign(0.007) | TCGA-BS-A0TC-01 | Endometrium | uterine corpus endometrioid carcinoma | Female | >=65 | I/II | Unknown | Unknown | SD |
| DNAJC15 | SNV | Missense_Mutation | | c.369N>G | p.Asn123Lys | p.N123K | Q9Y5T4 | protein_coding | deleterious(0) | probably_damaging(0.951) | TCGA-BS-A0UM-01 | Endometrium | uterine corpus endometrioid carcinoma | Female | <65 | I/II | Chemotherapy | adriamycin | SD |
| DNAJC15 | SNV | Missense_Mutation | rs765899911 | c.163N>T | p.Arg55Cys | p.R55C | Q9Y5T4 | protein_coding | deleterious(0.01) | probably_damaging(0.996) | TCGA-D1-A175-01 | Endometrium | uterine corpus endometrioid carcinoma | Female | <65 | I/II | Chemotherapy | paclitaxel | SD |
| DNAJC15 | SNV | Missense_Mutation | rs760852761 | c.407N>G | p.Lys136Arg | p.K136R | Q9Y5T4 | protein_coding | deleterious(0.03) | probably_damaging(0.98) | TCGA-D1-A175-01 | Endometrium | uterine corpus endometrioid carcinoma | Female | <65 | I/II | Chemotherapy | paclitaxel | SD |


