
|
|||||
|
 | |
| |
| |
| |
| |
| |
|
Gene: DNAJC14 |
Gene summary for DNAJC14 |
| Gene information | Species | Human | Gene symbol | DNAJC14 | Gene ID | 85406 |
| Gene name | DnaJ heat shock protein family (Hsp40) member C14 | |
| Gene Alias | DNAJ | |
| Cytomap | 12q13.2 | |
| Gene Type | protein-coding | GO ID | GO:0006810 | UniProtAcc | A0A024RB64 |
Top |
Malignant transformation analysis |
| Identification of the aberrant gene expression in precancerous and cancerous lesions by comparing the gene expression of stem-like cells in diseased tissues with normal stem cells |
| Entrez ID | Symbol | Replicates | Species | Organ | Tissue | Adj P-value | Log2FC | Malignancy |
| 85406 | DNAJC14 | LZE7T | Human | Esophagus | ESCC | 2.04e-02 | 2.20e-01 | 0.0667 |
| 85406 | DNAJC14 | LZE24T | Human | Esophagus | ESCC | 1.60e-11 | 2.61e-01 | 0.0596 |
| 85406 | DNAJC14 | P1T-E | Human | Esophagus | ESCC | 8.51e-03 | 1.73e-01 | 0.0875 |
| 85406 | DNAJC14 | P2T-E | Human | Esophagus | ESCC | 2.39e-24 | 3.33e-01 | 0.1177 |
| 85406 | DNAJC14 | P4T-E | Human | Esophagus | ESCC | 1.15e-05 | 1.92e-01 | 0.1323 |
| 85406 | DNAJC14 | P5T-E | Human | Esophagus | ESCC | 4.44e-10 | 2.26e-01 | 0.1327 |
| 85406 | DNAJC14 | P8T-E | Human | Esophagus | ESCC | 2.62e-08 | 1.72e-01 | 0.0889 |
| 85406 | DNAJC14 | P10T-E | Human | Esophagus | ESCC | 3.11e-07 | 1.31e-01 | 0.116 |
| 85406 | DNAJC14 | P11T-E | Human | Esophagus | ESCC | 1.94e-05 | 2.55e-01 | 0.1426 |
| 85406 | DNAJC14 | P12T-E | Human | Esophagus | ESCC | 3.14e-10 | 2.20e-01 | 0.1122 |
| 85406 | DNAJC14 | P15T-E | Human | Esophagus | ESCC | 7.38e-09 | 1.81e-01 | 0.1149 |
| 85406 | DNAJC14 | P16T-E | Human | Esophagus | ESCC | 1.10e-11 | 2.84e-01 | 0.1153 |
| 85406 | DNAJC14 | P17T-E | Human | Esophagus | ESCC | 2.89e-02 | 1.46e-01 | 0.1278 |
| 85406 | DNAJC14 | P20T-E | Human | Esophagus | ESCC | 7.43e-13 | 2.91e-01 | 0.1124 |
| 85406 | DNAJC14 | P21T-E | Human | Esophagus | ESCC | 3.05e-18 | 2.01e-01 | 0.1617 |
| 85406 | DNAJC14 | P22T-E | Human | Esophagus | ESCC | 2.66e-04 | 9.12e-02 | 0.1236 |
| 85406 | DNAJC14 | P23T-E | Human | Esophagus | ESCC | 1.60e-06 | 1.60e-01 | 0.108 |
| 85406 | DNAJC14 | P24T-E | Human | Esophagus | ESCC | 1.39e-04 | 1.52e-01 | 0.1287 |
| 85406 | DNAJC14 | P26T-E | Human | Esophagus | ESCC | 1.01e-12 | 2.66e-01 | 0.1276 |
| 85406 | DNAJC14 | P27T-E | Human | Esophagus | ESCC | 7.40e-10 | 2.03e-01 | 0.1055 |
| Page: 1 2 3 4 |
| Tissue | Expression Dynamics | Abbreviation |
| Esophagus | 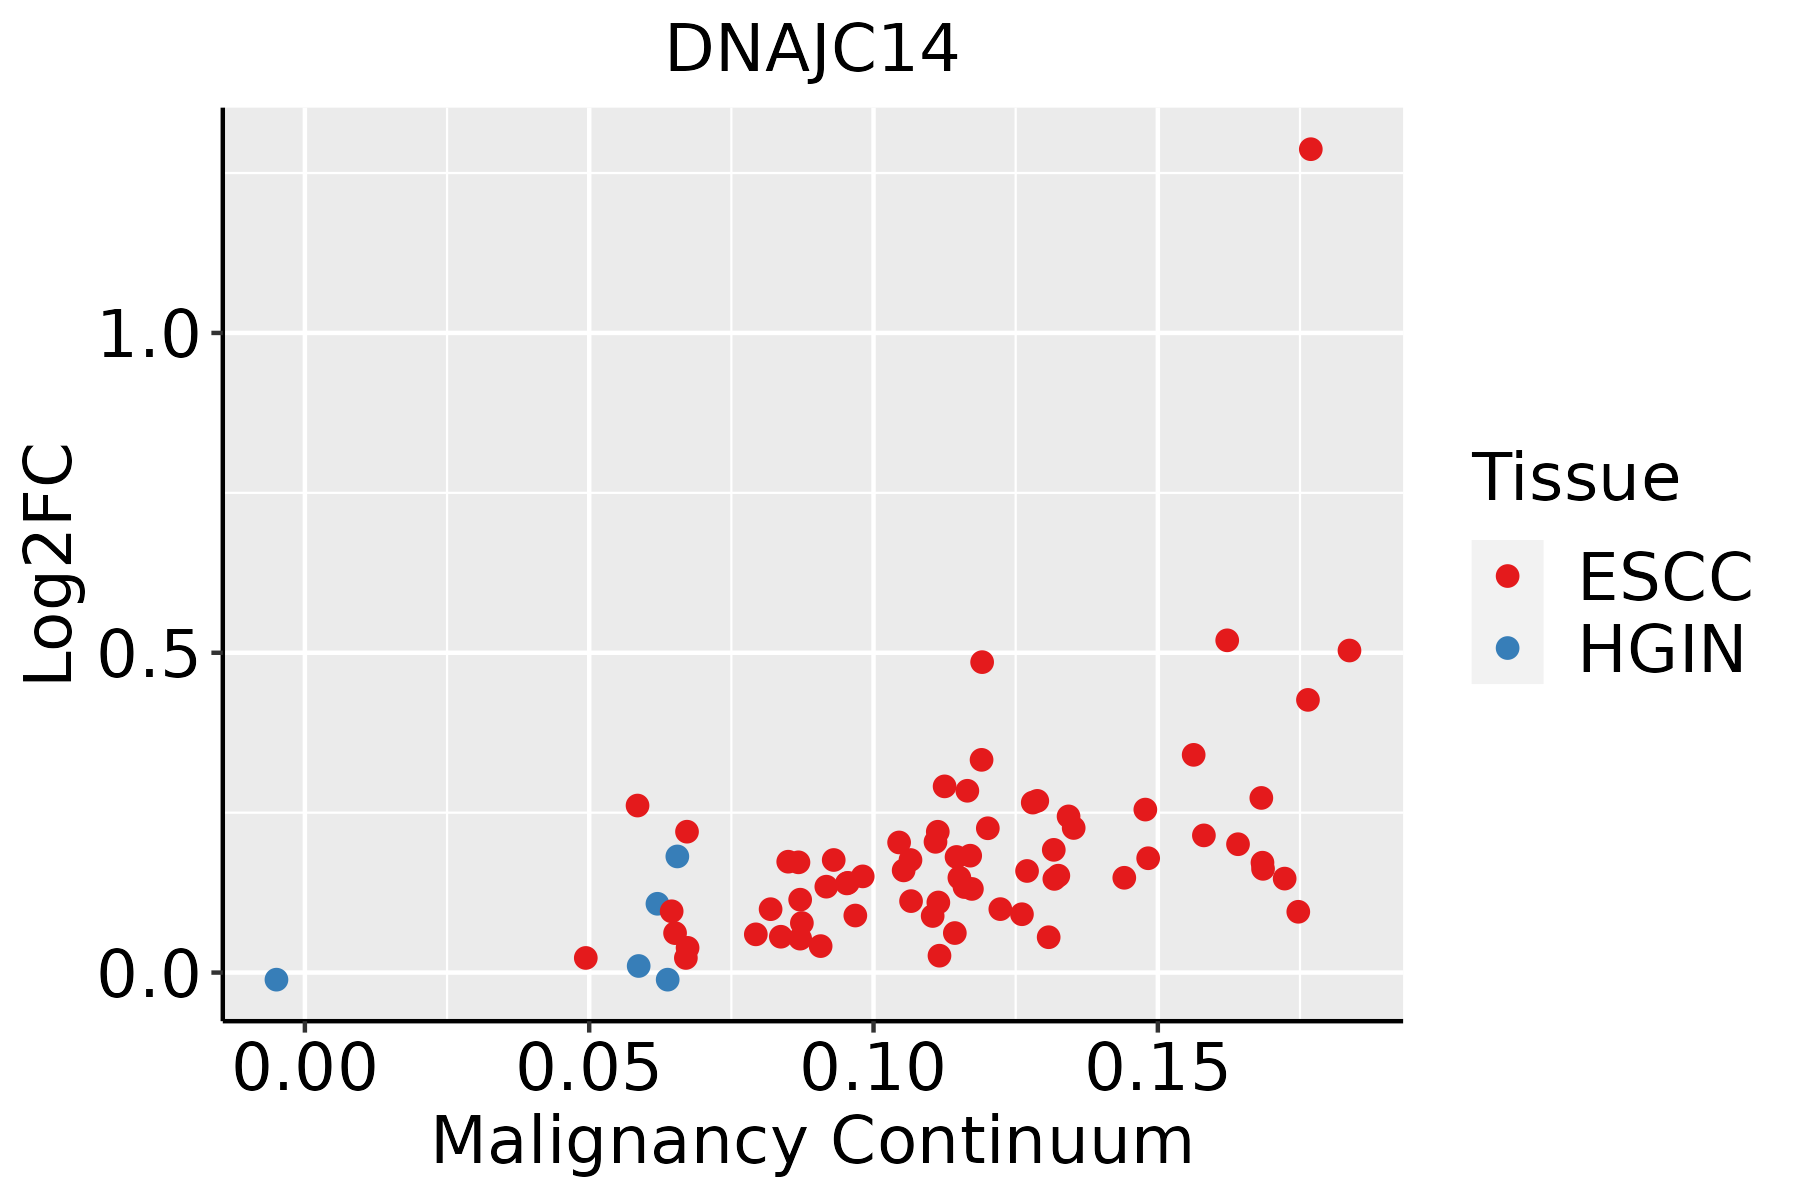 | ESCC: Esophageal squamous cell carcinoma |
| HGIN: High-grade intraepithelial neoplasias | ||
| LGIN: Low-grade intraepithelial neoplasias | ||
| Liver | 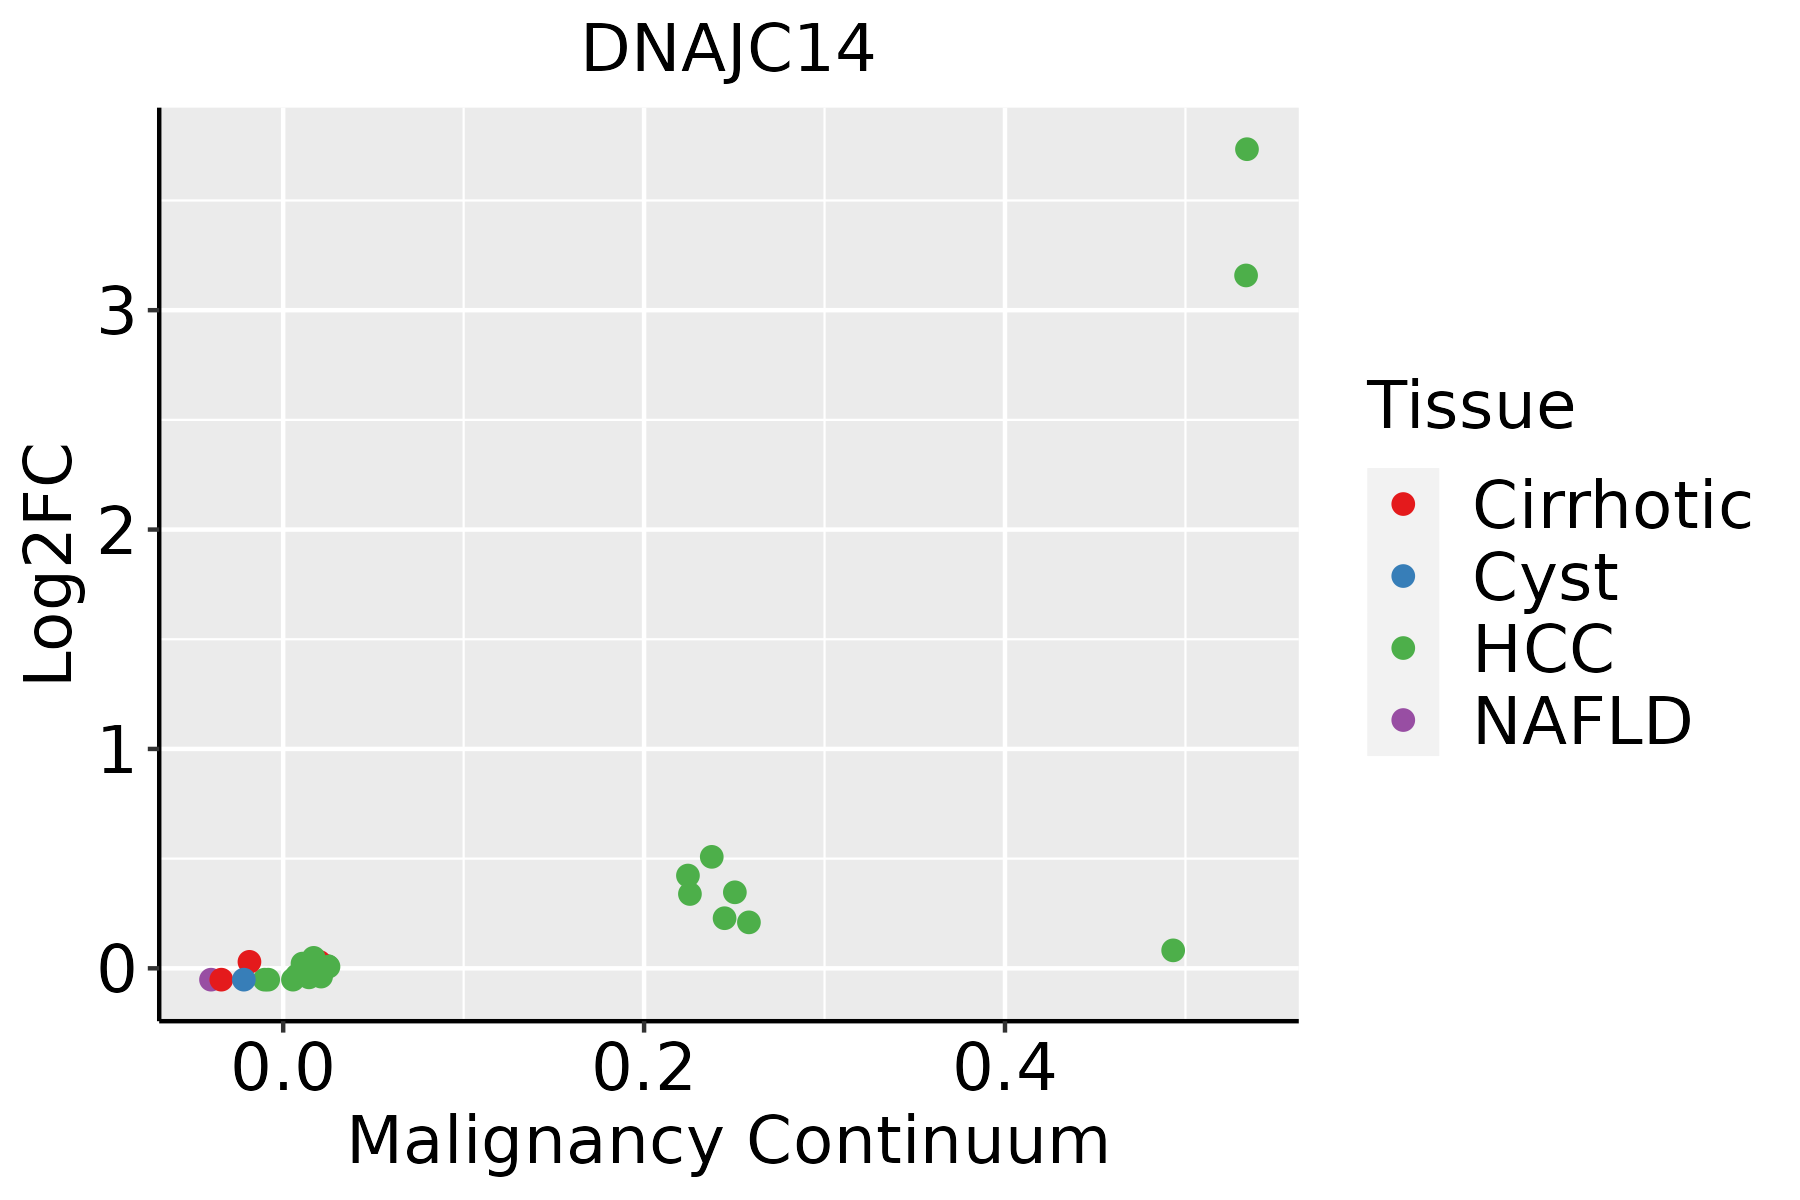 | HCC: Hepatocellular carcinoma |
| NAFLD: Non-alcoholic fatty liver disease |
| ∗log2FC in expression of this searched gene in stem-like cells from each diseased tissue sample relative to stem-like cells in normal samples in each tissue plotted against the malignancy continuum. Samples are colored based on if they are from different disease stage. |
Top |
Malignant transformation related pathway analysis |
| Find out the enriched GO biological processes and KEGG pathways involved in transition from healthy to precancer to cancer |
| Tissue | Disease Stage | Enriched GO biological Processes |
| Colorectum | AD |  |
| Colorectum | SER |  |
| Colorectum | MSS |  |
| Colorectum | MSI-H |  |
| Colorectum | FAP |  |
| ∗Top 15 enriched GO BP terms are showed in the bar plot of each disease state in each tissue. Each row represents a significant GO biological process which is colored according to the -log10(p.adjust). |
| Page: 1 2 3 4 5 6 7 8 9 |
| GO ID | Tissue | Disease Stage | Description | Gene Ratio | Bg Ratio | pvalue | p.adjust | Count |
| Page: 1 |
| Pathway ID | Tissue | Disease Stage | Description | Gene Ratio | Bg Ratio | pvalue | p.adjust | qvalue | Count |
| Page: 1 |
Top |
Cell-cell communication analysis |
| Identification of potential cell-cell interactions between two cell types and their ligand-receptor pairs for different disease states |
| Ligand | Receptor | LRpair | Pathway | Tissue | Disease Stage |
| Page: 1 |
Top |
Single-cell gene regulatory network inference analysis |
| Find out the significant the regulons (TFs) and the target genes of each regulon across cell types for different disease states |
| TF | Cell Type | Tissue | Disease Stage | Target Gene | RSS | Regulon Activity |
| ∗The dot plots of a searched regulon are shown for all cell subpopulations in each disease state of each tissue based on the regulon specific score inferred using pySCENIC and by calculating the average expression. |
| Page: 1 |
Top |
Somatic mutation of malignant transformation related genes |
| Annotation of somatic variants for genes involved in malignant transformation |
| Hugo Symbol | Variant Class | Variant Classification | dbSNP RS | HGVSc | HGVSp | HGVSp Short | SWISSPROT | BIOTYPE | SIFT | PolyPhen | Tumor Sample Barcode | Tissue | Histology | Sex | Age | Stage | Therapy Types | Drugs | Outcome |
| DNAJC14 | SNV | Missense_Mutation | novel | c.2030N>G | p.Ser677Cys | p.S677C | Q6Y2X3 | protein_coding | deleterious(0.01) | benign(0.371) | TCGA-3C-AALI-01 | Breast | breast invasive carcinoma | Female | <65 | I/II | Unspecific | Poly E | Complete Response |
| DNAJC14 | SNV | Missense_Mutation | novel | c.623N>T | p.Arg208Leu | p.R208L | Q6Y2X3 | protein_coding | deleterious_low_confidence(0.01) | benign(0.195) | TCGA-A2-A0CR-01 | Breast | breast invasive carcinoma | Female | <65 | I/II | Chemotherapy | adriamycin | CR |
| DNAJC14 | SNV | Missense_Mutation | c.262N>A | p.Glu88Lys | p.E88K | Q6Y2X3 | protein_coding | deleterious_low_confidence(0.02) | benign(0.003) | TCGA-AC-A23H-01 | Breast | breast invasive carcinoma | Female | >=65 | I/II | Unknown | Unknown | PD | |
| DNAJC14 | SNV | Missense_Mutation | c.446N>T | p.Ser149Phe | p.S149F | Q6Y2X3 | protein_coding | deleterious_low_confidence(0) | benign(0.332) | TCGA-BH-A0B0-01 | Breast | breast invasive carcinoma | Female | <65 | I/II | Chemotherapy | adriamycin | CR | |
| DNAJC14 | SNV | Missense_Mutation | novel | c.1310N>G | p.Val437Gly | p.V437G | Q6Y2X3 | protein_coding | deleterious(0) | possibly_damaging(0.767) | TCGA-E9-A243-01 | Breast | breast invasive carcinoma | Female | <65 | I/II | Chemotherapy | 5-fluorouracil | PD |
| DNAJC14 | SNV | Missense_Mutation | c.1510N>A | p.Glu504Lys | p.E504K | Q6Y2X3 | protein_coding | deleterious(0) | probably_damaging(0.975) | TCGA-GM-A2DI-01 | Breast | breast invasive carcinoma | Female | <65 | I/II | Chemotherapy | taxotere | CR | |
| DNAJC14 | insertion | Frame_Shift_Ins | novel | c.1923_1924insATAAATGTATT | p.Asp642IlefsTer10 | p.D642Ifs*10 | Q6Y2X3 | protein_coding | TCGA-A8-A08O-01 | Breast | breast invasive carcinoma | Female | <65 | III/IV | Chemotherapy | docetaxel | PD | ||
| DNAJC14 | deletion | Frame_Shift_Del | c.118_119delAG | p.Arg40GlyfsTer8 | p.R40Gfs*8 | Q6Y2X3 | protein_coding | TCGA-AC-A23C-01 | Breast | breast invasive carcinoma | Female | <65 | I/II | Chemotherapy | chemo | CR | |||
| DNAJC14 | insertion | In_Frame_Ins | novel | c.564_565insAAATATGGACCTAGTATGGGAGGGTCAGGGAGTGCATGTAAGGAT | p.Ser188_Gly189insLysTyrGlyProSerMetGlyGlySerGlySerAlaCysLysAsp | p.S188_G189insKYGPSMGGSGSACKD | Q6Y2X3 | protein_coding | TCGA-BH-A0AY-01 | Breast | breast invasive carcinoma | Female | <65 | I/II | Chemotherapy | SD | |||
| DNAJC14 | SNV | Missense_Mutation | c.53N>T | p.Gly18Val | p.G18V | Q6Y2X3 | protein_coding | deleterious_low_confidence(0) | benign(0.172) | TCGA-C5-A1MF-01 | Cervix | cervical & endocervical cancer | Female | <65 | I/II | Unknown | Unknown | SD |
| Page: 1 2 3 4 5 6 7 8 |
Top |
Related drugs of malignant transformation related genes |
| Identification of chemicals and drugs interact with genes involved in malignant transfromation |
| (DGIdb 4.0) |
| Entrez ID | Symbol | Category | Interaction Types | Drug Claim Name | Drug Name | PMIDs |
| Page: 1 |

Copyright 2023-Present -The University of Texas Health Science Center at Houston |