
|
|||||
|
 | |
| |
| |
| |
| |
| |
|
Gene: DNAJC11 |
Gene summary for DNAJC11 |
| Gene information | Species | Human | Gene symbol | DNAJC11 | Gene ID | 55735 |
| Gene name | DnaJ heat shock protein family (Hsp40) member C11 | |
| Gene Alias | dJ126A5.1 | |
| Cytomap | 1p36.31 | |
| Gene Type | protein-coding | GO ID | GO:0006996 | UniProtAcc | Q9NVH1 |
Top |
Malignant transformation analysis |
| Identification of the aberrant gene expression in precancerous and cancerous lesions by comparing the gene expression of stem-like cells in diseased tissues with normal stem cells |
| Entrez ID | Symbol | Replicates | Species | Organ | Tissue | Adj P-value | Log2FC | Malignancy |
| 55735 | DNAJC11 | LZE4T | Human | Esophagus | ESCC | 1.33e-06 | 1.85e-01 | 0.0811 |
| 55735 | DNAJC11 | LZE5T | Human | Esophagus | ESCC | 1.58e-03 | 2.52e-01 | 0.0514 |
| 55735 | DNAJC11 | LZE7T | Human | Esophagus | ESCC | 4.75e-05 | 3.56e-01 | 0.0667 |
| 55735 | DNAJC11 | LZE8T | Human | Esophagus | ESCC | 5.03e-07 | 1.62e-01 | 0.067 |
| 55735 | DNAJC11 | LZE20T | Human | Esophagus | ESCC | 3.58e-06 | 1.70e-01 | 0.0662 |
| 55735 | DNAJC11 | LZE22T | Human | Esophagus | ESCC | 6.40e-03 | 3.35e-01 | 0.068 |
| 55735 | DNAJC11 | LZE24T | Human | Esophagus | ESCC | 1.26e-12 | 2.64e-01 | 0.0596 |
| 55735 | DNAJC11 | LZE6T | Human | Esophagus | ESCC | 2.80e-03 | 2.08e-01 | 0.0845 |
| 55735 | DNAJC11 | P1T-E | Human | Esophagus | ESCC | 5.93e-04 | 2.68e-01 | 0.0875 |
| 55735 | DNAJC11 | P2T-E | Human | Esophagus | ESCC | 8.20e-19 | 3.15e-01 | 0.1177 |
| 55735 | DNAJC11 | P4T-E | Human | Esophagus | ESCC | 3.44e-22 | 4.21e-01 | 0.1323 |
| 55735 | DNAJC11 | P5T-E | Human | Esophagus | ESCC | 7.55e-15 | 2.28e-01 | 0.1327 |
| 55735 | DNAJC11 | P8T-E | Human | Esophagus | ESCC | 3.39e-13 | 2.31e-01 | 0.0889 |
| 55735 | DNAJC11 | P9T-E | Human | Esophagus | ESCC | 2.40e-05 | 1.61e-01 | 0.1131 |
| 55735 | DNAJC11 | P10T-E | Human | Esophagus | ESCC | 3.24e-24 | 3.82e-01 | 0.116 |
| 55735 | DNAJC11 | P11T-E | Human | Esophagus | ESCC | 9.31e-15 | 3.87e-01 | 0.1426 |
| 55735 | DNAJC11 | P12T-E | Human | Esophagus | ESCC | 4.88e-15 | 2.44e-01 | 0.1122 |
| 55735 | DNAJC11 | P15T-E | Human | Esophagus | ESCC | 1.66e-20 | 4.11e-01 | 0.1149 |
| 55735 | DNAJC11 | P16T-E | Human | Esophagus | ESCC | 8.69e-11 | 2.32e-01 | 0.1153 |
| 55735 | DNAJC11 | P17T-E | Human | Esophagus | ESCC | 1.77e-08 | 3.45e-01 | 0.1278 |
| Page: 1 2 3 4 5 |
| Tissue | Expression Dynamics | Abbreviation |
| Esophagus |  | ESCC: Esophageal squamous cell carcinoma |
| HGIN: High-grade intraepithelial neoplasias | ||
| LGIN: Low-grade intraepithelial neoplasias | ||
| Liver |  | HCC: Hepatocellular carcinoma |
| NAFLD: Non-alcoholic fatty liver disease | ||
| Oral Cavity | 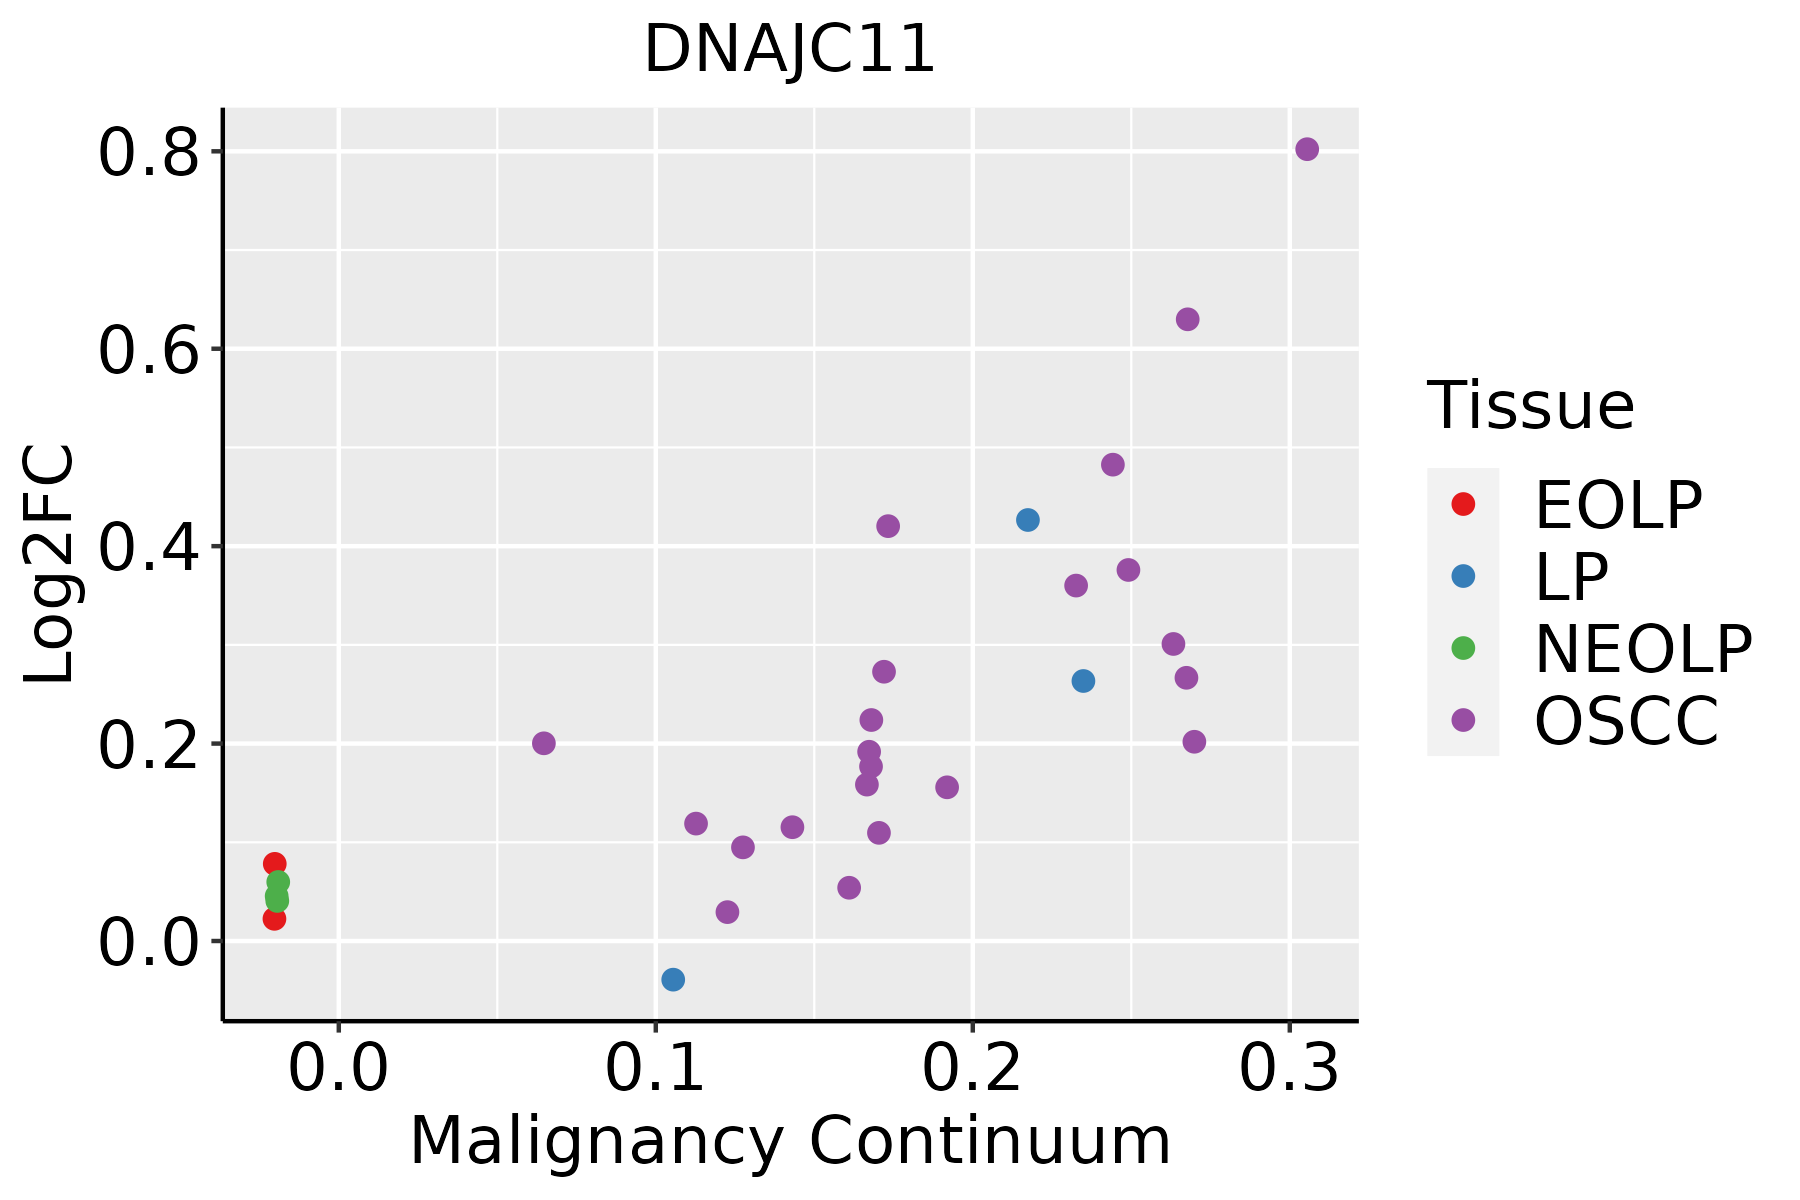 | EOLP: Erosive Oral lichen planus |
| LP: leukoplakia | ||
| NEOLP: Non-erosive oral lichen planus | ||
| OSCC: Oral squamous cell carcinoma | ||
| Skin | 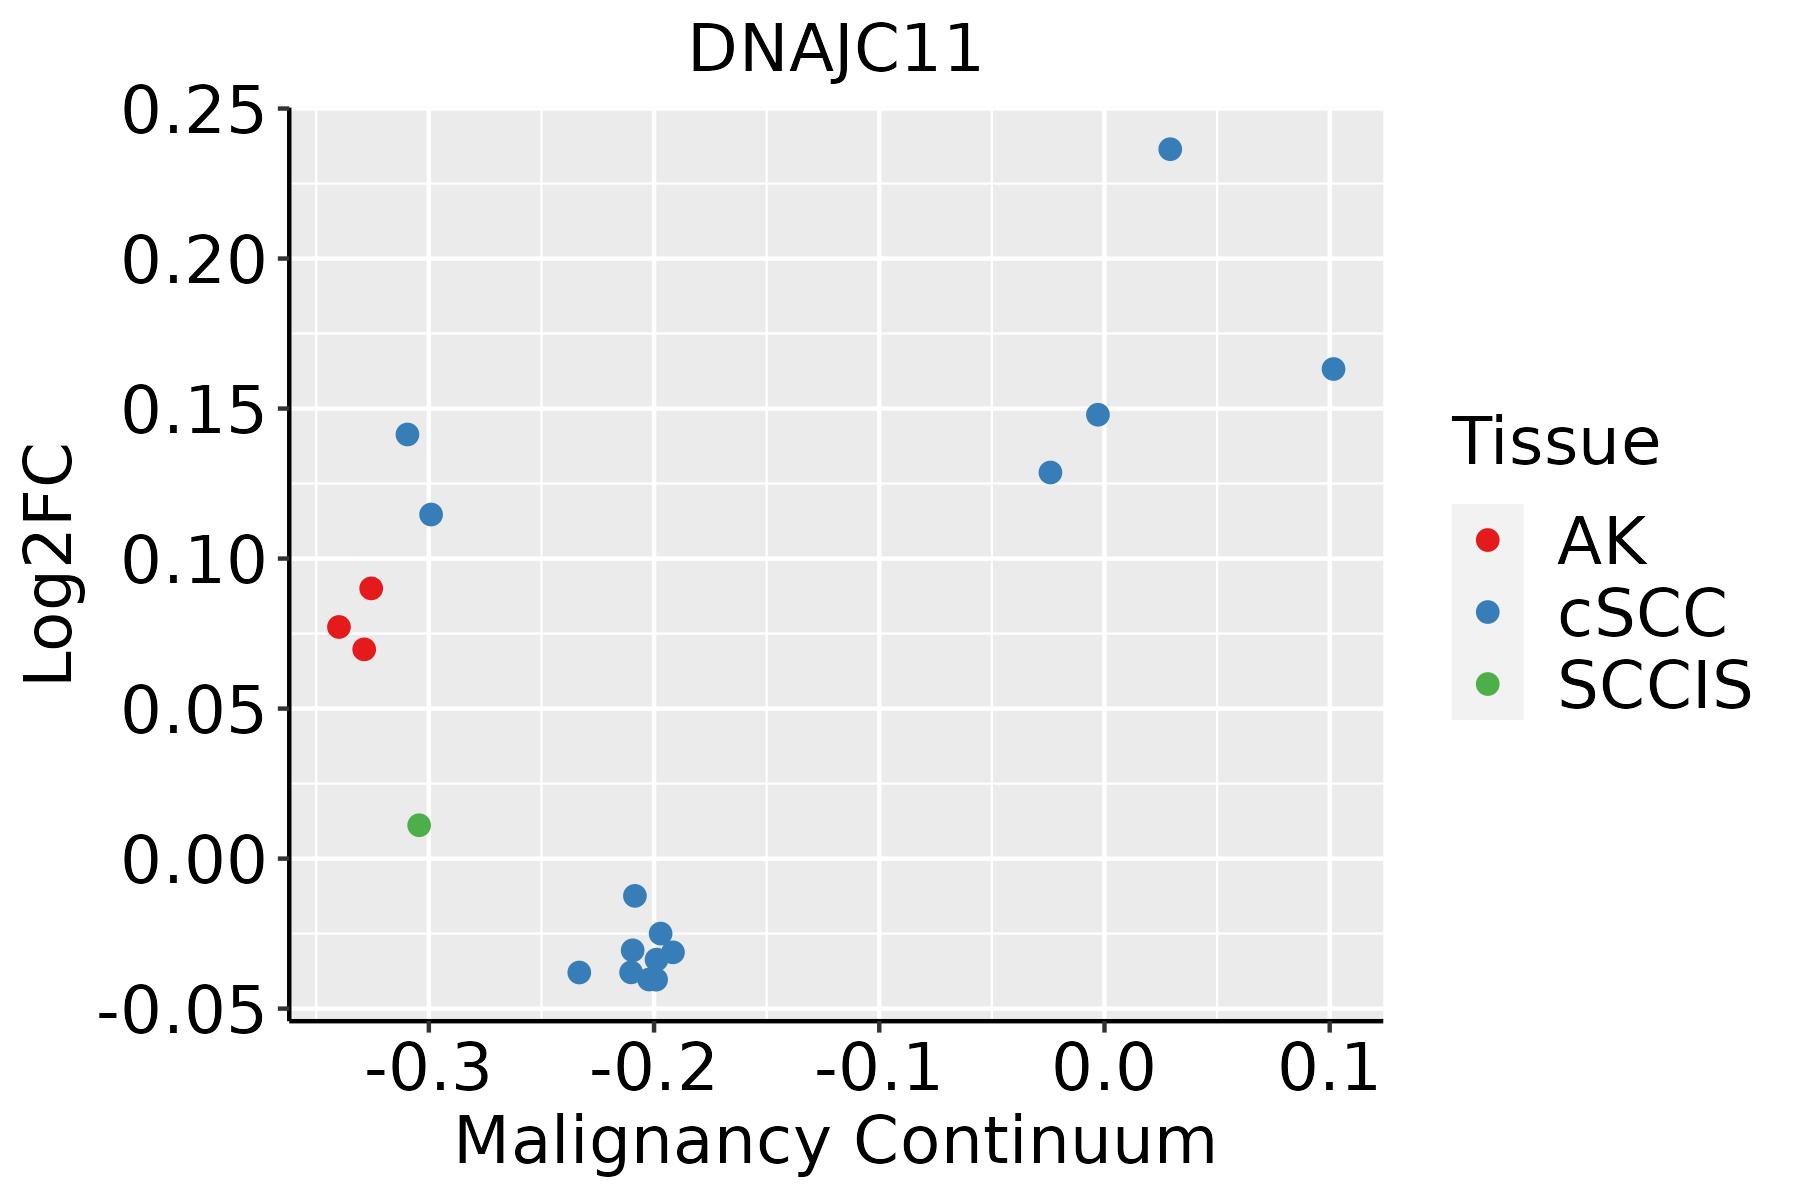 | AK: Actinic keratosis |
| cSCC: Cutaneous squamous cell carcinoma | ||
| SCCIS:squamous cell carcinoma in situ |
| ∗log2FC in expression of this searched gene in stem-like cells from each diseased tissue sample relative to stem-like cells in normal samples in each tissue plotted against the malignancy continuum. Samples are colored based on if they are from different disease stage. |
Top |
Malignant transformation related pathway analysis |
| Find out the enriched GO biological processes and KEGG pathways involved in transition from healthy to precancer to cancer |
| Tissue | Disease Stage | Enriched GO biological Processes |
| Colorectum | AD |  |
| Colorectum | SER |  |
| Colorectum | MSS |  |
| Colorectum | MSI-H |  |
| Colorectum | FAP |  |
| ∗Top 15 enriched GO BP terms are showed in the bar plot of each disease state in each tissue. Each row represents a significant GO biological process which is colored according to the -log10(p.adjust). |
| Page: 1 2 3 4 5 6 7 8 9 |
| GO ID | Tissue | Disease Stage | Description | Gene Ratio | Bg Ratio | pvalue | p.adjust | Count |
| GO:000700619 | Esophagus | ESCC | mitochondrial membrane organization | 93/8552 | 116/18723 | 2.16e-14 | 1.11e-12 | 93 |
| GO:000700713 | Esophagus | ESCC | inner mitochondrial membrane organization | 31/8552 | 38/18723 | 5.93e-06 | 6.10e-05 | 31 |
| GO:00424072 | Esophagus | ESCC | cristae formation | 13/8552 | 16/18723 | 4.05e-03 | 1.62e-02 | 13 |
| GO:00070065 | Liver | Cirrhotic | mitochondrial membrane organization | 57/4634 | 116/18723 | 1.13e-08 | 4.29e-07 | 57 |
| GO:00070073 | Liver | Cirrhotic | inner mitochondrial membrane organization | 19/4634 | 38/18723 | 6.75e-04 | 5.06e-03 | 19 |
| GO:000700612 | Liver | HCC | mitochondrial membrane organization | 80/7958 | 116/18723 | 7.09e-09 | 1.81e-07 | 80 |
| GO:000700711 | Liver | HCC | inner mitochondrial membrane organization | 28/7958 | 38/18723 | 9.60e-05 | 8.34e-04 | 28 |
| GO:0042407 | Liver | HCC | cristae formation | 12/7958 | 16/18723 | 8.74e-03 | 3.40e-02 | 12 |
| GO:000700610 | Oral cavity | OSCC | mitochondrial membrane organization | 85/7305 | 116/18723 | 6.29e-14 | 3.40e-12 | 85 |
| GO:00070075 | Oral cavity | OSCC | inner mitochondrial membrane organization | 27/7305 | 38/18723 | 6.23e-05 | 5.08e-04 | 27 |
| GO:00424071 | Oral cavity | OSCC | cristae formation | 12/7305 | 16/18723 | 3.83e-03 | 1.57e-02 | 12 |
| GO:0007006110 | Skin | cSCC | mitochondrial membrane organization | 64/4864 | 116/18723 | 2.16e-11 | 1.08e-09 | 64 |
| GO:00070077 | Skin | cSCC | inner mitochondrial membrane organization | 24/4864 | 38/18723 | 1.54e-06 | 2.62e-05 | 24 |
| GO:00424073 | Skin | cSCC | cristae formation | 9/4864 | 16/18723 | 9.73e-03 | 4.31e-02 | 9 |
| Page: 1 |
| Pathway ID | Tissue | Disease Stage | Description | Gene Ratio | Bg Ratio | pvalue | p.adjust | qvalue | Count |
| Page: 1 |
Top |
Cell-cell communication analysis |
| Identification of potential cell-cell interactions between two cell types and their ligand-receptor pairs for different disease states |
| Ligand | Receptor | LRpair | Pathway | Tissue | Disease Stage |
| Page: 1 |
Top |
Single-cell gene regulatory network inference analysis |
| Find out the significant the regulons (TFs) and the target genes of each regulon across cell types for different disease states |
| TF | Cell Type | Tissue | Disease Stage | Target Gene | RSS | Regulon Activity |
| ∗The dot plots of a searched regulon are shown for all cell subpopulations in each disease state of each tissue based on the regulon specific score inferred using pySCENIC and by calculating the average expression. |
| Page: 1 |
Top |
Somatic mutation of malignant transformation related genes |
| Annotation of somatic variants for genes involved in malignant transformation |
| Hugo Symbol | Variant Class | Variant Classification | dbSNP RS | HGVSc | HGVSp | HGVSp Short | SWISSPROT | BIOTYPE | SIFT | PolyPhen | Tumor Sample Barcode | Tissue | Histology | Sex | Age | Stage | Therapy Types | Drugs | Outcome |
| DNAJC11 | SNV | Missense_Mutation | c.333G>C | p.Gln111His | p.Q111H | Q9NVH1 | protein_coding | deleterious(0.03) | probably_damaging(0.922) | TCGA-A8-A095-01 | Breast | breast invasive carcinoma | Female | <65 | I/II | Chemotherapy | 5-fluorouracil | CR | |
| DNAJC11 | SNV | Missense_Mutation | c.316N>C | p.Glu106Gln | p.E106Q | Q9NVH1 | protein_coding | deleterious(0) | probably_damaging(0.992) | TCGA-BH-A0HP-01 | Breast | breast invasive carcinoma | Female | >=65 | III/IV | Chemotherapy | doxorubicin | SD | |
| DNAJC11 | insertion | Frame_Shift_Ins | novel | c.900_901insTGTCACGTATCCAAACAGAACTCGATCCC | p.Ile301CysfsTer17 | p.I301Cfs*17 | Q9NVH1 | protein_coding | TCGA-A8-A082-01 | Breast | breast invasive carcinoma | Female | <65 | I/II | Chemotherapy | 5-fluorouracil | CR | ||
| DNAJC11 | SNV | Missense_Mutation | rs748496570 | c.1594N>T | p.Arg532Trp | p.R532W | Q9NVH1 | protein_coding | deleterious(0) | probably_damaging(0.997) | TCGA-5M-AAT6-01 | Colorectum | colon adenocarcinoma | Female | <65 | III/IV | Unknown | Unknown | PD |
| DNAJC11 | SNV | Missense_Mutation | novel | c.880N>G | p.Thr294Ala | p.T294A | Q9NVH1 | protein_coding | tolerated(0.3) | benign(0.006) | TCGA-AA-3950-01 | Colorectum | colon adenocarcinoma | Female | >=65 | I/II | Unknown | Unknown | SD |
| DNAJC11 | SNV | Missense_Mutation | rs745627956 | c.1282N>A | p.Ala428Thr | p.A428T | Q9NVH1 | protein_coding | tolerated(0.51) | possibly_damaging(0.453) | TCGA-AY-6197-01 | Colorectum | colon adenocarcinoma | Male | <65 | I/II | Unknown | Unknown | SD |
| DNAJC11 | SNV | Missense_Mutation | rs201758526 | c.1639N>T | p.Arg547Trp | p.R547W | Q9NVH1 | protein_coding | deleterious(0) | probably_damaging(1) | TCGA-F4-6570-01 | Colorectum | colon adenocarcinoma | Female | >=65 | I/II | Unknown | Unknown | SD |
| DNAJC11 | SNV | Missense_Mutation | c.577G>T | p.Gly193Cys | p.G193C | Q9NVH1 | protein_coding | deleterious(0) | probably_damaging(1) | TCGA-WS-AB45-01 | Colorectum | colon adenocarcinoma | Female | <65 | I/II | Unknown | Unknown | SD | |
| DNAJC11 | SNV | Missense_Mutation | c.611C>T | p.Ser204Leu | p.S204L | Q9NVH1 | protein_coding | deleterious(0) | probably_damaging(0.923) | TCGA-AG-A002-01 | Colorectum | rectum adenocarcinoma | Male | <65 | I/II | Unknown | Unknown | SD | |
| DNAJC11 | SNV | Missense_Mutation | novel | c.742C>T | p.Arg248Cys | p.R248C | Q9NVH1 | protein_coding | tolerated(0.1) | possibly_damaging(0.838) | TCGA-A5-A1OF-01 | Endometrium | uterine corpus endometrioid carcinoma | Female | <65 | I/II | Unknown | Unknown | SD |
| Page: 1 2 3 4 5 |
Top |
Related drugs of malignant transformation related genes |
| Identification of chemicals and drugs interact with genes involved in malignant transfromation |
| (DGIdb 4.0) |
| Entrez ID | Symbol | Category | Interaction Types | Drug Claim Name | Drug Name | PMIDs |
| Page: 1 |

Copyright 2023-Present -The University of Texas Health Science Center at Houston |