| Tissue | Expression Dynamics | Abbreviation |
| Endometrium | 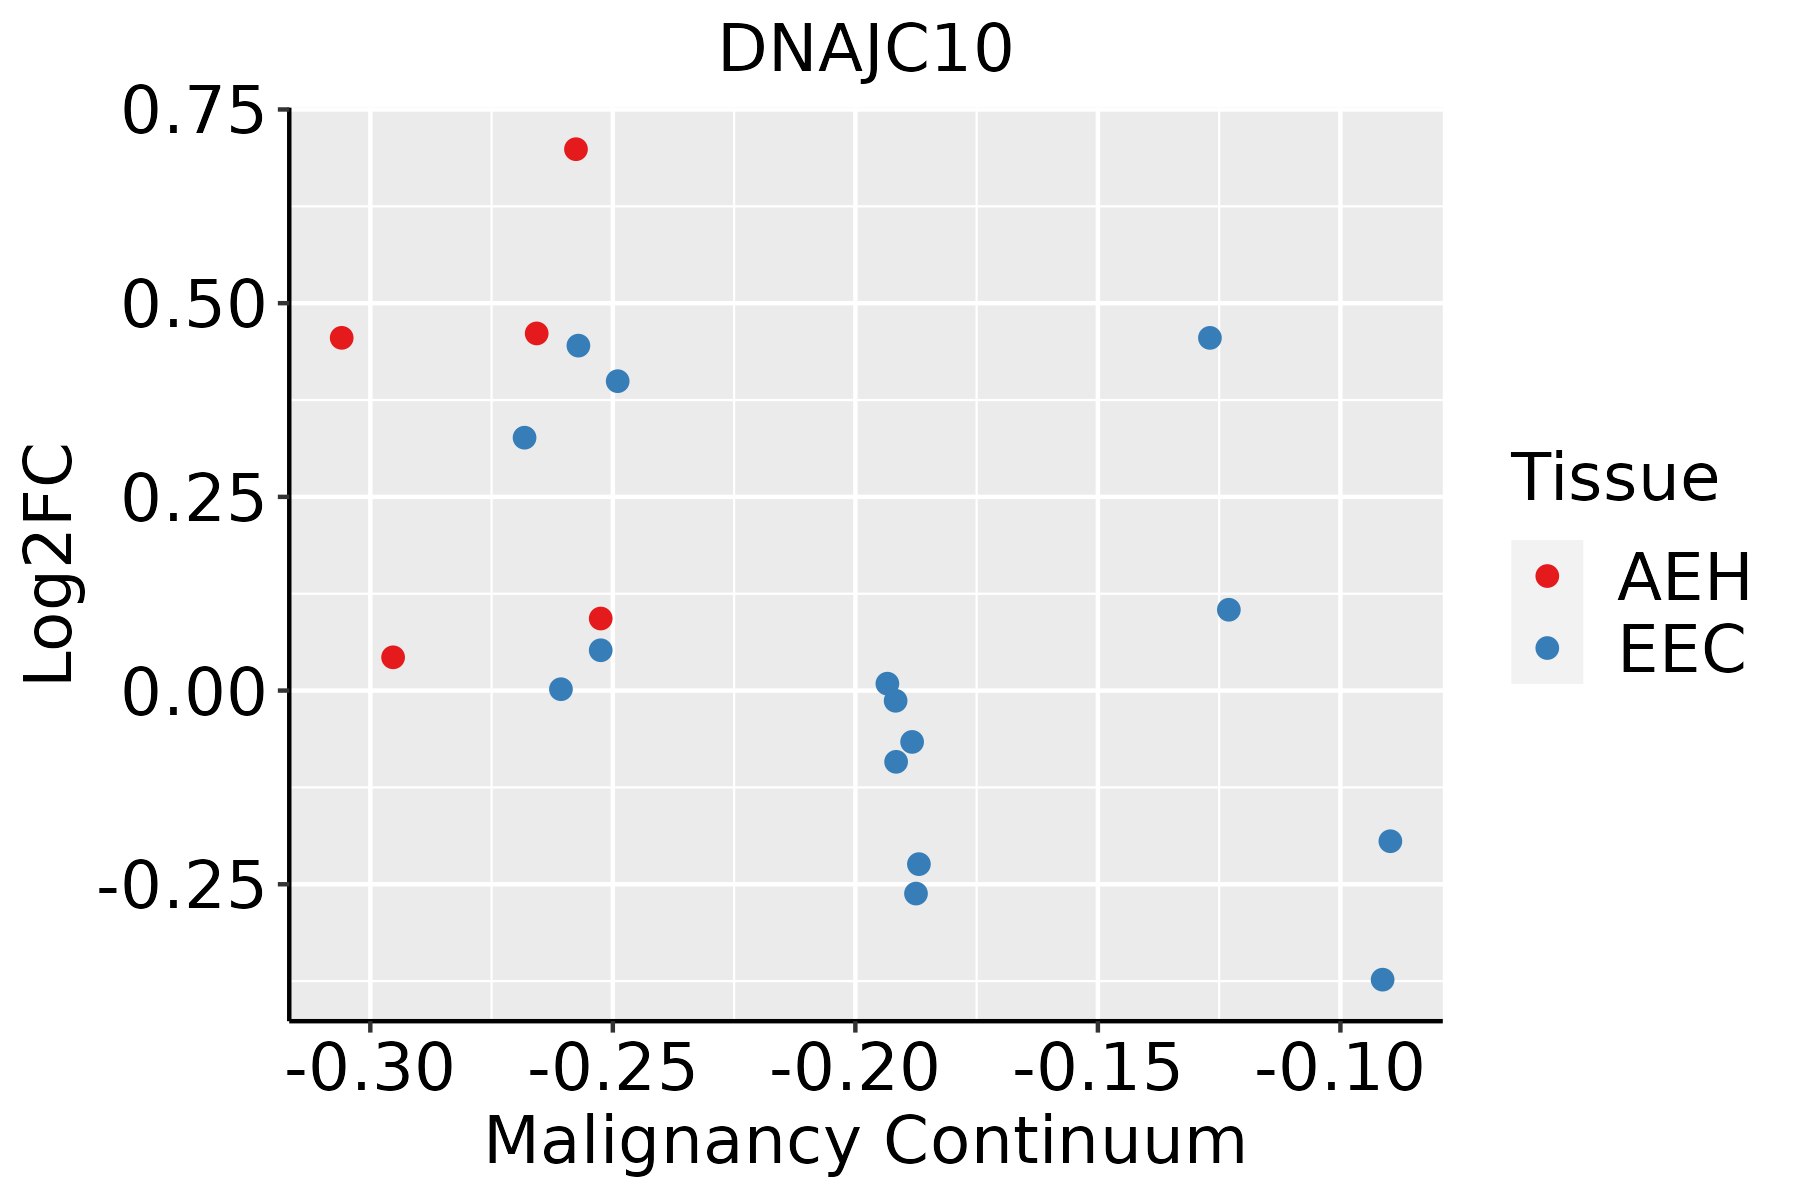 | AEH: Atypical endometrial hyperplasia |
| EEC: Endometrioid Cancer |
| Esophagus | 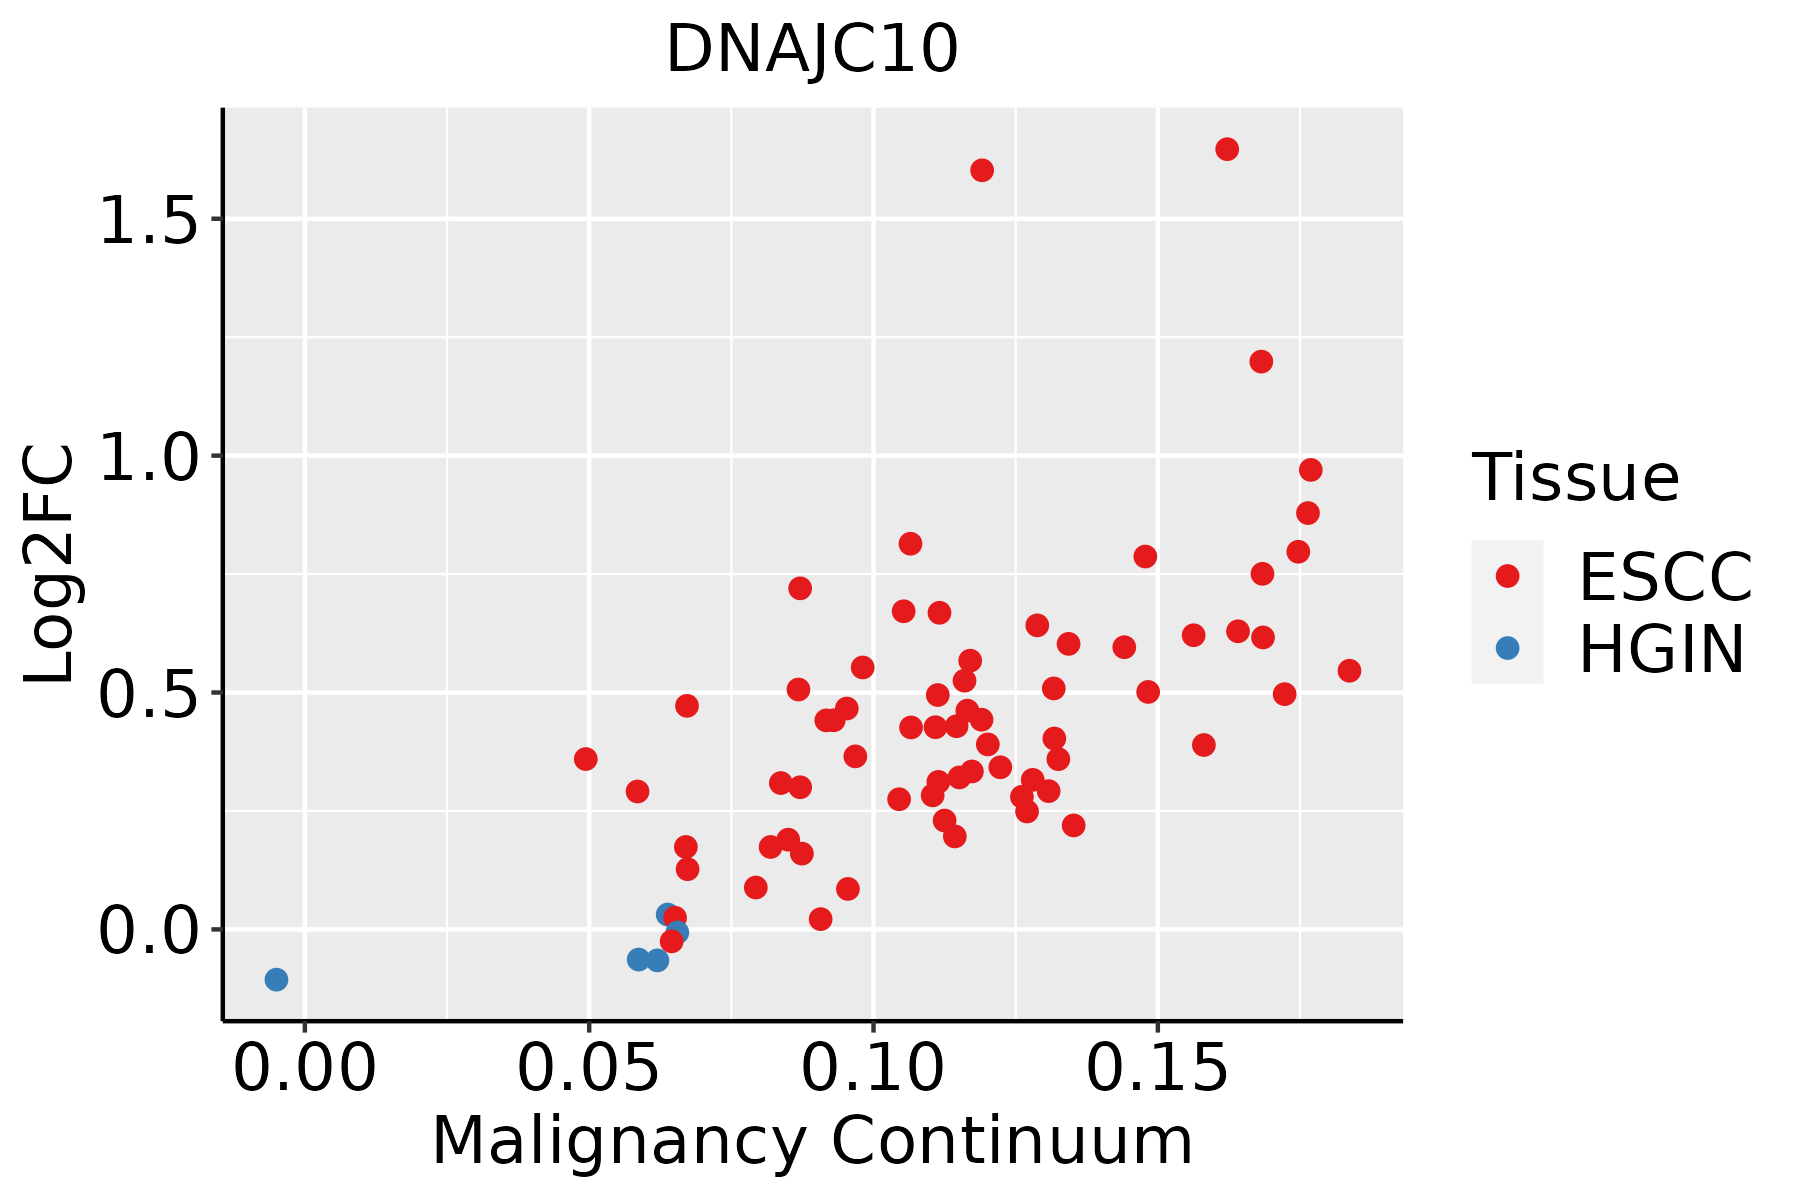 | ESCC: Esophageal squamous cell carcinoma |
| HGIN: High-grade intraepithelial neoplasias |
| LGIN: Low-grade intraepithelial neoplasias |
| Liver |  | HCC: Hepatocellular carcinoma |
| NAFLD: Non-alcoholic fatty liver disease |
| Oral Cavity | 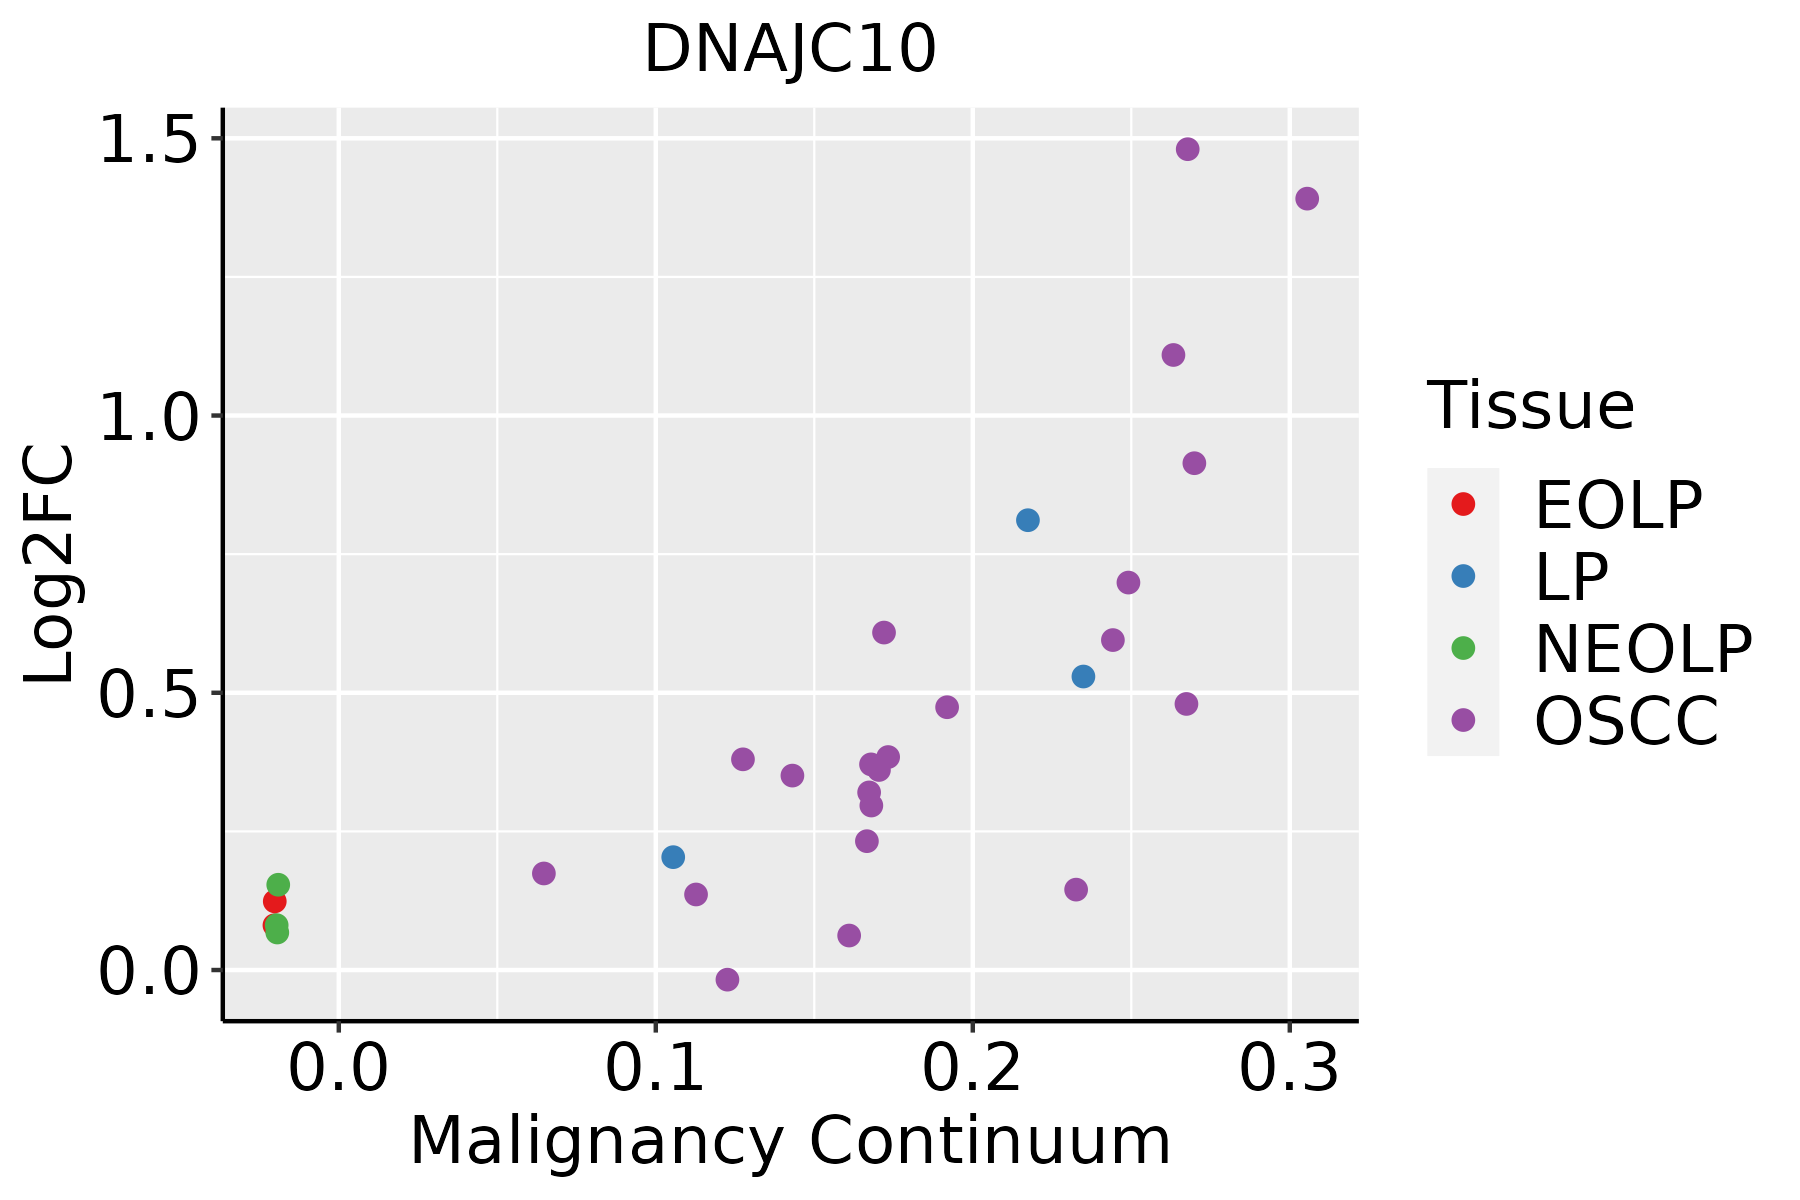 | EOLP: Erosive Oral lichen planus |
| LP: leukoplakia |
| NEOLP: Non-erosive oral lichen planus |
| OSCC: Oral squamous cell carcinoma |
| Prostate |  | BPH: Benign Prostatic Hyperplasia |
| Skin | 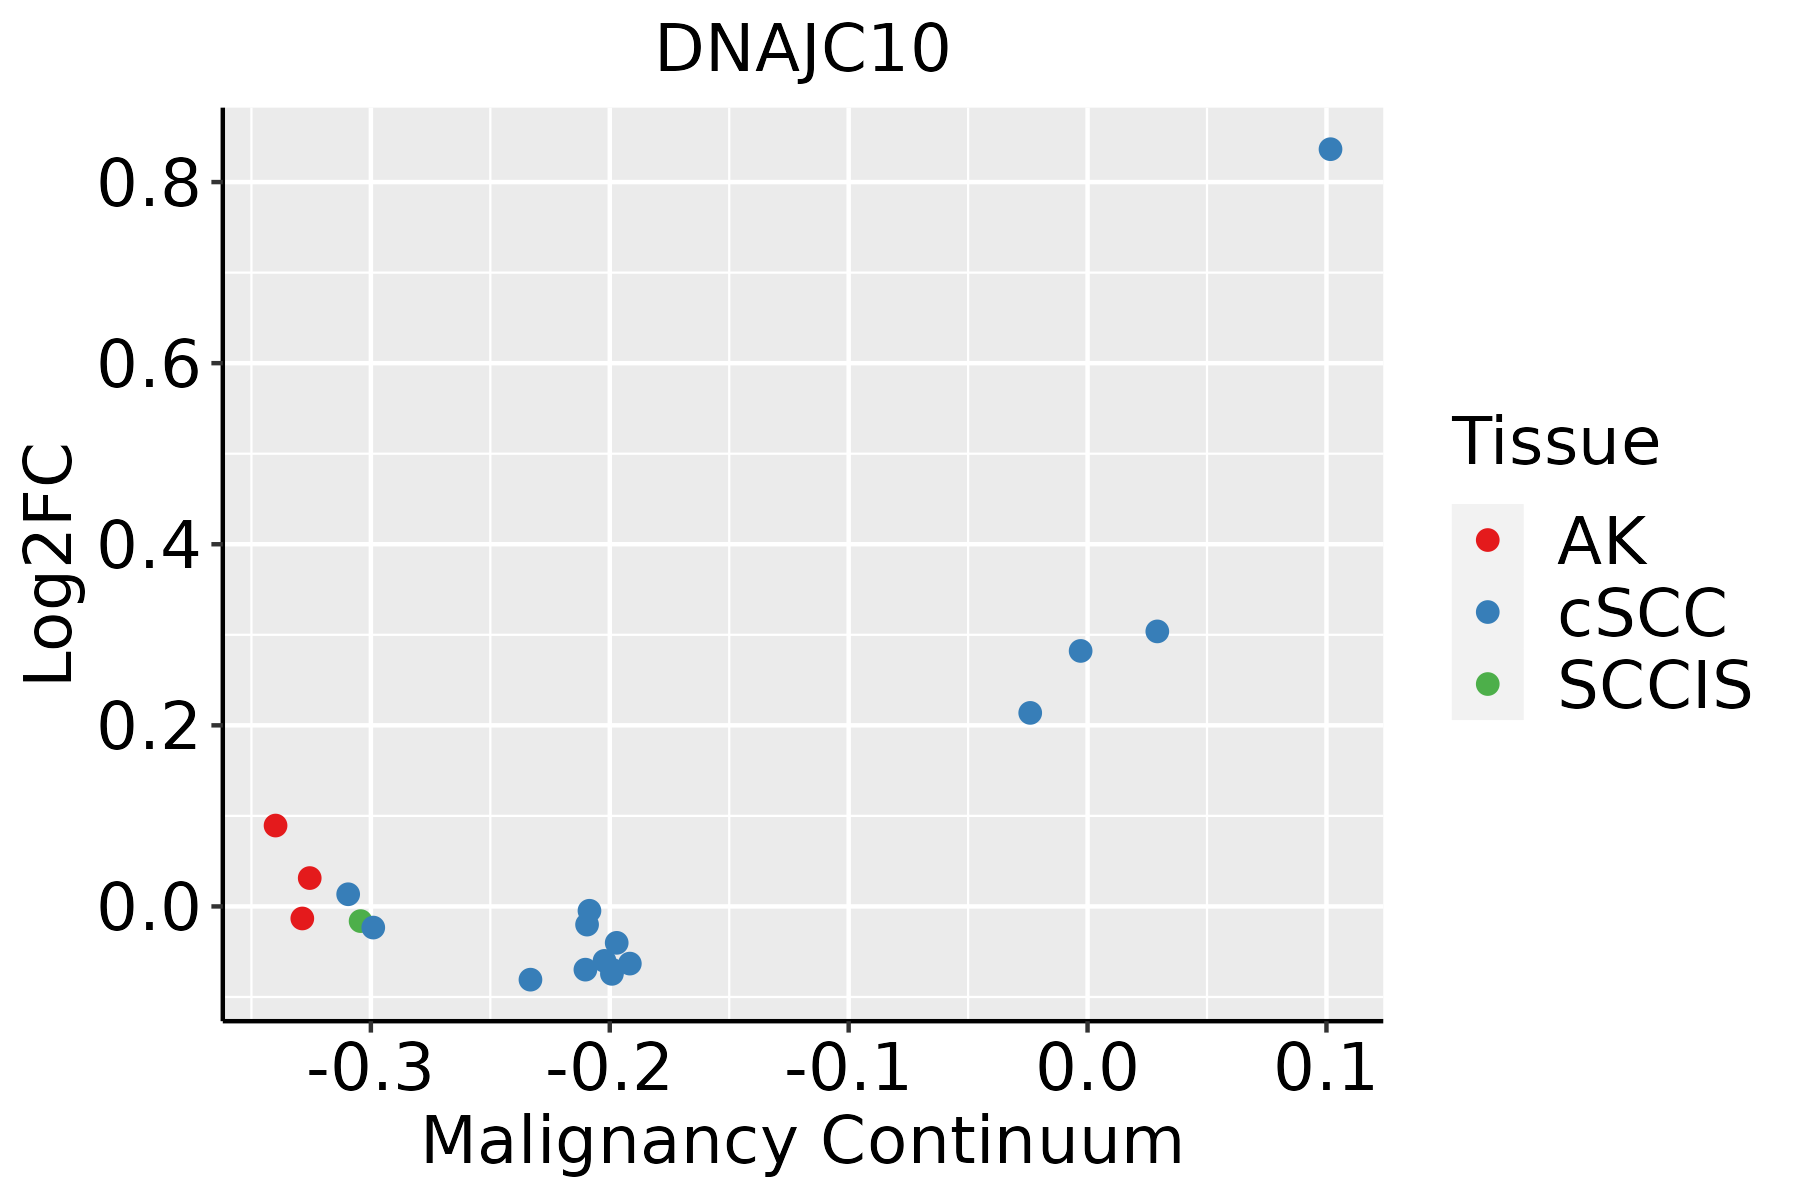 | AK: Actinic keratosis |
| cSCC: Cutaneous squamous cell carcinoma |
| SCCIS:squamous cell carcinoma in situ |
| Thyroid |  | ATC: Anaplastic thyroid cancer |
| HT: Hashimoto's thyroiditis |
| PTC: Papillary thyroid cancer |
| GO ID | Tissue | Disease Stage | Description | Gene Ratio | Bg Ratio | pvalue | p.adjust | Count |
| GO:009719316 | Endometrium | AEH | intrinsic apoptotic signaling pathway | 75/2100 | 288/18723 | 1.46e-12 | 2.83e-10 | 75 |
| GO:000645710 | Endometrium | AEH | protein folding | 61/2100 | 212/18723 | 1.86e-12 | 3.48e-10 | 61 |
| GO:001049816 | Endometrium | AEH | proteasomal protein catabolic process | 108/2100 | 490/18723 | 2.73e-12 | 4.67e-10 | 108 |
| GO:004316116 | Endometrium | AEH | proteasome-mediated ubiquitin-dependent protein catabolic process | 88/2100 | 412/18723 | 1.54e-09 | 1.36e-07 | 88 |
| GO:003497616 | Endometrium | AEH | response to endoplasmic reticulum stress | 62/2100 | 256/18723 | 2.88e-09 | 2.13e-07 | 62 |
| GO:003497510 | Endometrium | AEH | protein folding in endoplasmic reticulum | 7/2100 | 11/18723 | 4.84e-05 | 7.94e-04 | 7 |
| GO:004593616 | Endometrium | AEH | negative regulation of phosphate metabolic process | 77/2100 | 441/18723 | 5.13e-05 | 8.25e-04 | 77 |
| GO:001056316 | Endometrium | AEH | negative regulation of phosphorus metabolic process | 77/2100 | 442/18723 | 5.54e-05 | 8.79e-04 | 77 |
| GO:007005910 | Endometrium | AEH | intrinsic apoptotic signaling pathway in response to endoplasmic reticulum stress | 18/2100 | 63/18723 | 1.32e-04 | 1.80e-03 | 18 |
| GO:000193315 | Endometrium | AEH | negative regulation of protein phosphorylation | 60/2100 | 342/18723 | 2.89e-04 | 3.31e-03 | 60 |
| GO:004232615 | Endometrium | AEH | negative regulation of phosphorylation | 65/2100 | 385/18723 | 4.93e-04 | 5.06e-03 | 65 |
| GO:00365033 | Endometrium | AEH | ERAD pathway | 23/2100 | 107/18723 | 1.55e-03 | 1.27e-02 | 23 |
| GO:00304332 | Endometrium | AEH | ubiquitin-dependent ERAD pathway | 18/2100 | 85/18723 | 5.63e-03 | 3.46e-02 | 18 |
| GO:009719317 | Endometrium | EEC | intrinsic apoptotic signaling pathway | 80/2168 | 288/18723 | 3.35e-14 | 9.13e-12 | 80 |
| GO:000645715 | Endometrium | EEC | protein folding | 63/2168 | 212/18723 | 6.82e-13 | 1.40e-10 | 63 |
| GO:001049817 | Endometrium | EEC | proteasomal protein catabolic process | 112/2168 | 490/18723 | 6.99e-13 | 1.40e-10 | 112 |
| GO:004316117 | Endometrium | EEC | proteasome-mediated ubiquitin-dependent protein catabolic process | 92/2168 | 412/18723 | 3.01e-10 | 3.23e-08 | 92 |
| GO:003497617 | Endometrium | EEC | response to endoplasmic reticulum stress | 63/2168 | 256/18723 | 3.84e-09 | 2.71e-07 | 63 |
| GO:007005916 | Endometrium | EEC | intrinsic apoptotic signaling pathway in response to endoplasmic reticulum stress | 19/2168 | 63/18723 | 5.95e-05 | 9.14e-04 | 19 |
| GO:003497515 | Endometrium | EEC | protein folding in endoplasmic reticulum | 7/2168 | 11/18723 | 5.97e-05 | 9.14e-04 | 7 |
| Pathway ID | Tissue | Disease Stage | Description | Gene Ratio | Bg Ratio | pvalue | p.adjust | qvalue | Count |
| hsa0414126 | Endometrium | AEH | Protein processing in endoplasmic reticulum | 62/1197 | 174/8465 | 5.97e-13 | 1.39e-11 | 1.01e-11 | 62 |
| hsa04141111 | Endometrium | AEH | Protein processing in endoplasmic reticulum | 62/1197 | 174/8465 | 5.97e-13 | 1.39e-11 | 1.01e-11 | 62 |
| hsa0414127 | Endometrium | EEC | Protein processing in endoplasmic reticulum | 64/1237 | 174/8465 | 2.17e-13 | 5.09e-12 | 3.80e-12 | 64 |
| hsa0414136 | Endometrium | EEC | Protein processing in endoplasmic reticulum | 64/1237 | 174/8465 | 2.17e-13 | 5.09e-12 | 3.80e-12 | 64 |
| hsa04141211 | Esophagus | ESCC | Protein processing in endoplasmic reticulum | 147/4205 | 174/8465 | 3.29e-22 | 1.10e-19 | 5.64e-20 | 147 |
| hsa04141310 | Esophagus | ESCC | Protein processing in endoplasmic reticulum | 147/4205 | 174/8465 | 3.29e-22 | 1.10e-19 | 5.64e-20 | 147 |
| hsa0414114 | Liver | Cirrhotic | Protein processing in endoplasmic reticulum | 114/2530 | 174/8465 | 1.16e-22 | 9.67e-21 | 5.96e-21 | 114 |
| hsa0414115 | Liver | Cirrhotic | Protein processing in endoplasmic reticulum | 114/2530 | 174/8465 | 1.16e-22 | 9.67e-21 | 5.96e-21 | 114 |
| hsa0414122 | Liver | HCC | Protein processing in endoplasmic reticulum | 146/4020 | 174/8465 | 7.34e-24 | 2.46e-21 | 1.37e-21 | 146 |
| hsa0414132 | Liver | HCC | Protein processing in endoplasmic reticulum | 146/4020 | 174/8465 | 7.34e-24 | 2.46e-21 | 1.37e-21 | 146 |
| hsa0414130 | Oral cavity | OSCC | Protein processing in endoplasmic reticulum | 143/3704 | 174/8465 | 6.82e-26 | 2.28e-23 | 1.16e-23 | 143 |
| hsa04141113 | Oral cavity | OSCC | Protein processing in endoplasmic reticulum | 143/3704 | 174/8465 | 6.82e-26 | 2.28e-23 | 1.16e-23 | 143 |
| hsa0414162 | Oral cavity | NEOLP | Protein processing in endoplasmic reticulum | 49/1112 | 174/8465 | 9.02e-08 | 1.37e-06 | 8.59e-07 | 49 |
| hsa0414172 | Oral cavity | NEOLP | Protein processing in endoplasmic reticulum | 49/1112 | 174/8465 | 9.02e-08 | 1.37e-06 | 8.59e-07 | 49 |
| hsa0414128 | Prostate | BPH | Protein processing in endoplasmic reticulum | 97/1718 | 174/8465 | 2.37e-25 | 1.30e-23 | 8.07e-24 | 97 |
| hsa04141112 | Prostate | BPH | Protein processing in endoplasmic reticulum | 97/1718 | 174/8465 | 2.37e-25 | 1.30e-23 | 8.07e-24 | 97 |
| hsa0414129 | Prostate | Tumor | Protein processing in endoplasmic reticulum | 99/1791 | 174/8465 | 2.58e-25 | 1.71e-23 | 1.06e-23 | 99 |
| hsa0414137 | Prostate | Tumor | Protein processing in endoplasmic reticulum | 99/1791 | 174/8465 | 2.58e-25 | 1.71e-23 | 1.06e-23 | 99 |
| Hugo Symbol | Variant Class | Variant Classification | dbSNP RS | HGVSc | HGVSp | HGVSp Short | SWISSPROT | BIOTYPE | SIFT | PolyPhen | Tumor Sample Barcode | Tissue | Histology | Sex | Age | Stage | Therapy Types | Drugs | Outcome |
| DNAJC10 | SNV | Missense_Mutation | rs371494397 | c.1729N>A | p.Glu577Lys | p.E577K | Q8IXB1 | protein_coding | deleterious(0.02) | benign(0.237) | TCGA-A2-A0CX-01 | Breast | breast invasive carcinoma | Female | <65 | I/II | Chemotherapy | adriamycin | SD |
| DNAJC10 | SNV | Missense_Mutation | | c.1897N>A | p.Glu633Lys | p.E633K | Q8IXB1 | protein_coding | tolerated(0.12) | possibly_damaging(0.805) | TCGA-A8-A0A7-01 | Breast | breast invasive carcinoma | Female | <65 | I/II | Unknown | Unknown | SD |
| DNAJC10 | SNV | Missense_Mutation | rs139539130 | c.1897N>C | p.Glu633Gln | p.E633Q | Q8IXB1 | protein_coding | tolerated(0.08) | possibly_damaging(0.903) | TCGA-AC-A23H-01 | Breast | breast invasive carcinoma | Female | >=65 | I/II | Unknown | Unknown | PD |
| DNAJC10 | SNV | Missense_Mutation | rs762911899 | c.1253N>T | p.Pro418Leu | p.P418L | Q8IXB1 | protein_coding | deleterious(0) | possibly_damaging(0.574) | TCGA-BH-A18Q-01 | Breast | breast invasive carcinoma | Female | <65 | I/II | Unknown | Unknown | SD |
| DNAJC10 | SNV | Missense_Mutation | novel | c.590N>A | p.Gly197Glu | p.G197E | Q8IXB1 | protein_coding | deleterious(0) | probably_damaging(0.999) | TCGA-EW-A6SA-01 | Breast | breast invasive carcinoma | Male | <65 | I/II | Unknown | Unknown | SD |
| DNAJC10 | insertion | Frame_Shift_Ins | novel | c.1725_1726insAA | p.Asn576LysfsTer20 | p.N576Kfs*20 | Q8IXB1 | protein_coding | | | TCGA-AO-A128-01 | Breast | breast invasive carcinoma | Female | <65 | I/II | Chemotherapy | doxorubicin | SD |
| DNAJC10 | SNV | Missense_Mutation | rs768125706 | c.2314G>A | p.Ala772Thr | p.A772T | Q8IXB1 | protein_coding | tolerated(0.3) | benign(0.07) | TCGA-2W-A8YY-01 | Cervix | cervical & endocervical cancer | Female | <65 | I/II | Chemotherapy | cisplatin | CR |
| DNAJC10 | SNV | Missense_Mutation | novel | c.1630N>A | p.Glu544Lys | p.E544K | Q8IXB1 | protein_coding | tolerated(0.29) | benign(0.114) | TCGA-C5-A2LZ-01 | Cervix | cervical & endocervical cancer | Female | >=65 | III/IV | Unknown | Unknown | PD |
| DNAJC10 | SNV | Missense_Mutation | rs141135661 | c.316N>A | p.Asp106Asn | p.D106N | Q8IXB1 | protein_coding | tolerated(0.07) | possibly_damaging(0.693) | TCGA-EK-A2RJ-01 | Cervix | cervical & endocervical cancer | Female | <65 | I/II | Unknown | Unknown | SD |
| DNAJC10 | SNV | Missense_Mutation | rs776207150 | c.356N>A | p.Arg119His | p.R119H | Q8IXB1 | protein_coding | tolerated(0.06) | possibly_damaging(0.738) | TCGA-A6-2686-01 | Colorectum | colon adenocarcinoma | Female | >=65 | I/II | Unknown | Unknown | SD |


