
|
|||||
|
 | |
| |
| |
| |
| |
| |
|
Gene: DNAJB9 |
Gene summary for DNAJB9 |
| Gene information | Species | Human | Gene symbol | DNAJB9 | Gene ID | 4189 |
| Gene name | DnaJ heat shock protein family (Hsp40) member B9 | |
| Gene Alias | ERdj4 | |
| Cytomap | 7q31.1 | |
| Gene Type | protein-coding | GO ID | GO:0001775 | UniProtAcc | Q6FIF1 |
Top |
Malignant transformation analysis |
| Identification of the aberrant gene expression in precancerous and cancerous lesions by comparing the gene expression of stem-like cells in diseased tissues with normal stem cells |
| Entrez ID | Symbol | Replicates | Species | Organ | Tissue | Adj P-value | Log2FC | Malignancy |
| 4189 | DNAJB9 | AEH-subject5 | Human | Endometrium | AEH | 2.61e-03 | -1.93e-01 | -0.2953 |
| 4189 | DNAJB9 | EEC-subject1 | Human | Endometrium | EEC | 2.43e-02 | -7.52e-02 | -0.2682 |
| 4189 | DNAJB9 | EEC-subject2 | Human | Endometrium | EEC | 3.83e-02 | -1.88e-01 | -0.2607 |
| 4189 | DNAJB9 | EEC-subject3 | Human | Endometrium | EEC | 1.07e-11 | -1.73e-01 | -0.2525 |
| 4189 | DNAJB9 | GSM5276934 | Human | Endometrium | EEC | 1.74e-10 | 4.71e-01 | -0.0913 |
| 4189 | DNAJB9 | GSM5276937 | Human | Endometrium | EEC | 7.01e-25 | 6.23e-01 | -0.0897 |
| 4189 | DNAJB9 | GSM6177620_NYU_UCEC1_lib1_lib1 | Human | Endometrium | EEC | 9.71e-14 | -1.56e-01 | -0.1869 |
| 4189 | DNAJB9 | GSM6177620_NYU_UCEC1_lib2_lib2 | Human | Endometrium | EEC | 1.09e-15 | -2.17e-01 | -0.1875 |
| 4189 | DNAJB9 | GSM6177620_NYU_UCEC1_lib3_lib3 | Human | Endometrium | EEC | 6.80e-19 | -1.70e-01 | -0.1883 |
| 4189 | DNAJB9 | GSM6177621_NYU_UCEC2_lib1_lib1 | Human | Endometrium | EEC | 1.36e-06 | -1.16e-01 | -0.1934 |
| 4189 | DNAJB9 | GSM6177622_NYU_UCEC3_lib1_lib1 | Human | Endometrium | EEC | 2.55e-15 | -2.39e-01 | -0.1917 |
| 4189 | DNAJB9 | GSM6177622_NYU_UCEC3_lib2_lib2 | Human | Endometrium | EEC | 5.31e-17 | -2.36e-01 | -0.1916 |
| 4189 | DNAJB9 | GSM6177623_NYU_UCEC3_Vis | Human | Endometrium | EEC | 3.83e-02 | -2.24e-01 | -0.1269 |
| 4189 | DNAJB9 | LZE4T | Human | Esophagus | ESCC | 5.43e-09 | 2.19e-01 | 0.0811 |
| 4189 | DNAJB9 | LZE5T | Human | Esophagus | ESCC | 2.71e-02 | 9.55e-02 | 0.0514 |
| 4189 | DNAJB9 | LZE7T | Human | Esophagus | ESCC | 3.50e-04 | 6.68e-01 | 0.0667 |
| 4189 | DNAJB9 | LZE8T | Human | Esophagus | ESCC | 7.48e-06 | 3.64e-01 | 0.067 |
| 4189 | DNAJB9 | LZE24T | Human | Esophagus | ESCC | 3.19e-09 | 5.85e-01 | 0.0596 |
| 4189 | DNAJB9 | LZE6T | Human | Esophagus | ESCC | 3.64e-05 | 3.16e-01 | 0.0845 |
| 4189 | DNAJB9 | P1T-E | Human | Esophagus | ESCC | 1.93e-07 | 1.40e+00 | 0.0875 |
| Page: 1 2 3 4 5 6 7 |
| Tissue | Expression Dynamics | Abbreviation |
| Endometrium | 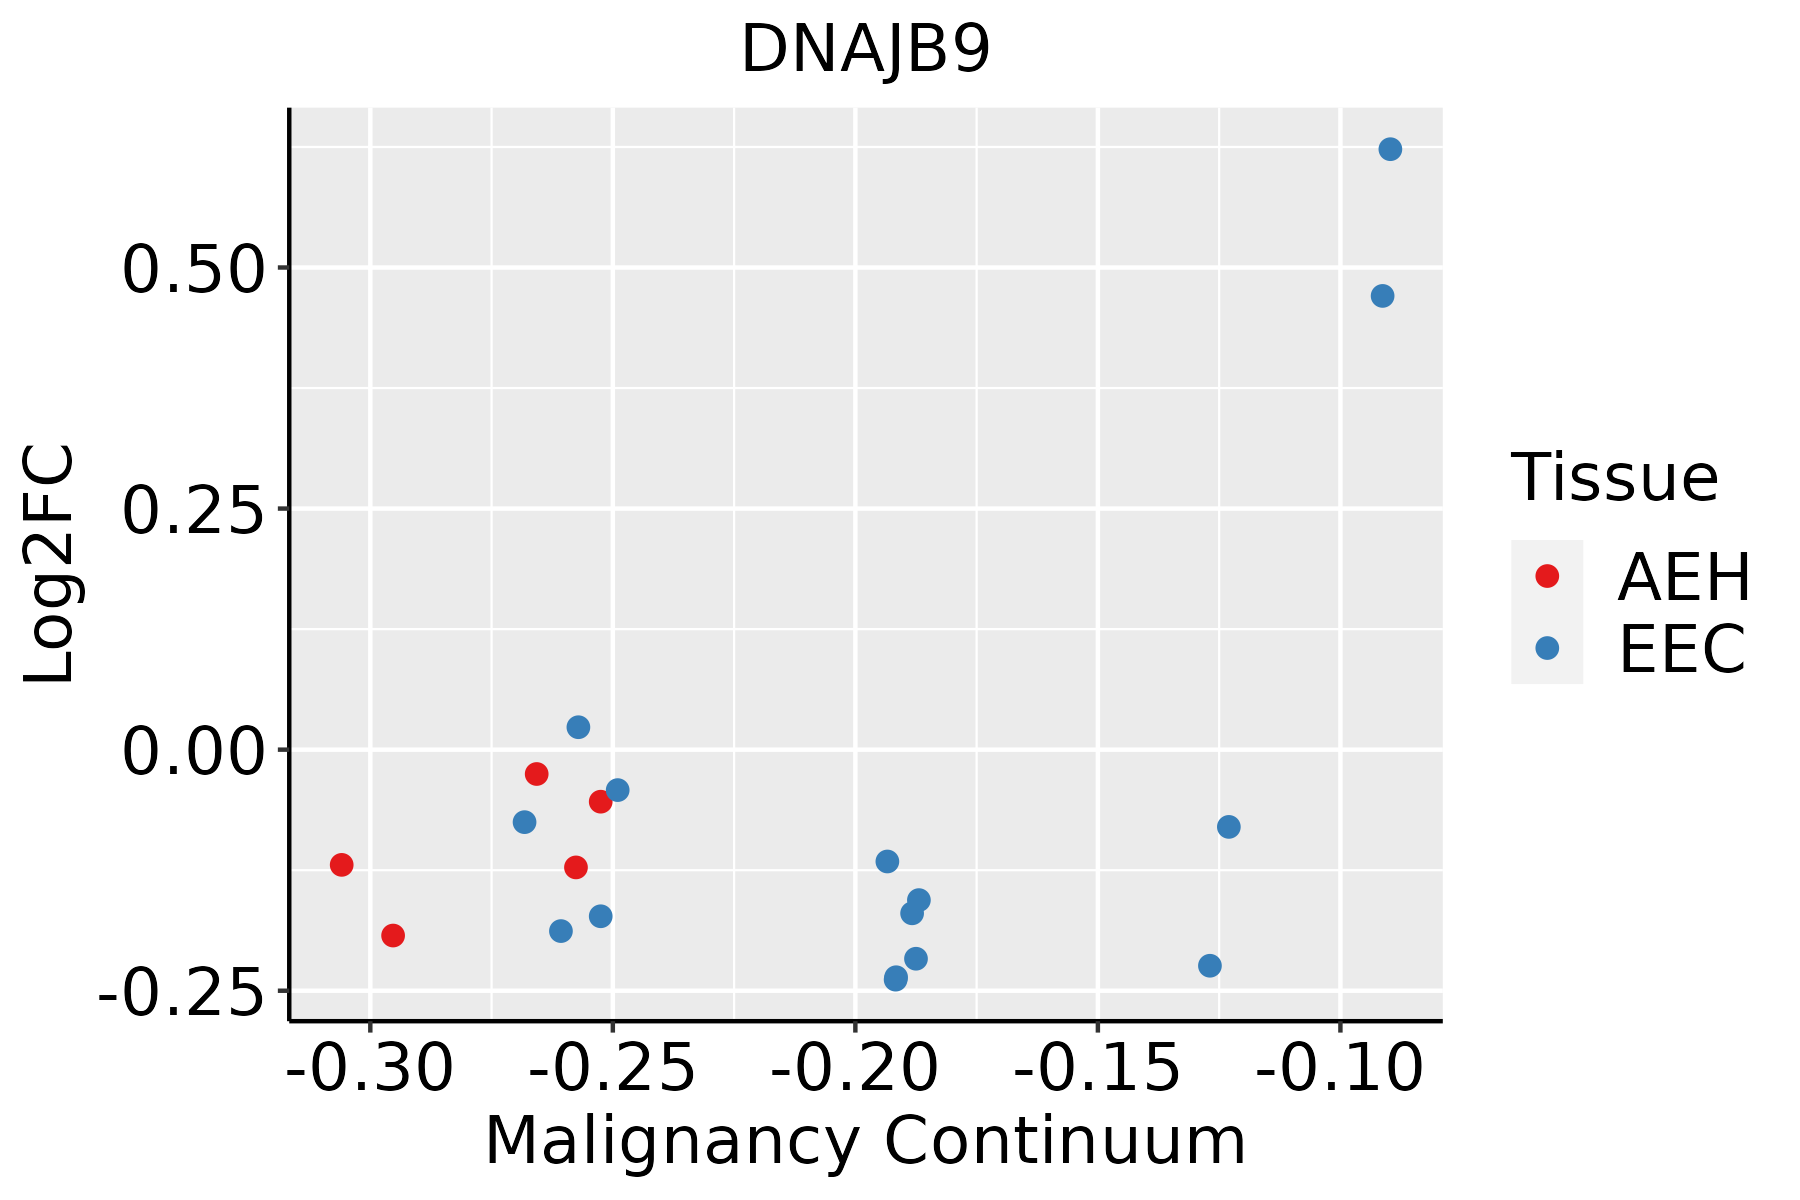 | AEH: Atypical endometrial hyperplasia |
| EEC: Endometrioid Cancer | ||
| Esophagus |  | ESCC: Esophageal squamous cell carcinoma |
| HGIN: High-grade intraepithelial neoplasias | ||
| LGIN: Low-grade intraepithelial neoplasias | ||
| Liver | 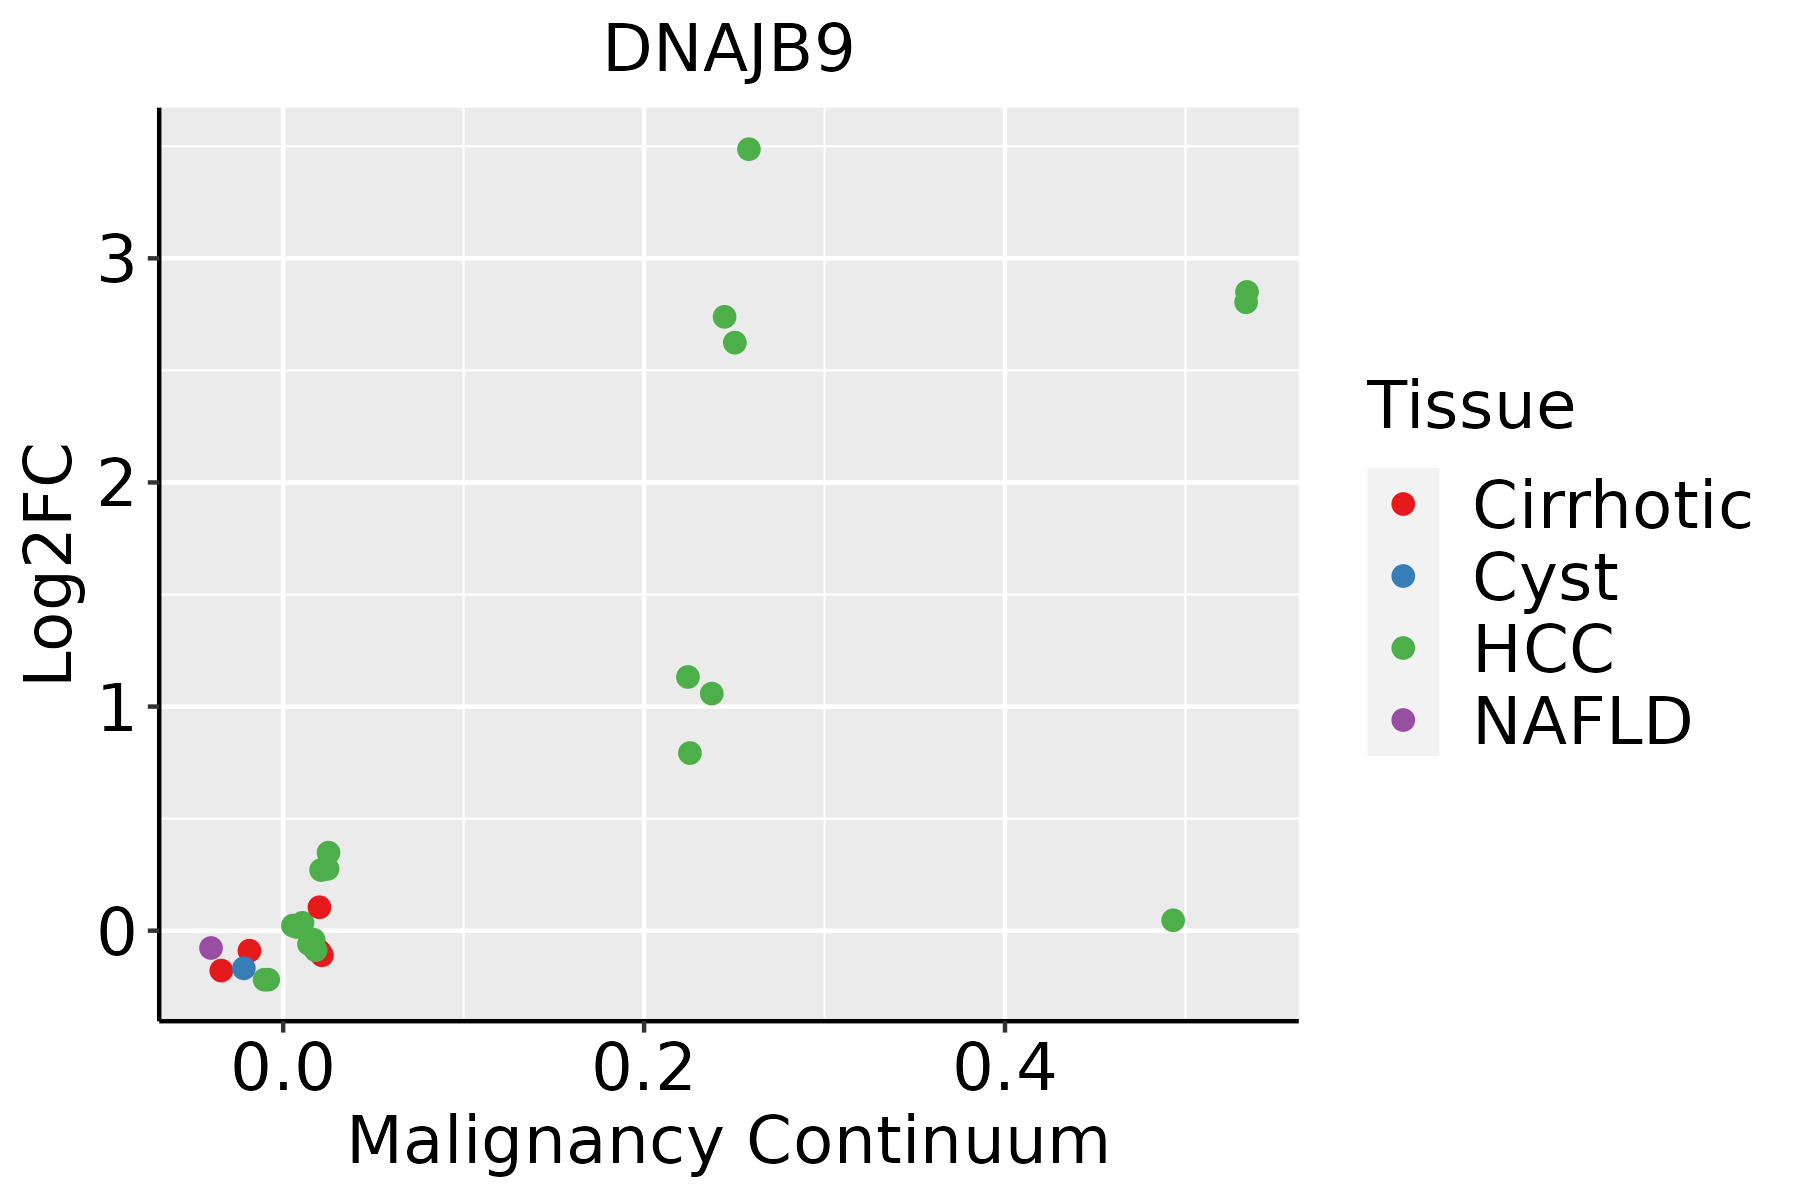 | HCC: Hepatocellular carcinoma |
| NAFLD: Non-alcoholic fatty liver disease | ||
| Oral Cavity |  | EOLP: Erosive Oral lichen planus |
| LP: leukoplakia | ||
| NEOLP: Non-erosive oral lichen planus | ||
| OSCC: Oral squamous cell carcinoma | ||
| Prostate | 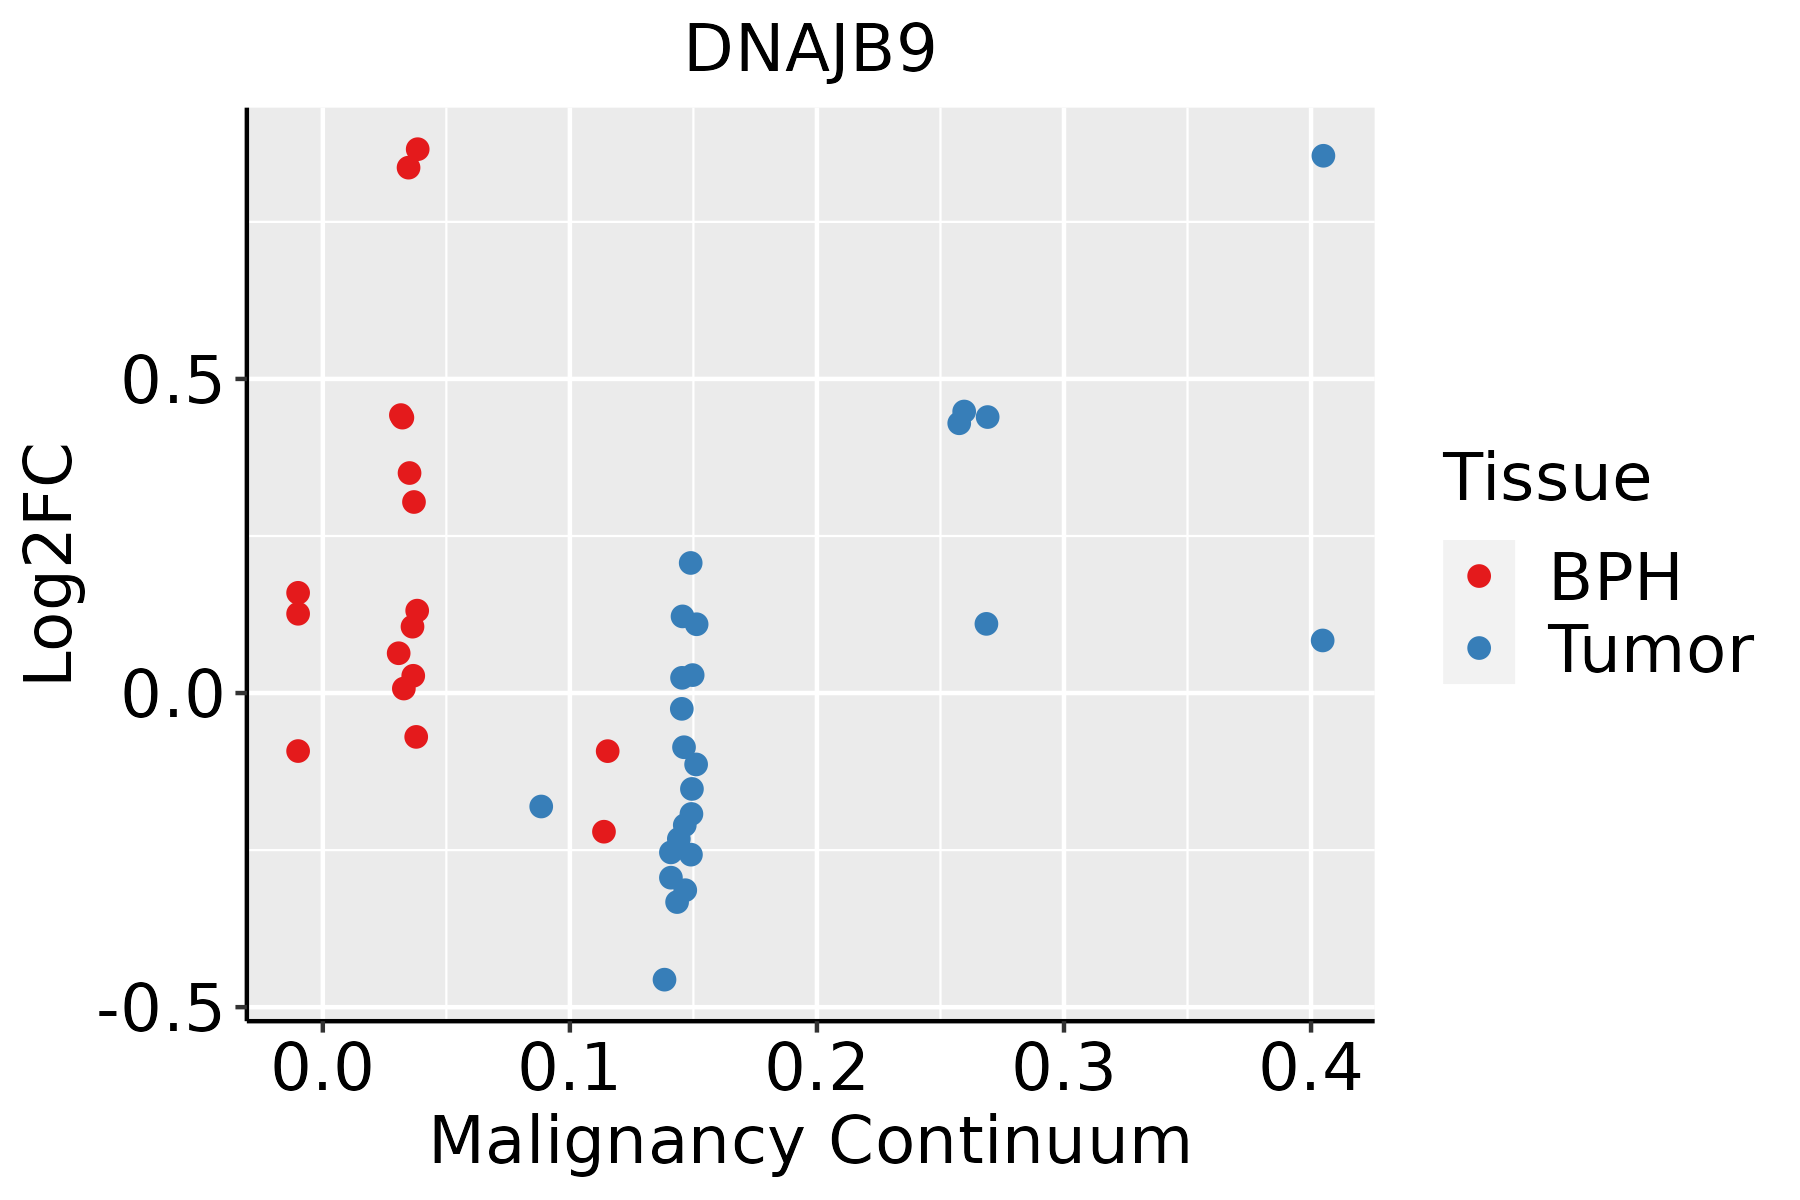 | BPH: Benign Prostatic Hyperplasia |
| Thyroid | 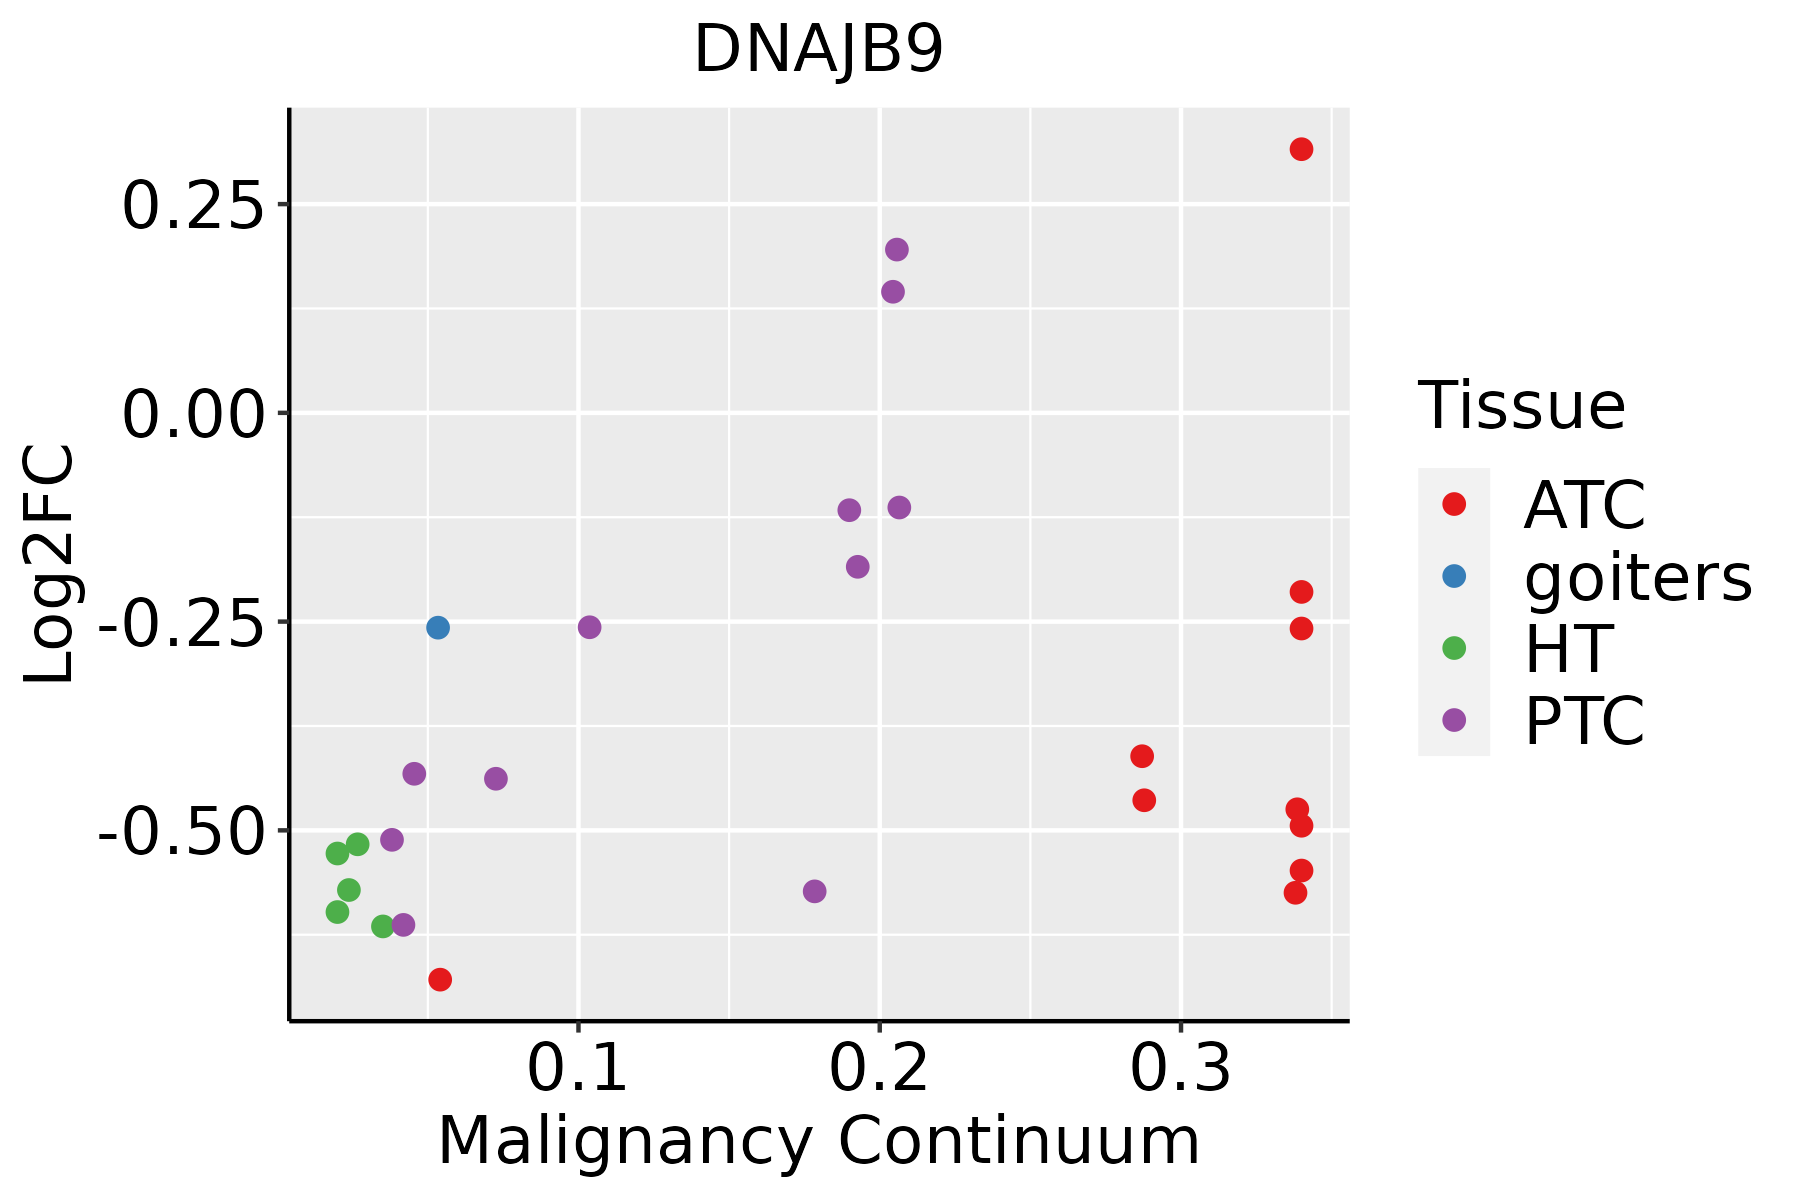 | ATC: Anaplastic thyroid cancer |
| HT: Hashimoto's thyroiditis | ||
| PTC: Papillary thyroid cancer |
| ∗log2FC in expression of this searched gene in stem-like cells from each diseased tissue sample relative to stem-like cells in normal samples in each tissue plotted against the malignancy continuum. Samples are colored based on if they are from different disease stage. |
Top |
Malignant transformation related pathway analysis |
| Find out the enriched GO biological processes and KEGG pathways involved in transition from healthy to precancer to cancer |
| Tissue | Disease Stage | Enriched GO biological Processes |
| Colorectum | AD |  |
| Colorectum | SER |  |
| Colorectum | MSS |  |
| Colorectum | MSI-H |  |
| Colorectum | FAP |  |
| ∗Top 15 enriched GO BP terms are showed in the bar plot of each disease state in each tissue. Each row represents a significant GO biological process which is colored according to the -log10(p.adjust). |
| Page: 1 2 3 4 5 6 7 8 9 |
| GO ID | Tissue | Disease Stage | Description | Gene Ratio | Bg Ratio | pvalue | p.adjust | Count |
| GO:001049816 | Endometrium | AEH | proteasomal protein catabolic process | 108/2100 | 490/18723 | 2.73e-12 | 4.67e-10 | 108 |
| GO:004316116 | Endometrium | AEH | proteasome-mediated ubiquitin-dependent protein catabolic process | 88/2100 | 412/18723 | 1.54e-09 | 1.36e-07 | 88 |
| GO:003497616 | Endometrium | AEH | response to endoplasmic reticulum stress | 62/2100 | 256/18723 | 2.88e-09 | 2.13e-07 | 62 |
| GO:003596616 | Endometrium | AEH | response to topologically incorrect protein | 39/2100 | 159/18723 | 1.69e-06 | 5.23e-05 | 39 |
| GO:000698616 | Endometrium | AEH | response to unfolded protein | 35/2100 | 137/18723 | 2.09e-06 | 6.28e-05 | 35 |
| GO:003462015 | Endometrium | AEH | cellular response to unfolded protein | 25/2100 | 96/18723 | 4.07e-05 | 6.97e-04 | 25 |
| GO:003596716 | Endometrium | AEH | cellular response to topologically incorrect protein | 28/2100 | 116/18723 | 6.38e-05 | 9.94e-04 | 28 |
| GO:190589716 | Endometrium | AEH | regulation of response to endoplasmic reticulum stress | 21/2100 | 82/18723 | 2.10e-04 | 2.59e-03 | 21 |
| GO:190357315 | Endometrium | AEH | negative regulation of response to endoplasmic reticulum stress | 13/2100 | 44/18723 | 7.79e-04 | 7.36e-03 | 13 |
| GO:00365033 | Endometrium | AEH | ERAD pathway | 23/2100 | 107/18723 | 1.55e-03 | 1.27e-02 | 23 |
| GO:00309689 | Endometrium | AEH | endoplasmic reticulum unfolded protein response | 17/2100 | 74/18723 | 2.92e-03 | 2.08e-02 | 17 |
| GO:00304332 | Endometrium | AEH | ubiquitin-dependent ERAD pathway | 18/2100 | 85/18723 | 5.63e-03 | 3.46e-02 | 18 |
| GO:001049817 | Endometrium | EEC | proteasomal protein catabolic process | 112/2168 | 490/18723 | 6.99e-13 | 1.40e-10 | 112 |
| GO:004316117 | Endometrium | EEC | proteasome-mediated ubiquitin-dependent protein catabolic process | 92/2168 | 412/18723 | 3.01e-10 | 3.23e-08 | 92 |
| GO:003497617 | Endometrium | EEC | response to endoplasmic reticulum stress | 63/2168 | 256/18723 | 3.84e-09 | 2.71e-07 | 63 |
| GO:003596617 | Endometrium | EEC | response to topologically incorrect protein | 41/2168 | 159/18723 | 5.20e-07 | 2.00e-05 | 41 |
| GO:000698617 | Endometrium | EEC | response to unfolded protein | 37/2168 | 137/18723 | 5.40e-07 | 2.04e-05 | 37 |
| GO:003462016 | Endometrium | EEC | cellular response to unfolded protein | 26/2168 | 96/18723 | 2.38e-05 | 4.23e-04 | 26 |
| GO:003596717 | Endometrium | EEC | cellular response to topologically incorrect protein | 29/2168 | 116/18723 | 4.28e-05 | 7.09e-04 | 29 |
| GO:190589717 | Endometrium | EEC | regulation of response to endoplasmic reticulum stress | 22/2168 | 82/18723 | 1.14e-04 | 1.54e-03 | 22 |
| Page: 1 2 3 4 5 6 7 8 9 |
| Pathway ID | Tissue | Disease Stage | Description | Gene Ratio | Bg Ratio | pvalue | p.adjust | qvalue | Count |
| Page: 1 |
Top |
Cell-cell communication analysis |
| Identification of potential cell-cell interactions between two cell types and their ligand-receptor pairs for different disease states |
| Ligand | Receptor | LRpair | Pathway | Tissue | Disease Stage |
| Page: 1 |
Top |
Single-cell gene regulatory network inference analysis |
| Find out the significant the regulons (TFs) and the target genes of each regulon across cell types for different disease states |
| TF | Cell Type | Tissue | Disease Stage | Target Gene | RSS | Regulon Activity |
| ∗The dot plots of a searched regulon are shown for all cell subpopulations in each disease state of each tissue based on the regulon specific score inferred using pySCENIC and by calculating the average expression. |
| Page: 1 |
Top |
Somatic mutation of malignant transformation related genes |
| Annotation of somatic variants for genes involved in malignant transformation |
| Hugo Symbol | Variant Class | Variant Classification | dbSNP RS | HGVSc | HGVSp | HGVSp Short | SWISSPROT | BIOTYPE | SIFT | PolyPhen | Tumor Sample Barcode | Tissue | Histology | Sex | Age | Stage | Therapy Types | Drugs | Outcome |
| DNAJB9 | SNV | Missense_Mutation | novel | c.164N>T | p.Pro55Leu | p.P55L | Q9UBS3 | protein_coding | deleterious(0) | probably_damaging(1) | TCGA-A7-A6VW-01 | Breast | breast invasive carcinoma | Female | <65 | I/II | Chemotherapy | doxorubicin | CR |
| DNAJB9 | SNV | Missense_Mutation | c.361G>T | p.Asp121Tyr | p.D121Y | Q9UBS3 | protein_coding | deleterious(0.02) | probably_damaging(0.947) | TCGA-AN-A046-01 | Breast | breast invasive carcinoma | Female | >=65 | I/II | Unknown | Unknown | SD | |
| DNAJB9 | SNV | Missense_Mutation | c.106N>G | p.Ser36Ala | p.S36A | Q9UBS3 | protein_coding | tolerated(0.1) | benign(0.098) | TCGA-AA-A010-01 | Colorectum | colon adenocarcinoma | Female | <65 | I/II | Chemotherapy | folinic | CR | |
| DNAJB9 | SNV | Missense_Mutation | c.522N>T | p.Glu174Asp | p.E174D | Q9UBS3 | protein_coding | tolerated(0.48) | probably_damaging(0.967) | TCGA-CA-6718-01 | Colorectum | colon adenocarcinoma | Male | <65 | I/II | Unknown | Unknown | PD | |
| DNAJB9 | SNV | Missense_Mutation | rs762515467 | c.107C>T | p.Ser36Leu | p.S36L | Q9UBS3 | protein_coding | deleterious(0.03) | possibly_damaging(0.479) | TCGA-AG-A002-01 | Colorectum | rectum adenocarcinoma | Male | <65 | I/II | Unknown | Unknown | SD |
| DNAJB9 | SNV | Missense_Mutation | novel | c.584G>T | p.Arg195Ile | p.R195I | Q9UBS3 | protein_coding | deleterious(0.04) | possibly_damaging(0.548) | TCGA-AG-A002-01 | Colorectum | rectum adenocarcinoma | Male | <65 | I/II | Unknown | Unknown | SD |
| DNAJB9 | SNV | Missense_Mutation | rs748898841 | c.626N>A | p.Arg209Gln | p.R209Q | Q9UBS3 | protein_coding | deleterious(0.03) | probably_damaging(0.988) | TCGA-EI-6917-01 | Colorectum | rectum adenocarcinoma | Male | <65 | III/IV | Chemotherapy | 5fluorouracil+oxaciplatina+l-folinian | SD |
| DNAJB9 | deletion | Frame_Shift_Del | c.523delN | p.Met176CysfsTer67 | p.M176Cfs*67 | Q9UBS3 | protein_coding | TCGA-A6-6781-01 | Colorectum | colon adenocarcinoma | Male | <65 | III/IV | Chemotherapy | oxaliplatin | SD | |||
| DNAJB9 | SNV | Missense_Mutation | c.248G>A | p.Arg83Gln | p.R83Q | Q9UBS3 | protein_coding | deleterious(0) | probably_damaging(0.998) | TCGA-A5-A2K5-01 | Endometrium | uterine corpus endometrioid carcinoma | Female | >=65 | I/II | Unknown | Unknown | SD | |
| DNAJB9 | SNV | Missense_Mutation | novel | c.193N>T | p.Ala65Ser | p.A65S | Q9UBS3 | protein_coding | tolerated(0.39) | benign(0.042) | TCGA-AP-A0LM-01 | Endometrium | uterine corpus endometrioid carcinoma | Female | <65 | III/IV | Chemotherapy | cisplatin | SD |
| Page: 1 2 3 |
Top |
Related drugs of malignant transformation related genes |
| Identification of chemicals and drugs interact with genes involved in malignant transfromation |
| (DGIdb 4.0) |
| Entrez ID | Symbol | Category | Interaction Types | Drug Claim Name | Drug Name | PMIDs |
| Page: 1 |

Copyright 2023-Present -The University of Texas Health Science Center at Houston |