Schematic overview of the cellular and molecular mechanisms involved in the cancer progression, including the proposed cellular and molecular mechanisms in cancer cells trajectory. AT1: alveolar type 1 cells; AT2: alveolar type 2 cells; AAH: atypical adenomatous hyperplasia; AIS: adenocarcinoma in situ; MIA: minimally invasive adenocarcinoma; IA: invasive adenocarcinoma; EMT: epithelial-mesenchymal transition

Home

Download

Statistics

Help

Contact

Center for Computational Systems Medicine
leaf

Gene summary

leaf

Malignant transformation analysis

leaf

Malignant transformation related pathway analysis

leaf

Cell-cell communication analysis

leaf

Single-cell gene regulatory network inference analysis

leaf

Somatic mutation of malignant transformation related genes

leaf

Related drugs of malignant transformation related genes

Gene: DNAJB6

Gene summary for DNAJB6

check button Gene summary.

Gene informationSpeciesHuman
Gene symbol

DNAJB6

Gene ID

10049

Gene nameDnaJ heat shock protein family (Hsp40) member B6
Gene AliasDJ4
Cytomap7q36.3
Gene Typeprotein-coding
GO ID

GO:0000003

UniProtAcc

O75190


Top

Malignant transformation analysis

check button Identification of the aberrant gene expression in precancerous and cancerous lesions by comparing the gene expression of stem-like cells in diseased tissues with normal stem cells
check button Malignant transformation involving gene list.
Entrez IDSymbolReplicatesSpeciesOrganTissueAdj P-valueLog2FCMalignancy
10049DNAJB6GSM4909277HumanBreastPrecancer2.94e-045.68e-010.0177
10049DNAJB6GSM4909285HumanBreastIDC9.39e-10-3.61e-010.21
10049DNAJB6GSM4909286HumanBreastIDC1.64e-051.77e-020.1081
10049DNAJB6GSM4909290HumanBreastIDC1.92e-14-5.39e-010.2096
10049DNAJB6GSM4909293HumanBreastIDC3.57e-10-3.13e-010.1581
10049DNAJB6GSM4909294HumanBreastIDC1.47e-08-3.14e-010.2022
10049DNAJB6GSM4909296HumanBreastIDC3.64e-25-5.97e-010.1524
10049DNAJB6GSM4909297HumanBreastIDC3.16e-22-3.63e-010.1517
10049DNAJB6GSM4909301HumanBreastIDC5.01e-06-3.72e-010.1577
10049DNAJB6GSM4909302HumanBreastIDC1.19e-03-3.08e-010.1545
10049DNAJB6GSM4909304HumanBreastIDC3.33e-11-4.20e-010.1636
10049DNAJB6GSM4909306HumanBreastIDC3.75e-02-2.02e-010.1564
10049DNAJB6GSM4909307HumanBreastIDC7.16e-05-3.55e-010.1569
10049DNAJB6GSM4909309HumanBreastIDC7.84e-08-4.02e-010.0483
10049DNAJB6GSM4909311HumanBreastIDC2.86e-45-6.57e-010.1534
10049DNAJB6GSM4909312HumanBreastIDC1.10e-14-3.46e-010.1552
10049DNAJB6GSM4909313HumanBreastIDC1.76e-03-2.27e-010.0391
10049DNAJB6GSM4909316HumanBreastIDC1.17e-06-4.48e-010.21
10049DNAJB6GSM4909319HumanBreastIDC6.89e-50-6.04e-010.1563
10049DNAJB6GSM4909320HumanBreastIDC2.83e-14-6.60e-010.1575
Page: 1 2 3 4 5 6 7 8 9 10 11 12 13 

check button Transcriptomic changes along malignancy continuum.
TissueExpression DynamicsAbbreviation
BreastThe image shows the transcriptomic changes along malignancy continuum.log2FC in expression of this searched gene in stem-like cells from each diseased tissue sample relative to stem-like cells in normal samples in each tissue plotted against the malignancy continuum. Samples are colored based on if they are from different disease stage.
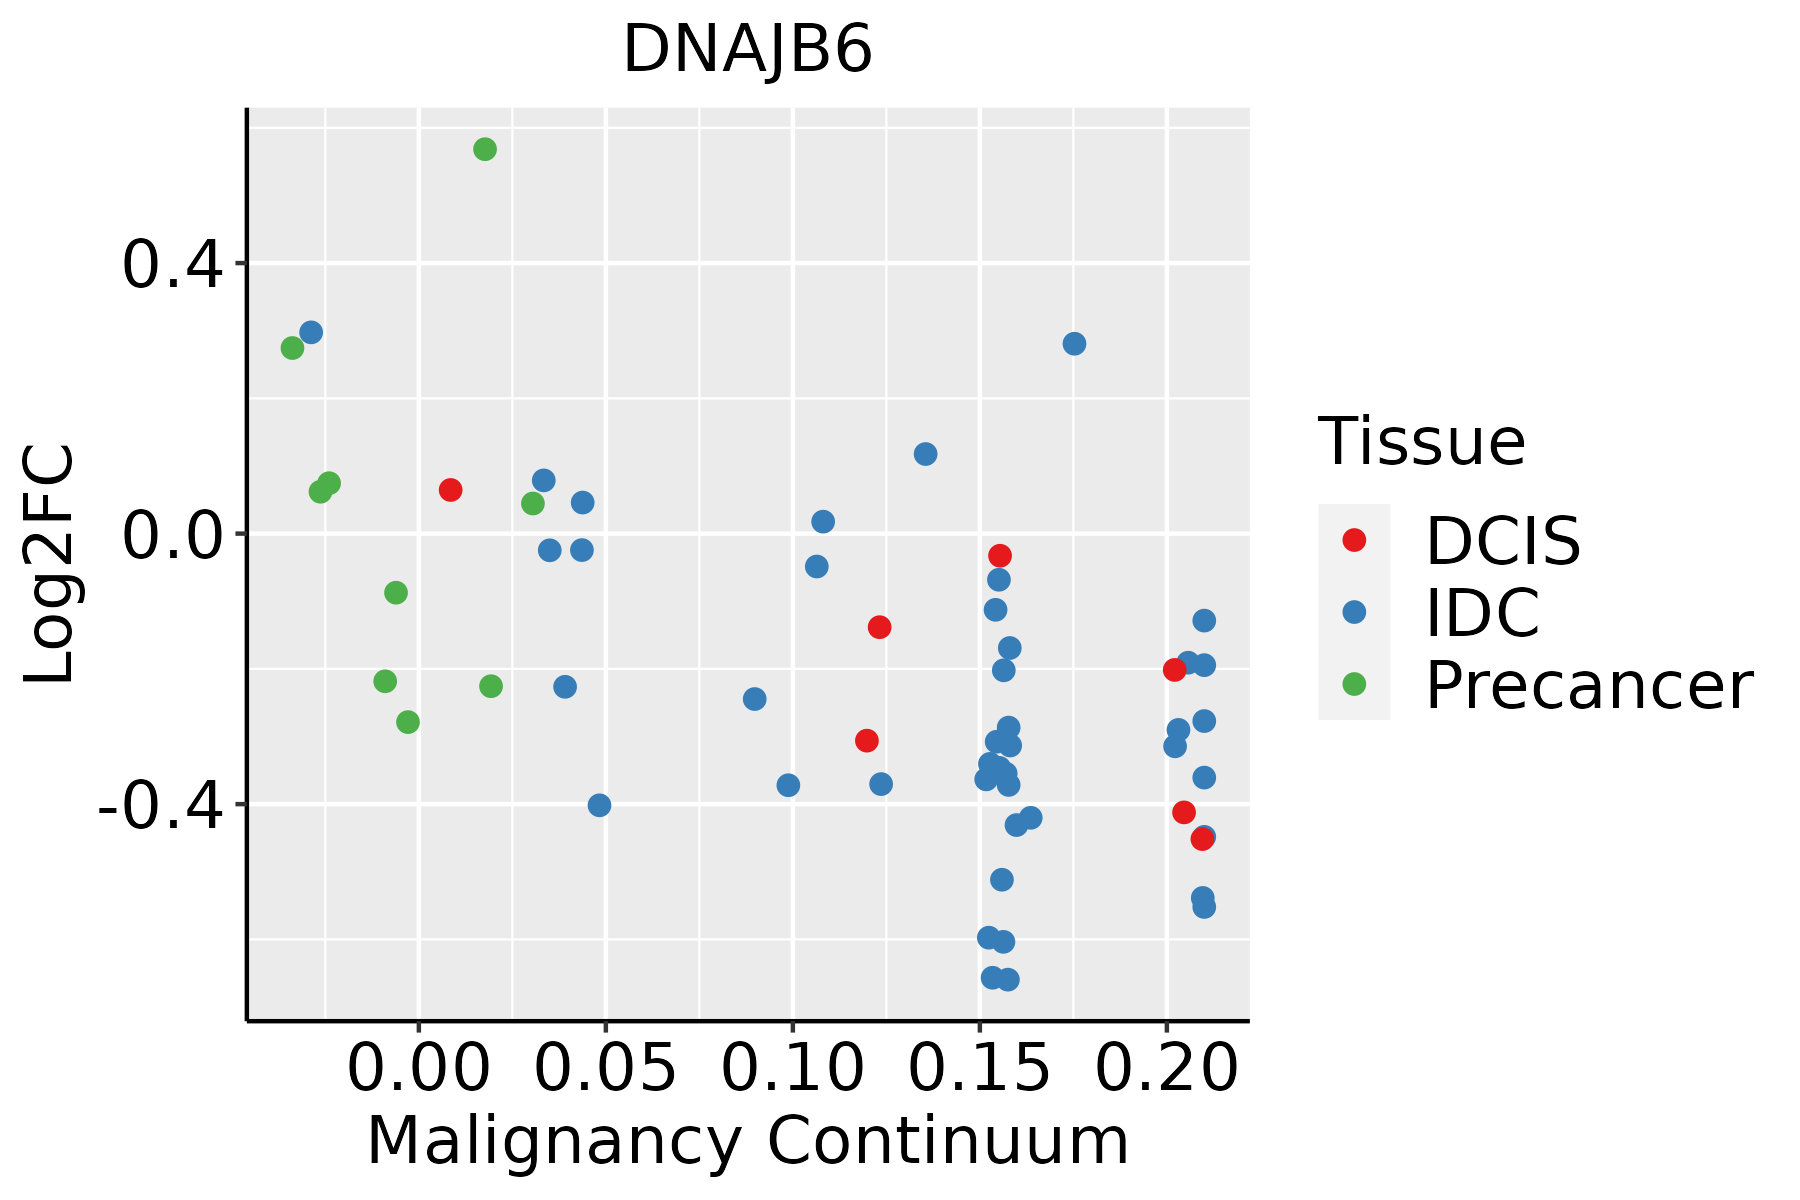
IDC: Invasive ductal carcinoma
DCIS: Ductal carcinoma in situ
Precancer(BRCA1-mut): Precancerous lesion from BRCA1 mutation carriers
EndometriumThe image shows the transcriptomic changes along malignancy continuum.log2FC in expression of this searched gene in stem-like cells from each diseased tissue sample relative to stem-like cells in normal samples in each tissue plotted against the malignancy continuum. Samples are colored based on if they are from different disease stage.AEH: Atypical endometrial hyperplasia
EEC: Endometrioid Cancer
EsophagusThe image shows the transcriptomic changes along malignancy continuum.log2FC in expression of this searched gene in stem-like cells from each diseased tissue sample relative to stem-like cells in normal samples in each tissue plotted against the malignancy continuum. Samples are colored based on if they are from different disease stage.ESCC: Esophageal squamous cell carcinoma
HGIN: High-grade intraepithelial neoplasias
LGIN: Low-grade intraepithelial neoplasias
LiverThe image shows the transcriptomic changes along malignancy continuum.log2FC in expression of this searched gene in stem-like cells from each diseased tissue sample relative to stem-like cells in normal samples in each tissue plotted against the malignancy continuum. Samples are colored based on if they are from different disease stage.
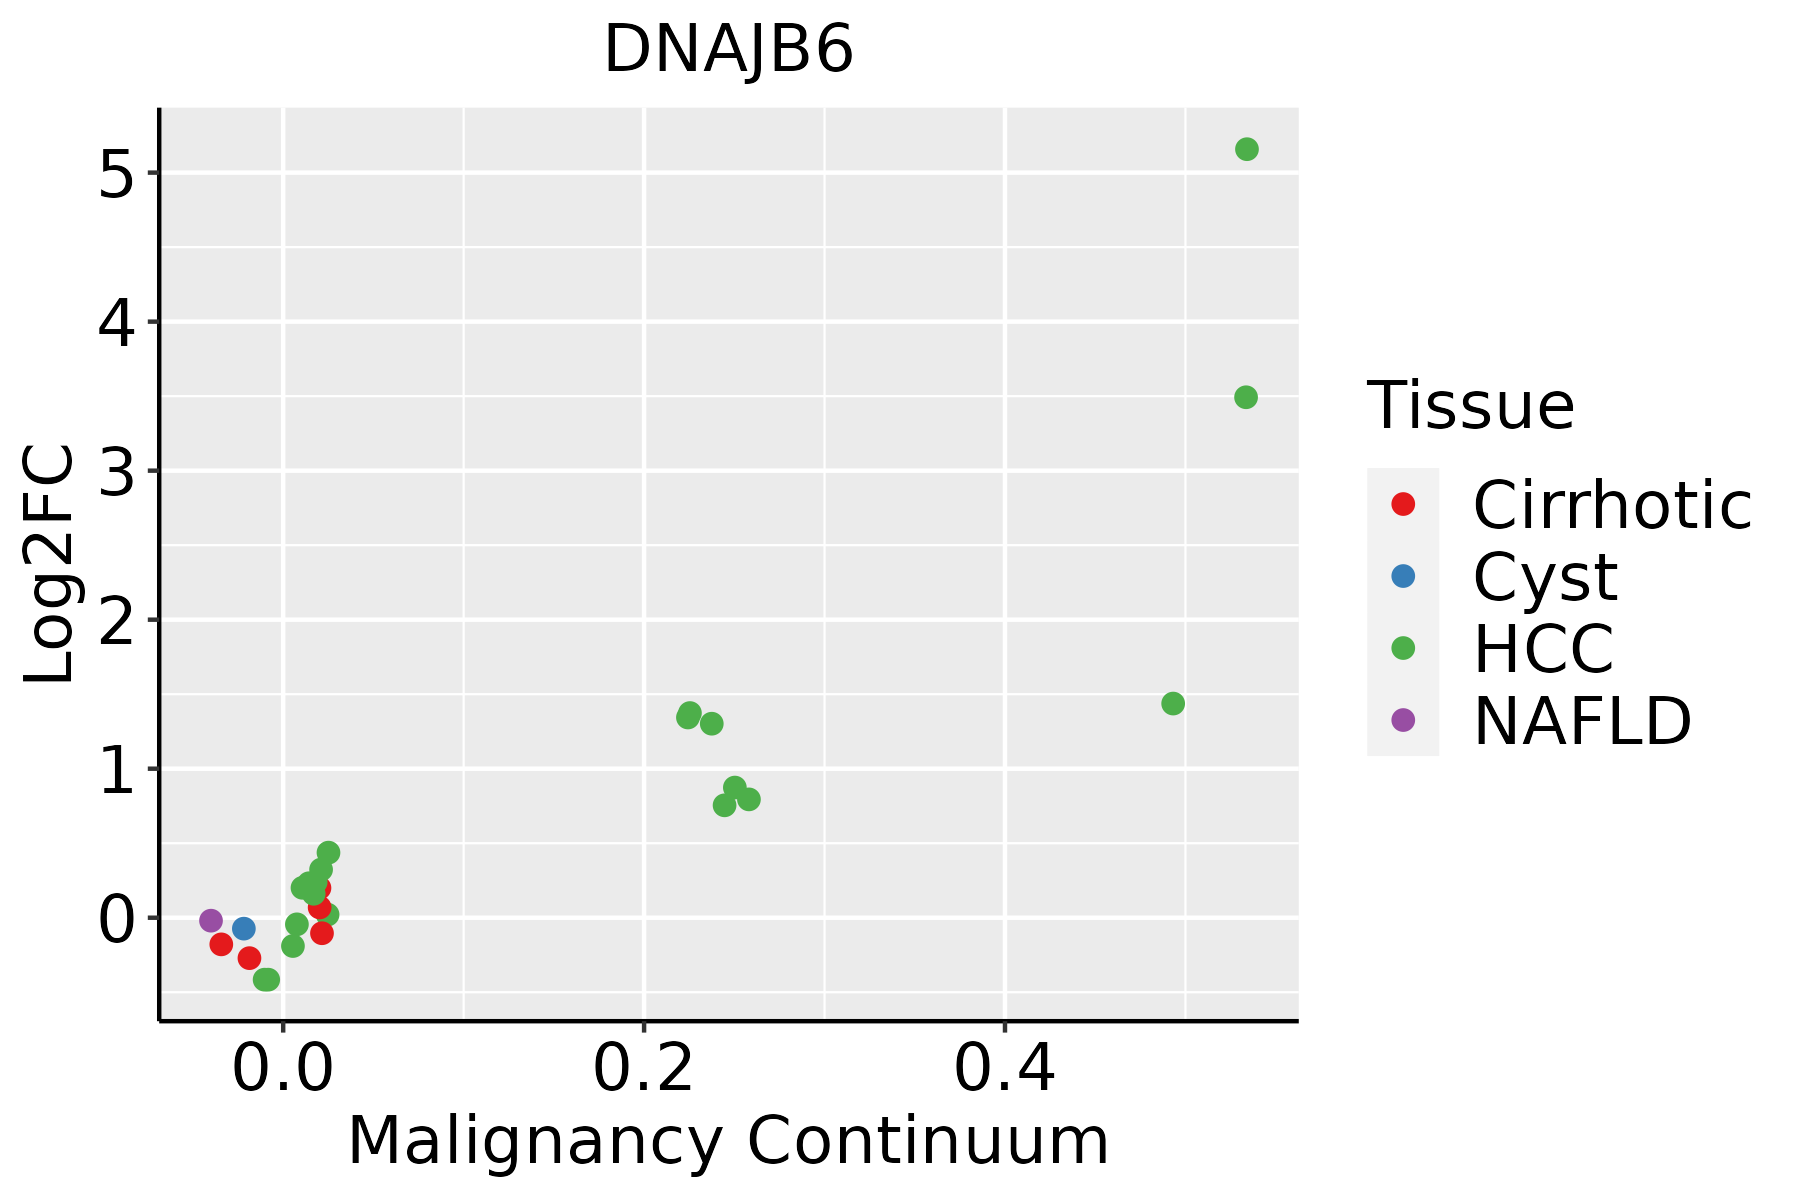
HCC: Hepatocellular carcinoma
NAFLD: Non-alcoholic fatty liver disease
LungThe image shows the transcriptomic changes along malignancy continuum.log2FC in expression of this searched gene in stem-like cells from each diseased tissue sample relative to stem-like cells in normal samples in each tissue plotted against the malignancy continuum. Samples are colored based on if they are from different disease stage.
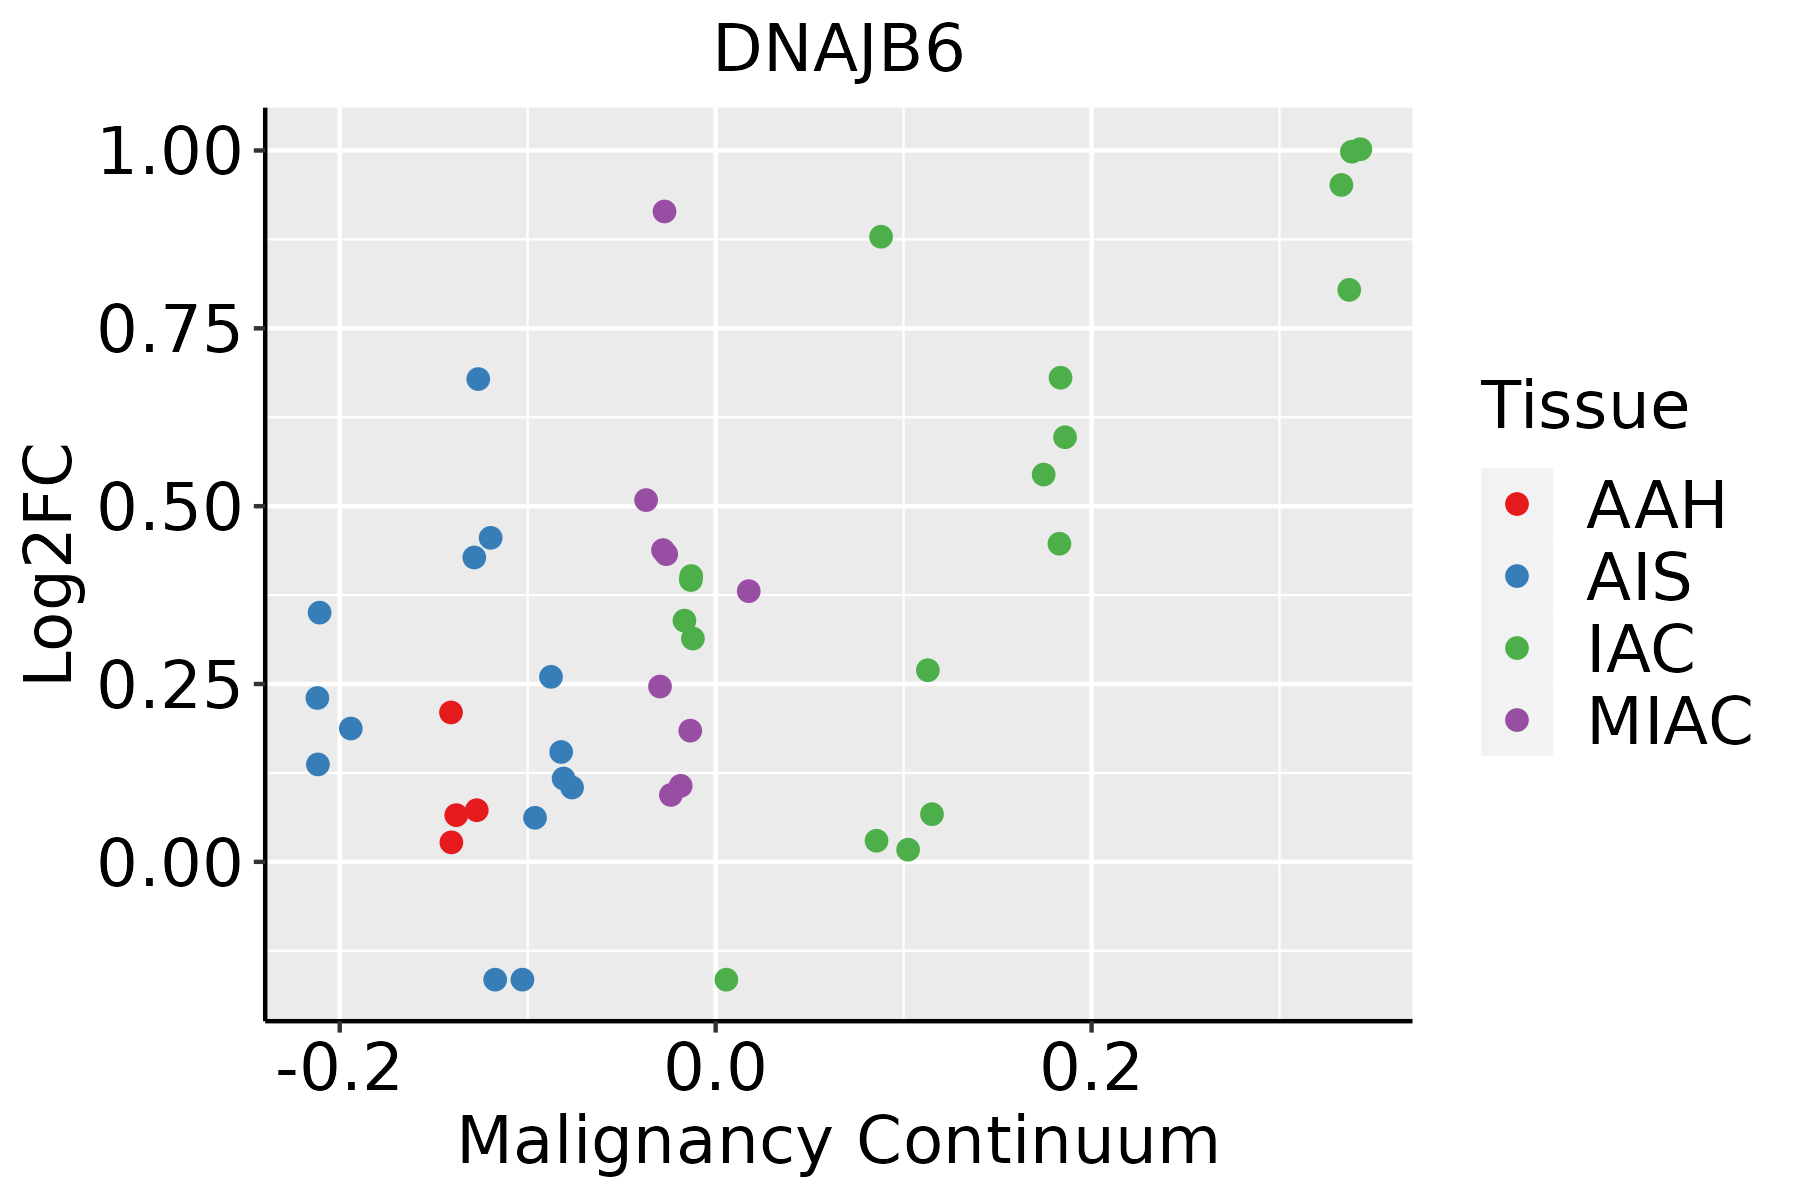
AAH: Atypical adenomatous hyperplasia
AIS: Adenocarcinoma in situ
IAC: Invasive lung adenocarcinoma
MIA: Minimally invasive adenocarcinoma
Oral CavityThe image shows the transcriptomic changes along malignancy continuum.log2FC in expression of this searched gene in stem-like cells from each diseased tissue sample relative to stem-like cells in normal samples in each tissue plotted against the malignancy continuum. Samples are colored based on if they are from different disease stage.
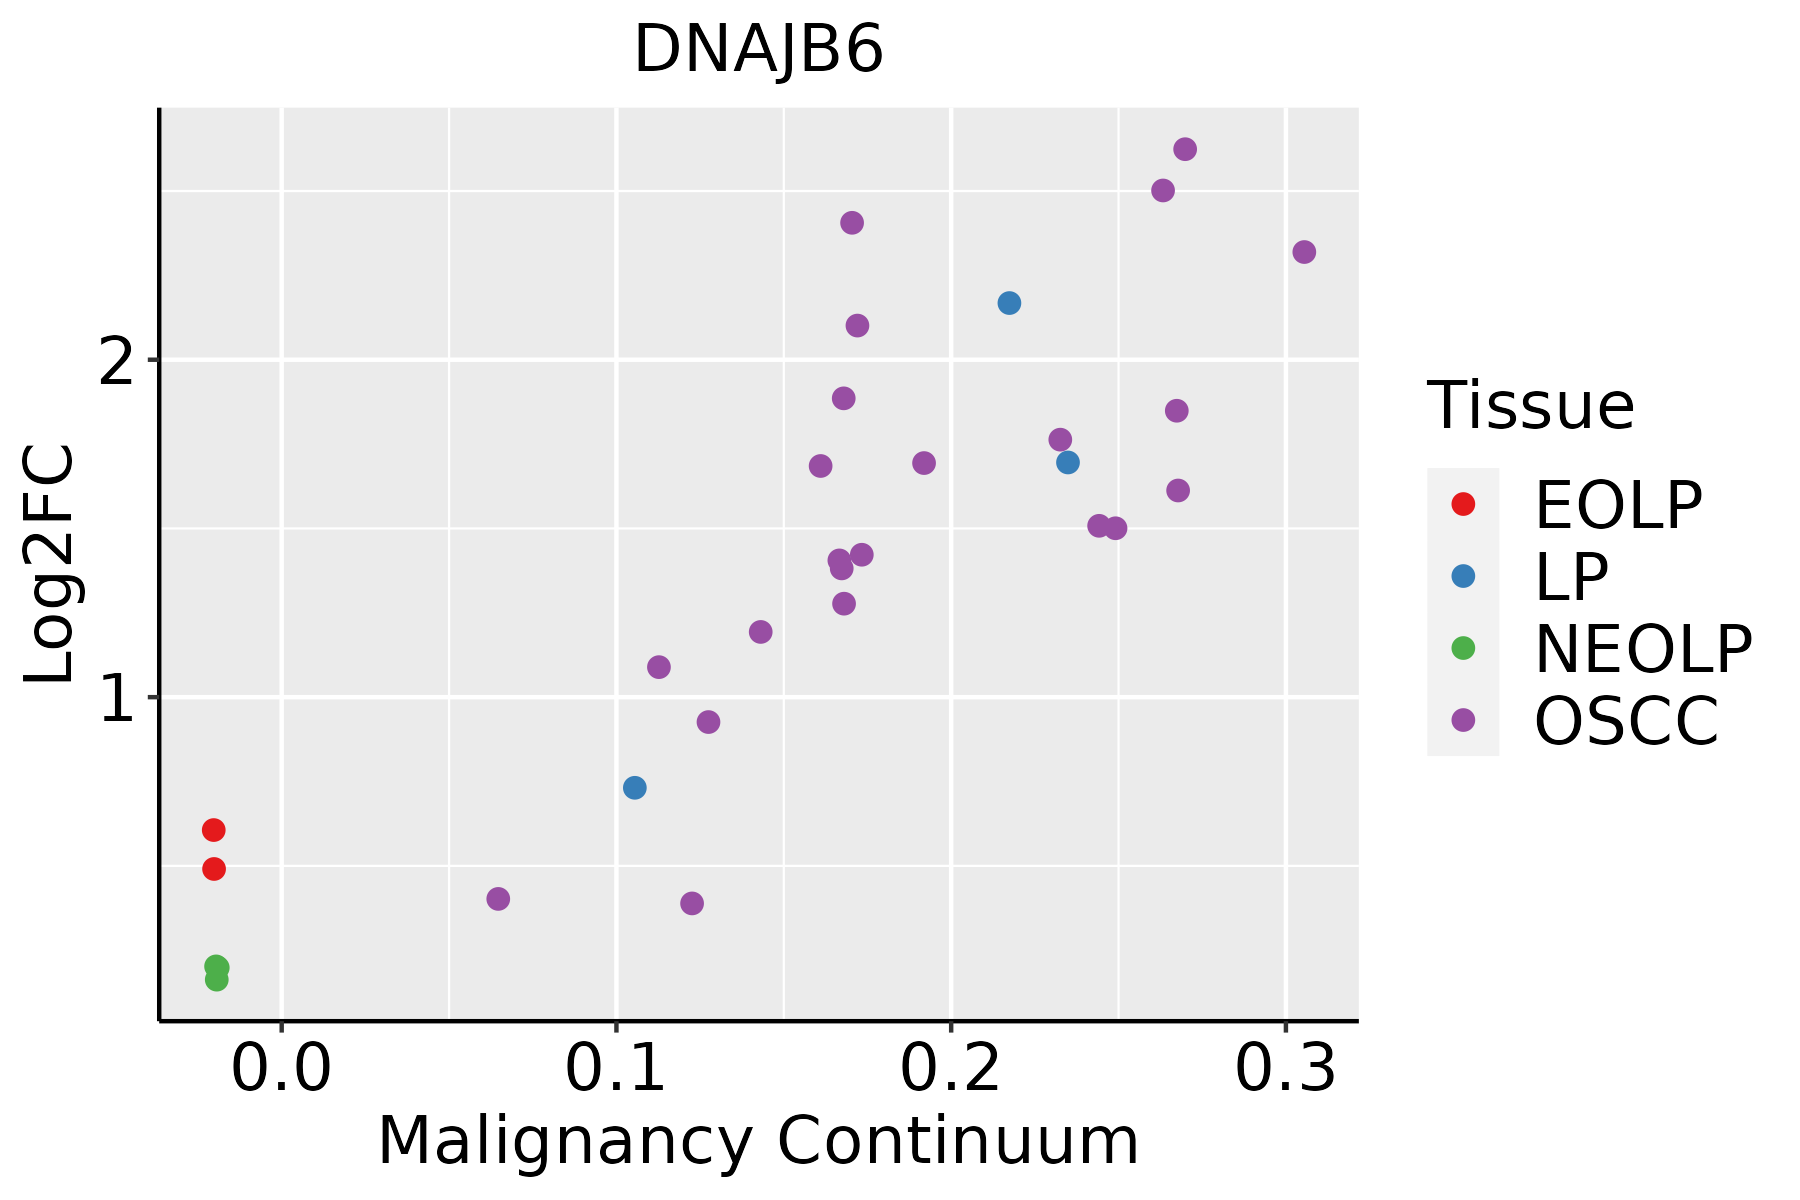
EOLP: Erosive Oral lichen planus
LP: leukoplakia
NEOLP: Non-erosive oral lichen planus
OSCC: Oral squamous cell carcinoma
ProstateThe image shows the transcriptomic changes along malignancy continuum.log2FC in expression of this searched gene in stem-like cells from each diseased tissue sample relative to stem-like cells in normal samples in each tissue plotted against the malignancy continuum. Samples are colored based on if they are from different disease stage.
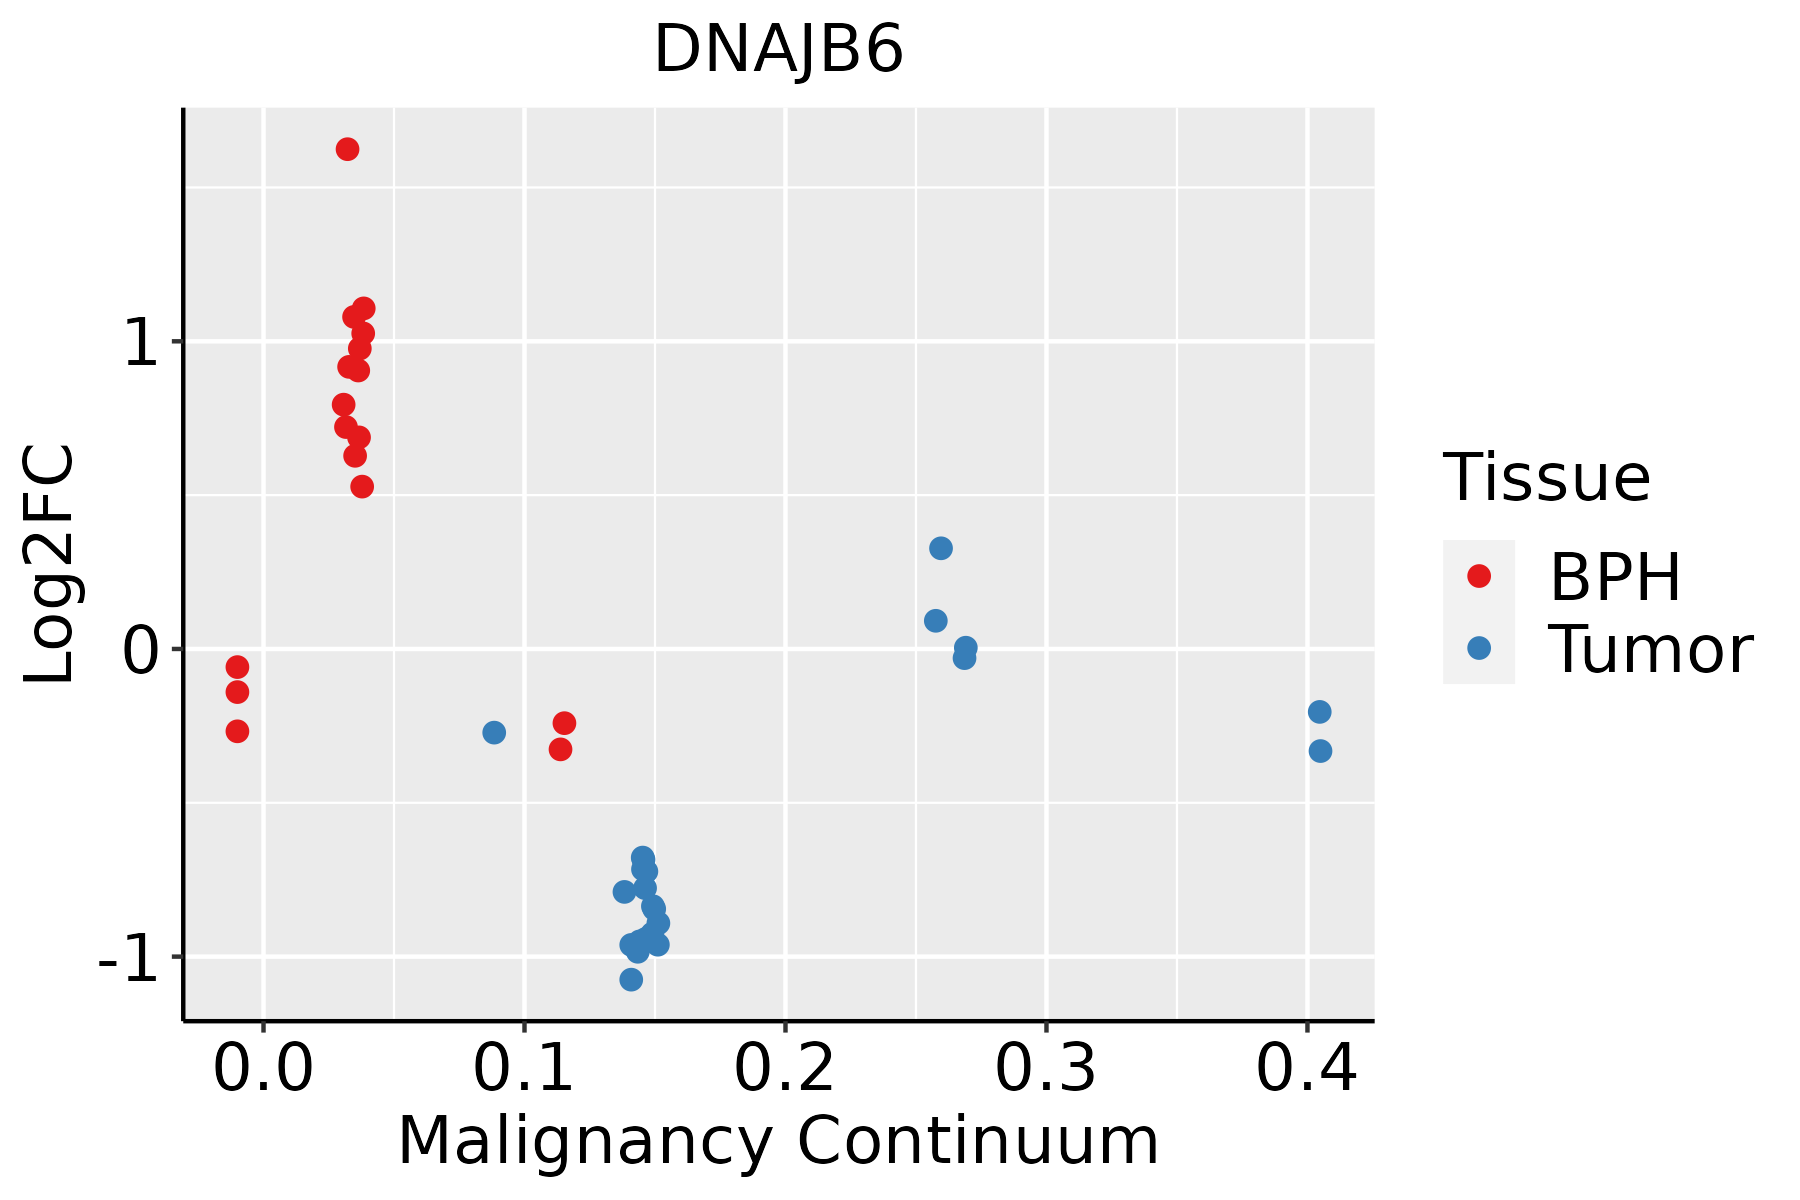
BPH: Benign Prostatic Hyperplasia
SkinThe image shows the transcriptomic changes along malignancy continuum.log2FC in expression of this searched gene in stem-like cells from each diseased tissue sample relative to stem-like cells in normal samples in each tissue plotted against the malignancy continuum. Samples are colored based on if they are from different disease stage.AK: Actinic keratosis
cSCC: Cutaneous squamous cell carcinoma
SCCIS:squamous cell carcinoma in situ
ThyroidThe image shows the transcriptomic changes along malignancy continuum.log2FC in expression of this searched gene in stem-like cells from each diseased tissue sample relative to stem-like cells in normal samples in each tissue plotted against the malignancy continuum. Samples are colored based on if they are from different disease stage.
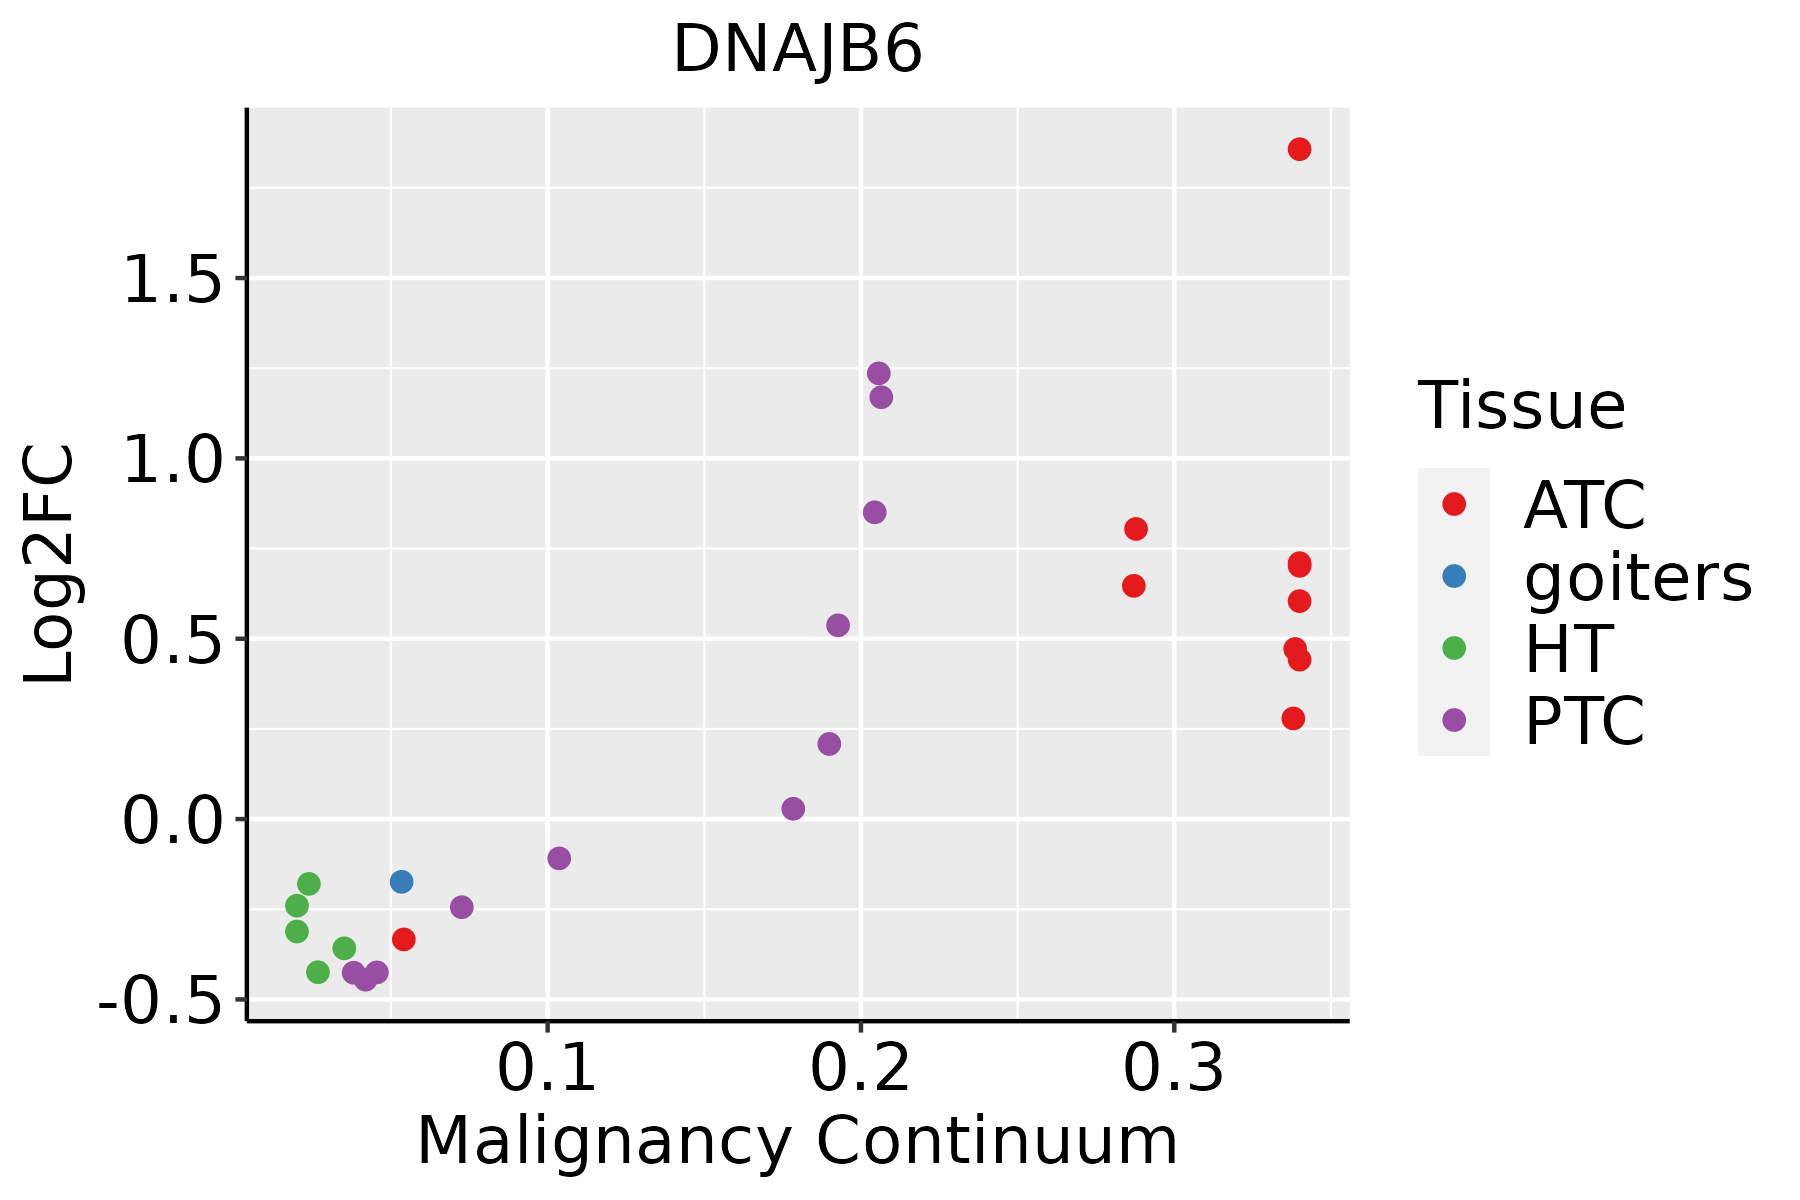
ATC: Anaplastic thyroid cancer
HT: Hashimoto's thyroiditis
PTC: Papillary thyroid cancer
∗log2FC in expression of this searched gene in stem-like cells from each diseased tissue sample relative to stem-like cells in normal samples in each tissue plotted against the malignancy continuum. Samples are colored based on if they are from different disease stage.

Top

Malignant transformation related pathway analysis

check buttonFind out the enriched GO biological processes and KEGG pathways involved in transition from healthy to precancer to cancer
check button Figure of enriched GO biological processes.
TissueDisease StageEnriched GO biological Processes
ColorectumADGO analysis - Figure of enriched GO biological processes: Top 15 enriched GO BP terms are showed in the bar plot of each disease state in each tissue. Each row represents a significant GO biological process which is colored according to the -log10(p.adjust).
ColorectumSERGO analysis - Figure of enriched GO biological processes: Top 15 enriched GO BP terms are showed in the bar plot of each disease state in each tissue. Each row represents a significant GO biological process which is colored according to the -log10(p.adjust).
ColorectumMSSGO analysis - Figure of enriched GO biological processes: Top 15 enriched GO BP terms are showed in the bar plot of each disease state in each tissue. Each row represents a significant GO biological process which is colored according to the -log10(p.adjust).
ColorectumMSI-HGO analysis - Figure of enriched GO biological processes: Top 15 enriched GO BP terms are showed in the bar plot of each disease state in each tissue. Each row represents a significant GO biological process which is colored according to the -log10(p.adjust).
ColorectumFAPGO analysis - Figure of enriched GO biological processes: Top 15 enriched GO BP terms are showed in the bar plot of each disease state in each tissue. Each row represents a significant GO biological process which is colored according to the -log10(p.adjust).
∗Top 15 enriched GO BP terms are showed in the bar plot of each disease state in each tissue. Each row represents a significant GO biological process which is colored according to the -log10(p.adjust).
Page: 1 2 3 4 5 6 7 8 9 

check button Enriched GO biological processes.
GO IDTissueDisease StageDescriptionGene RatioBg Ratiopvaluep.adjustCount
GO:00525479BreastPrecancerregulation of peptidase activity71/1080461/187232.72e-146.94e-1271
GO:00525489BreastPrecancerregulation of endopeptidase activity67/1080432/187231.06e-132.36e-1167
GO:00064578BreastPrecancerprotein folding43/1080212/187233.48e-137.45e-1143
GO:20001169BreastPrecancerregulation of cysteine-type endopeptidase activity43/1080235/187231.30e-111.83e-0943
GO:00432819BreastPrecancerregulation of cysteine-type endopeptidase activity involved in apoptotic process40/1080209/187231.59e-112.07e-0940
GO:00458619BreastPrecancernegative regulation of proteolysis50/1080351/187232.99e-092.39e-0750
GO:00610778BreastPrecancerchaperone-mediated protein folding19/108067/187234.22e-093.28e-0719
GO:00513468BreastPrecancernegative regulation of hydrolase activity50/1080379/187233.85e-082.34e-0650
GO:00104668BreastPrecancernegative regulation of peptidase activity38/1080262/187231.46e-077.82e-0638
GO:00109519BreastPrecancernegative regulation of endopeptidase activity37/1080252/187231.55e-078.05e-0637
GO:20001179BreastPrecancernegative regulation of cysteine-type endopeptidase activity19/108086/187233.36e-071.58e-0519
GO:00431548BreastPrecancernegative regulation of cysteine-type endopeptidase activity involved in apoptotic process17/108078/187231.69e-066.08e-0517
GO:00092667BreastPrecancerresponse to temperature stimulus27/1080178/187233.85e-061.21e-0427
GO:00346059BreastPrecancercellular response to heat15/108069/187237.08e-061.95e-0415
GO:00094088BreastPrecancerresponse to heat18/1080110/187235.57e-051.15e-0318
GO:0045104BreastPrecancerintermediate filament cytoskeleton organization11/108051/187231.26e-042.22e-0311
GO:0045103BreastPrecancerintermediate filament-based process11/108052/187231.52e-042.60e-0311
GO:00018927BreastPrecancerembryonic placenta development14/108082/187232.30e-043.48e-0314
GO:00486087BreastPrecancerreproductive structure development43/1080424/187232.36e-043.56e-0343
GO:00614587BreastPrecancerreproductive system development43/1080427/187232.75e-044.00e-0343
Page: 1 2 3 4 5 6 7 8 9 10 11 12 13 14 15 16 17 18 19 20 21 22 23 24 25 26 27 28 

check button Enriched KEGG pathways.
Pathway IDTissueDisease StageDescriptionGene RatioBg Ratiopvaluep.adjustqvalueCount
Page: 1 

Top

Cell-cell communication analysis

check buttonIdentification of potential cell-cell interactions between two cell types and their ligand-receptor pairs for different disease states
LigandReceptorLRpairPathwayTissueDisease Stage
Page: 1 

Top

Single-cell gene regulatory network inference analysis

check buttonFind out the significant the regulons (TFs) and the target genes of each regulon across cell types for different disease states
TFCell TypeTissueDisease StageTarget GeneRSSRegulon Activity
∗The dot plots of a searched regulon are shown for all cell subpopulations in each disease state of each tissue based on the regulon specific score inferred using pySCENIC and by calculating the average expression.
Page: 1 

Top

Somatic mutation of malignant transformation related genes

check buttonAnnotation of somatic variants for genes involved in malignant transformation
Hugo SymbolVariant ClassVariant ClassificationdbSNP RSHGVScHGVSpHGVSp ShortSWISSPROTBIOTYPESIFTPolyPhenTumor Sample BarcodeTissueHistologySexAgeStageTherapy TypesDrugsOutcome
DNAJB6SNVMissense_Mutationc.626N>Cp.Val209Alap.V209AO75190protein_codingdeleterious(0)benign(0.079)TCGA-AO-A128-01Breastbreast invasive carcinomaFemale<65I/IIChemotherapydoxorubicinSD
DNAJB6insertionNonsense_Mutationnovelc.216_217insAACATGGTCATTGTTCTTGCCATGGCACTGGCTACCTGAAACTGCp.Gly72_Leu73insAsnMetValIleValLeuAlaMetAlaLeuAlaThrTerAsnCysp.G72_L73insNMVIVLAMALAT*NCO75190protein_codingTCGA-BH-A0H7-01Breastbreast invasive carcinomaFemale>=65III/IVChemotherapydoxorubicinSD
DNAJB6deletionFrame_Shift_Delnovelc.418delNp.Phe141SerfsTer27p.F141Sfs*27O75190protein_codingTCGA-EW-A2FV-01Breastbreast invasive carcinomaFemale<65III/IVChemotherapydocetaxelSD
DNAJB6SNVMissense_Mutationc.337G>Cp.Asp113Hisp.D113HO75190protein_codingtolerated(0.37)possibly_damaging(0.65)TCGA-C5-A1MK-01Cervixcervical & endocervical cancerFemale>=65III/IVChemotherapycarboplatinPD
DNAJB6SNVMissense_Mutationnovelc.954N>Cp.Lys318Asnp.K318NO75190protein_codingdeleterious(0.01)possibly_damaging(0.666)TCGA-EA-A3HU-01Cervixcervical & endocervical cancerFemale<65I/IIUnknownUnknownSD
DNAJB6SNVMissense_Mutationnovelc.479N>Ap.Gly160Glup.G160EO75190protein_codingtolerated(0.05)probably_damaging(0.999)TCGA-MA-AA42-01Cervixcervical & endocervical cancerFemale>=65I/IIUnknownUnknownSD
DNAJB6SNVMissense_Mutationc.569N>Tp.Ser190Leup.S190LO75190protein_codingdeleterious(0.02)probably_damaging(0.992)TCGA-A6-6781-01Colorectumcolon adenocarcinomaMale<65III/IVChemotherapyoxaliplatinSD
DNAJB6SNVMissense_Mutationc.70N>Tp.Arg24Trpp.R24WO75190protein_codingdeleterious(0)probably_damaging(0.966)TCGA-CK-4947-01Colorectumcolon adenocarcinomaFemale<65III/IVOther, specify in notesfolinicSD
DNAJB6SNVMissense_Mutationc.851N>Tp.Asp284Valp.D284VO75190protein_codingdeleterious(0.02)benign(0.044)TCGA-CK-4951-01Colorectumcolon adenocarcinomaFemale>=65I/IIUnknownUnknownPD
DNAJB6SNVMissense_Mutationnovelc.567A>Cp.Lys189Asnp.K189NO75190protein_codingtolerated(0.09)possibly_damaging(0.558)TCGA-F5-6814-01Colorectumrectum adenocarcinomaMale<65I/IIUnknownUnknownSD
Page: 1 2 3 

Top

Related drugs of malignant transformation related genes

check buttonIdentification of chemicals and drugs interact with genes involved in malignant transfromation
(DGIdb 4.0)
Entrez IDSymbolCategoryInteraction TypesDrug Claim NameDrug NamePMIDs
Page: 1