
|
|||||
|
 | |
| |
| |
| |
| |
| |
|
Gene: DNAJB5 |
Gene summary for DNAJB5 |
| Gene information | Species | Human | Gene symbol | DNAJB5 | Gene ID | 25822 |
| Gene name | DnaJ heat shock protein family (Hsp40) member B5 | |
| Gene Alias | Hsc40 | |
| Cytomap | 9p13.3 | |
| Gene Type | protein-coding | GO ID | GO:0006457 | UniProtAcc | O75953 |
Top |
Malignant transformation analysis |
| Identification of the aberrant gene expression in precancerous and cancerous lesions by comparing the gene expression of stem-like cells in diseased tissues with normal stem cells |
| Entrez ID | Symbol | Replicates | Species | Organ | Tissue | Adj P-value | Log2FC | Malignancy |
| 25822 | DNAJB5 | P4T-E | Human | Esophagus | ESCC | 2.51e-07 | 8.88e-02 | 0.1323 |
| 25822 | DNAJB5 | P9T-E | Human | Esophagus | ESCC | 1.22e-04 | 6.74e-02 | 0.1131 |
| 25822 | DNAJB5 | P11T-E | Human | Esophagus | ESCC | 1.21e-12 | 3.09e-01 | 0.1426 |
| 25822 | DNAJB5 | P12T-E | Human | Esophagus | ESCC | 2.13e-02 | 1.08e-01 | 0.1122 |
| 25822 | DNAJB5 | P15T-E | Human | Esophagus | ESCC | 2.22e-07 | 7.84e-02 | 0.1149 |
| 25822 | DNAJB5 | P21T-E | Human | Esophagus | ESCC | 8.73e-03 | 3.26e-02 | 0.1617 |
| 25822 | DNAJB5 | P24T-E | Human | Esophagus | ESCC | 6.77e-05 | 9.28e-02 | 0.1287 |
| 25822 | DNAJB5 | P28T-E | Human | Esophagus | ESCC | 3.91e-08 | 2.15e-01 | 0.1149 |
| 25822 | DNAJB5 | P30T-E | Human | Esophagus | ESCC | 9.95e-03 | 1.35e-01 | 0.137 |
| 25822 | DNAJB5 | P31T-E | Human | Esophagus | ESCC | 1.04e-04 | 3.83e-02 | 0.1251 |
| 25822 | DNAJB5 | P32T-E | Human | Esophagus | ESCC | 1.56e-04 | 1.20e-01 | 0.1666 |
| 25822 | DNAJB5 | P36T-E | Human | Esophagus | ESCC | 2.37e-02 | 1.72e-01 | 0.1187 |
| 25822 | DNAJB5 | P37T-E | Human | Esophagus | ESCC | 5.60e-07 | 1.33e-01 | 0.1371 |
| 25822 | DNAJB5 | P38T-E | Human | Esophagus | ESCC | 1.06e-02 | 1.19e-01 | 0.127 |
| 25822 | DNAJB5 | P47T-E | Human | Esophagus | ESCC | 6.86e-04 | 1.47e-01 | 0.1067 |
| 25822 | DNAJB5 | P49T-E | Human | Esophagus | ESCC | 7.41e-03 | 4.36e-01 | 0.1768 |
| 25822 | DNAJB5 | P52T-E | Human | Esophagus | ESCC | 6.97e-04 | 5.17e-02 | 0.1555 |
| 25822 | DNAJB5 | P61T-E | Human | Esophagus | ESCC | 3.89e-05 | 8.88e-02 | 0.099 |
| 25822 | DNAJB5 | P62T-E | Human | Esophagus | ESCC | 7.98e-06 | 1.24e-01 | 0.1302 |
| 25822 | DNAJB5 | P65T-E | Human | Esophagus | ESCC | 3.95e-02 | 2.70e-02 | 0.0978 |
| Page: 1 2 |
| Tissue | Expression Dynamics | Abbreviation |
| Esophagus | 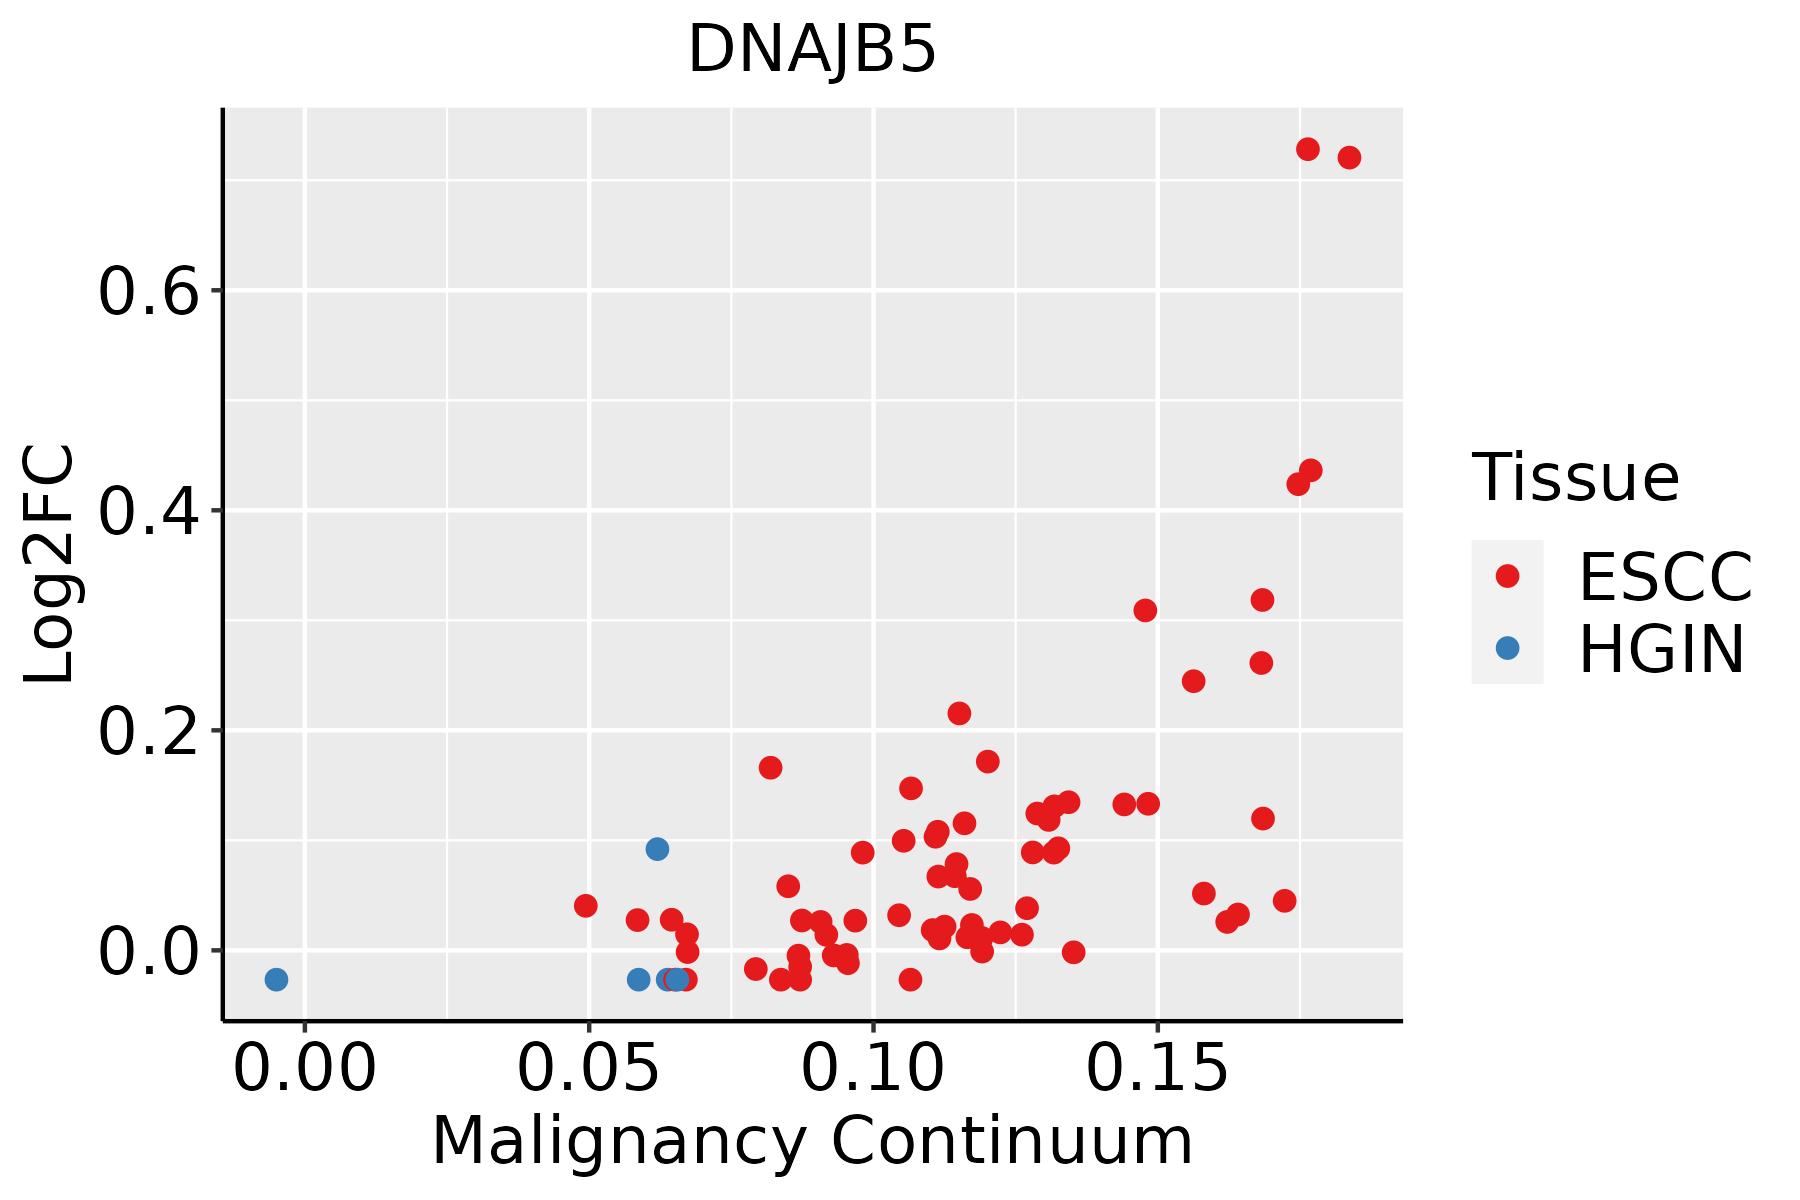 | ESCC: Esophageal squamous cell carcinoma |
| HGIN: High-grade intraepithelial neoplasias | ||
| LGIN: Low-grade intraepithelial neoplasias |
| ∗log2FC in expression of this searched gene in stem-like cells from each diseased tissue sample relative to stem-like cells in normal samples in each tissue plotted against the malignancy continuum. Samples are colored based on if they are from different disease stage. |
Top |
Malignant transformation related pathway analysis |
| Find out the enriched GO biological processes and KEGG pathways involved in transition from healthy to precancer to cancer |
| Tissue | Disease Stage | Enriched GO biological Processes |
| Colorectum | AD |  |
| Colorectum | SER |  |
| Colorectum | MSS |  |
| Colorectum | MSI-H |  |
| Colorectum | FAP |  |
| ∗Top 15 enriched GO BP terms are showed in the bar plot of each disease state in each tissue. Each row represents a significant GO biological process which is colored according to the -log10(p.adjust). |
| Page: 1 2 3 4 5 6 7 8 9 |
| GO ID | Tissue | Disease Stage | Description | Gene Ratio | Bg Ratio | pvalue | p.adjust | Count |
| GO:0006457110 | Esophagus | ESCC | protein folding | 163/8552 | 212/18723 | 1.13e-20 | 1.74e-18 | 163 |
| GO:0035966111 | Esophagus | ESCC | response to topologically incorrect protein | 125/8552 | 159/18723 | 1.44e-17 | 1.27e-15 | 125 |
| GO:0006986111 | Esophagus | ESCC | response to unfolded protein | 107/8552 | 137/18723 | 7.01e-15 | 3.87e-13 | 107 |
| GO:0061077110 | Esophagus | ESCC | chaperone-mediated protein folding | 56/8552 | 67/18723 | 1.52e-10 | 4.36e-09 | 56 |
| GO:0006458110 | Esophagus | ESCC | 'de novo' protein folding | 36/8552 | 43/18723 | 2.90e-07 | 4.20e-06 | 36 |
| GO:0051084110 | Esophagus | ESCC | 'de novo' posttranslational protein folding | 32/8552 | 39/18723 | 3.27e-06 | 3.65e-05 | 32 |
| GO:0051085110 | Esophagus | ESCC | chaperone cofactor-dependent protein refolding | 27/8552 | 34/18723 | 6.01e-05 | 4.62e-04 | 27 |
| Page: 1 |
| Pathway ID | Tissue | Disease Stage | Description | Gene Ratio | Bg Ratio | pvalue | p.adjust | qvalue | Count |
| Page: 1 |
Top |
Cell-cell communication analysis |
| Identification of potential cell-cell interactions between two cell types and their ligand-receptor pairs for different disease states |
| Ligand | Receptor | LRpair | Pathway | Tissue | Disease Stage |
| Page: 1 |
Top |
Single-cell gene regulatory network inference analysis |
| Find out the significant the regulons (TFs) and the target genes of each regulon across cell types for different disease states |
| TF | Cell Type | Tissue | Disease Stage | Target Gene | RSS | Regulon Activity |
| ∗The dot plots of a searched regulon are shown for all cell subpopulations in each disease state of each tissue based on the regulon specific score inferred using pySCENIC and by calculating the average expression. |
| Page: 1 |
Top |
Somatic mutation of malignant transformation related genes |
| Annotation of somatic variants for genes involved in malignant transformation |
| Hugo Symbol | Variant Class | Variant Classification | dbSNP RS | HGVSc | HGVSp | HGVSp Short | SWISSPROT | BIOTYPE | SIFT | PolyPhen | Tumor Sample Barcode | Tissue | Histology | Sex | Age | Stage | Therapy Types | Drugs | Outcome |
| DNAJB5 | SNV | Missense_Mutation | c.940N>A | p.Asp314Asn | p.D314N | O75953 | protein_coding | tolerated(0.1) | probably_damaging(0.95) | TCGA-AC-A23H-01 | Breast | breast invasive carcinoma | Female | >=65 | I/II | Unknown | Unknown | PD | |
| DNAJB5 | SNV | Missense_Mutation | c.673N>C | p.Phe225Leu | p.F225L | O75953 | protein_coding | tolerated(0.07) | possibly_damaging(0.492) | TCGA-C8-A26W-01 | Breast | breast invasive carcinoma | Female | <65 | I/II | Chemotherapy | doxorubicin | CR | |
| DNAJB5 | SNV | Missense_Mutation | c.1036G>A | p.Asp346Asn | p.D346N | O75953 | protein_coding | tolerated(0.18) | probably_damaging(0.999) | TCGA-D8-A1JN-01 | Breast | breast invasive carcinoma | Female | >=65 | III/IV | Hormone Therapy | anastrozolum | SD | |
| DNAJB5 | insertion | Nonsense_Mutation | novel | c.763_764insGAAAGAAGGCAGGAGCTGGGAGAGC | p.Phe255Ter | p.F255* | O75953 | protein_coding | TCGA-A2-A0CQ-01 | Breast | breast invasive carcinoma | Female | <65 | I/II | Chemotherapy | adriamycin | SD | ||
| DNAJB5 | insertion | Frame_Shift_Ins | novel | c.765_766insCCTT | p.Gly256ProfsTer11 | p.G256Pfs*11 | O75953 | protein_coding | TCGA-A2-A0CQ-01 | Breast | breast invasive carcinoma | Female | <65 | I/II | Chemotherapy | adriamycin | SD | ||
| DNAJB5 | insertion | Frame_Shift_Ins | novel | c.1185_1186insCCCCTCCTGTGCATGAAGGCTGCCTCCAGGAATCTGAGCCCCTTAG | p.Thr396ProfsTer28 | p.T396Pfs*28 | O75953 | protein_coding | TCGA-A8-A06P-01 | Breast | breast invasive carcinoma | Female | <65 | III/IV | Unspecific | SD | |||
| DNAJB5 | deletion | Frame_Shift_Del | novel | c.970delN | p.Ile324SerfsTer4 | p.I324Sfs*4 | O75953 | protein_coding | TCGA-D8-A27V-01 | Breast | breast invasive carcinoma | Female | <65 | I/II | Hormone Therapy | tamoxiphen | SD | ||
| DNAJB5 | insertion | In_Frame_Ins | novel | c.511_512insGAGCTTCCC | p.Asp171delinsGlyAlaSerHis | p.D171delinsGASH | O75953 | protein_coding | TCGA-E2-A14N-01 | Breast | breast invasive carcinoma | Female | <65 | I/II | Chemotherapy | cyclophosphamide | SD | ||
| DNAJB5 | insertion | Nonsense_Mutation | novel | c.513_514insACTCCTGGGGAGAAGACTTCTTAG | p.Asp171_Pro172insThrProGlyGluLysThrSerTer | p.D171_P172insTPGEKTS* | O75953 | protein_coding | TCGA-E2-A14N-01 | Breast | breast invasive carcinoma | Female | <65 | I/II | Chemotherapy | cyclophosphamide | SD | ||
| DNAJB5 | SNV | Missense_Mutation | novel | c.991N>T | p.Arg331Cys | p.R331C | O75953 | protein_coding | deleterious(0) | probably_damaging(0.977) | TCGA-2W-A8YY-01 | Cervix | cervical & endocervical cancer | Female | <65 | I/II | Chemotherapy | cisplatin | CR |
| Page: 1 2 3 4 5 6 7 |
Top |
Related drugs of malignant transformation related genes |
| Identification of chemicals and drugs interact with genes involved in malignant transfromation |
| (DGIdb 4.0) |
| Entrez ID | Symbol | Category | Interaction Types | Drug Claim Name | Drug Name | PMIDs |
| Page: 1 |

Copyright 2023-Present -The University of Texas Health Science Center at Houston |