
|
|||||
|
 | |
| |
| |
| |
| |
| |
|
Gene: DNAJB4 |
Gene summary for DNAJB4 |
| Gene information | Species | Human | Gene symbol | DNAJB4 | Gene ID | 11080 |
| Gene name | DnaJ heat shock protein family (Hsp40) member B4 | |
| Gene Alias | DNAJW | |
| Cytomap | 1p31.1 | |
| Gene Type | protein-coding | GO ID | GO:0006457 | UniProtAcc | Q9UDY4 |
Top |
Malignant transformation analysis |
| Identification of the aberrant gene expression in precancerous and cancerous lesions by comparing the gene expression of stem-like cells in diseased tissues with normal stem cells |
| Entrez ID | Symbol | Replicates | Species | Organ | Tissue | Adj P-value | Log2FC | Malignancy |
| 11080 | DNAJB4 | LZE4T | Human | Esophagus | ESCC | 5.08e-37 | 2.45e+00 | 0.0811 |
| 11080 | DNAJB4 | LZE7T | Human | Esophagus | ESCC | 1.86e-04 | 1.25e-01 | 0.0667 |
| 11080 | DNAJB4 | LZE8T | Human | Esophagus | ESCC | 4.33e-04 | 6.24e-02 | 0.067 |
| 11080 | DNAJB4 | LZE20T | Human | Esophagus | ESCC | 2.37e-10 | 9.65e-01 | 0.0662 |
| 11080 | DNAJB4 | LZE22T | Human | Esophagus | ESCC | 1.86e-08 | 1.23e+00 | 0.068 |
| 11080 | DNAJB4 | LZE24T | Human | Esophagus | ESCC | 5.13e-04 | 8.00e-02 | 0.0596 |
| 11080 | DNAJB4 | LZE21T | Human | Esophagus | ESCC | 1.72e-02 | 1.36e+00 | 0.0655 |
| 11080 | DNAJB4 | P1T-E | Human | Esophagus | ESCC | 2.80e-06 | 7.79e-01 | 0.0875 |
| 11080 | DNAJB4 | P2T-E | Human | Esophagus | ESCC | 2.20e-49 | 1.14e+00 | 0.1177 |
| 11080 | DNAJB4 | P4T-E | Human | Esophagus | ESCC | 1.53e-48 | 1.70e+00 | 0.1323 |
| 11080 | DNAJB4 | P5T-E | Human | Esophagus | ESCC | 3.13e-69 | 1.80e+00 | 0.1327 |
| 11080 | DNAJB4 | P8T-E | Human | Esophagus | ESCC | 3.41e-18 | 2.67e-01 | 0.0889 |
| 11080 | DNAJB4 | P9T-E | Human | Esophagus | ESCC | 8.57e-20 | 8.09e-01 | 0.1131 |
| 11080 | DNAJB4 | P10T-E | Human | Esophagus | ESCC | 7.59e-19 | 4.49e-01 | 0.116 |
| 11080 | DNAJB4 | P11T-E | Human | Esophagus | ESCC | 4.13e-32 | 2.35e+00 | 0.1426 |
| 11080 | DNAJB4 | P12T-E | Human | Esophagus | ESCC | 5.19e-30 | 1.03e+00 | 0.1122 |
| 11080 | DNAJB4 | P15T-E | Human | Esophagus | ESCC | 6.22e-44 | 1.59e+00 | 0.1149 |
| 11080 | DNAJB4 | P16T-E | Human | Esophagus | ESCC | 6.04e-35 | 9.46e-01 | 0.1153 |
| 11080 | DNAJB4 | P19T-E | Human | Esophagus | ESCC | 5.43e-03 | 6.86e-01 | 0.1662 |
| 11080 | DNAJB4 | P20T-E | Human | Esophagus | ESCC | 9.89e-12 | 9.34e-01 | 0.1124 |
| Page: 1 2 3 4 5 6 |
| Tissue | Expression Dynamics | Abbreviation |
| Esophagus | 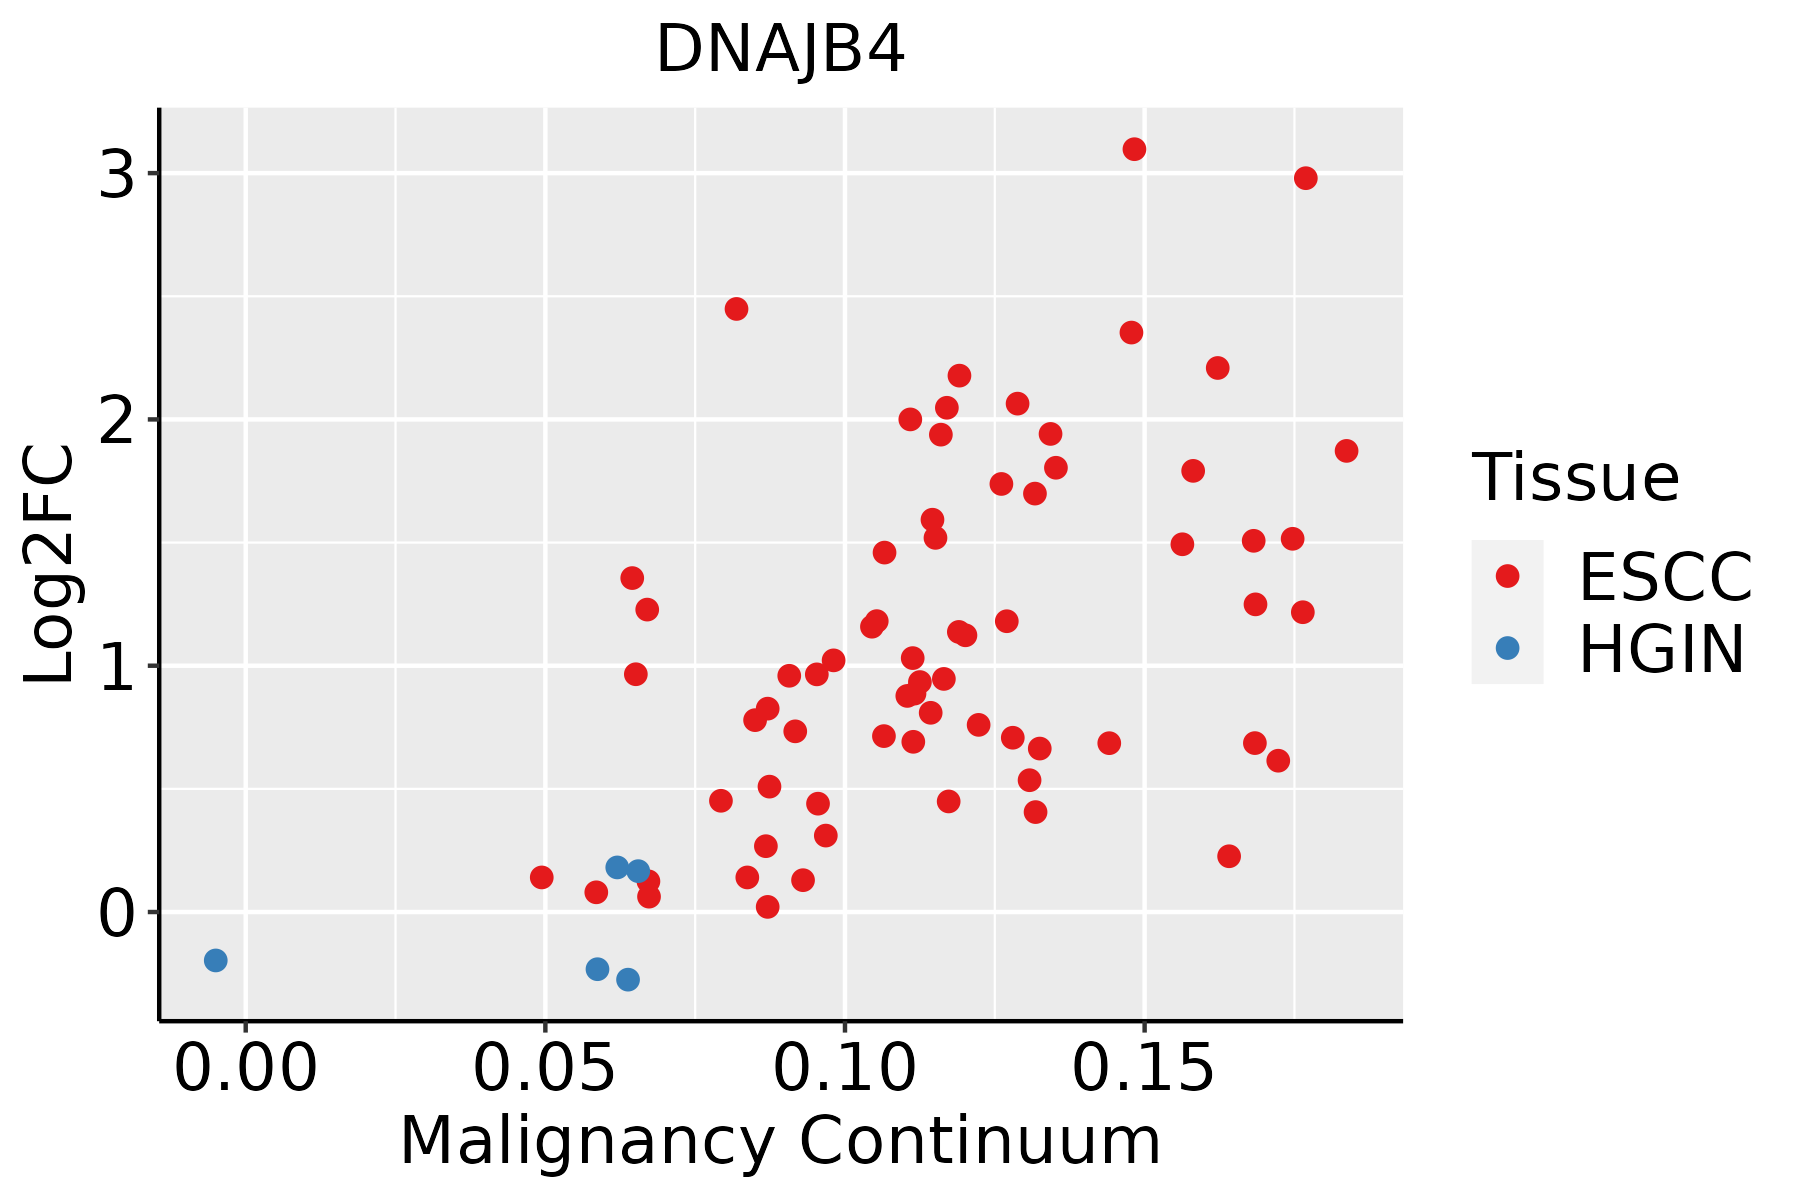 | ESCC: Esophageal squamous cell carcinoma |
| HGIN: High-grade intraepithelial neoplasias | ||
| LGIN: Low-grade intraepithelial neoplasias | ||
| Liver |  | HCC: Hepatocellular carcinoma |
| NAFLD: Non-alcoholic fatty liver disease | ||
| Oral Cavity | 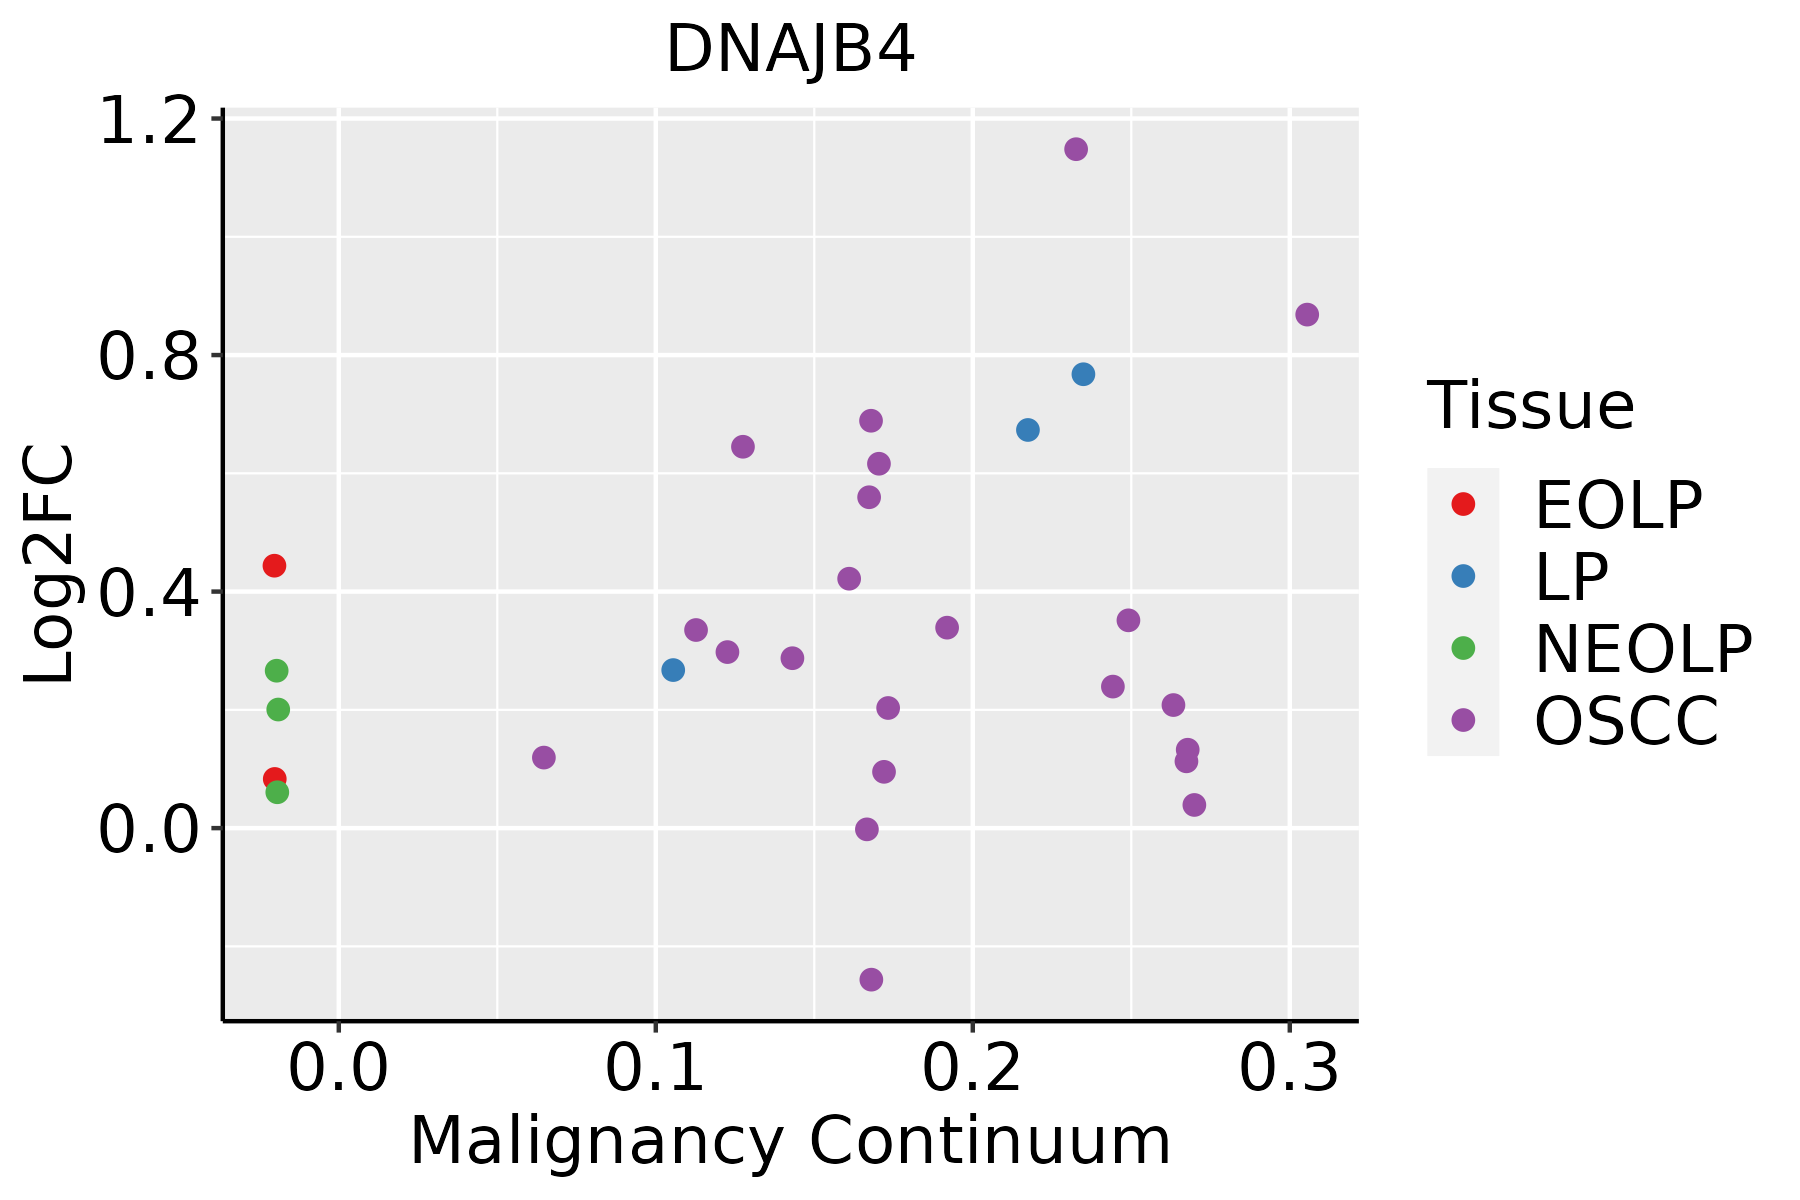 | EOLP: Erosive Oral lichen planus |
| LP: leukoplakia | ||
| NEOLP: Non-erosive oral lichen planus | ||
| OSCC: Oral squamous cell carcinoma | ||
| Prostate |  | BPH: Benign Prostatic Hyperplasia |
| Skin |  | AK: Actinic keratosis |
| cSCC: Cutaneous squamous cell carcinoma | ||
| SCCIS:squamous cell carcinoma in situ | ||
| Thyroid | 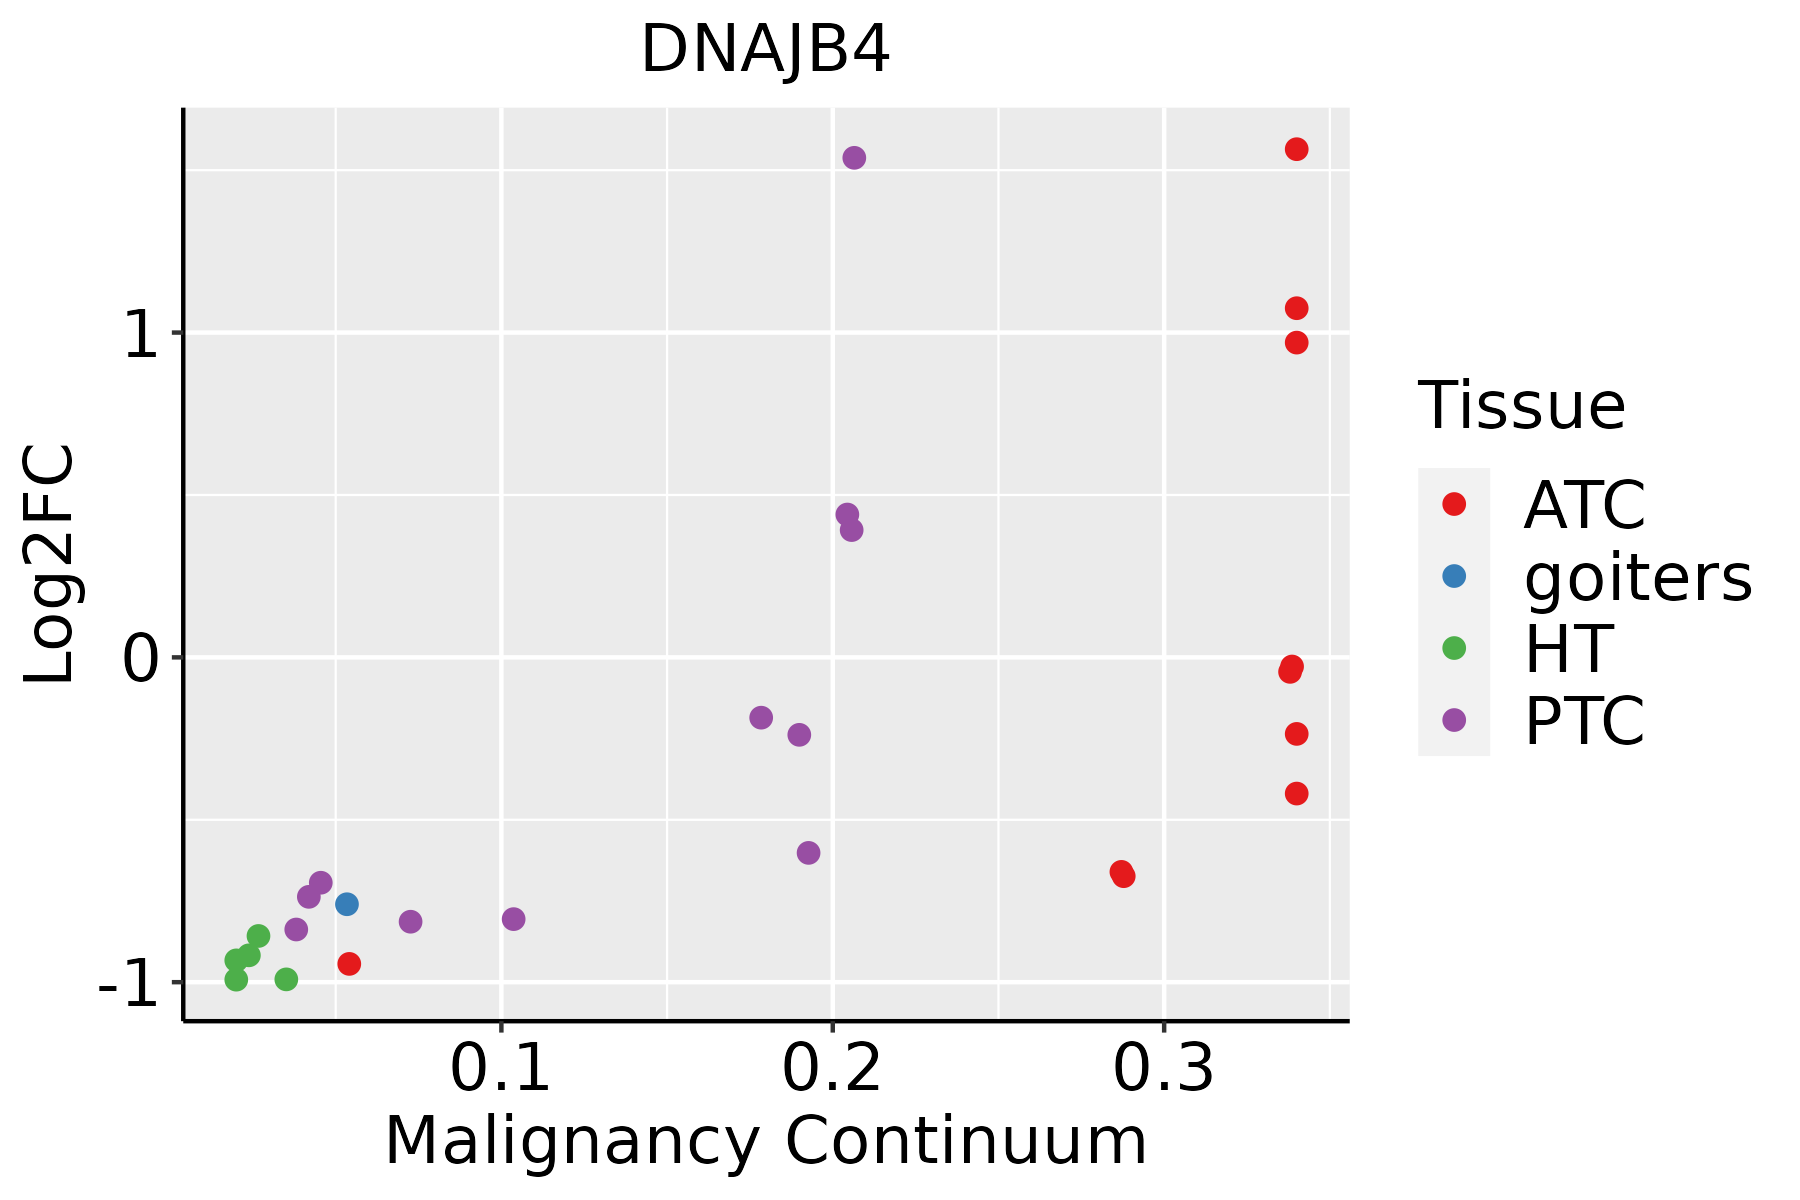 | ATC: Anaplastic thyroid cancer |
| HT: Hashimoto's thyroiditis | ||
| PTC: Papillary thyroid cancer |
| ∗log2FC in expression of this searched gene in stem-like cells from each diseased tissue sample relative to stem-like cells in normal samples in each tissue plotted against the malignancy continuum. Samples are colored based on if they are from different disease stage. |
Top |
Malignant transformation related pathway analysis |
| Find out the enriched GO biological processes and KEGG pathways involved in transition from healthy to precancer to cancer |
| Tissue | Disease Stage | Enriched GO biological Processes |
| Colorectum | AD |  |
| Colorectum | SER |  |
| Colorectum | MSS |  |
| Colorectum | MSI-H |  |
| Colorectum | FAP |  |
| ∗Top 15 enriched GO BP terms are showed in the bar plot of each disease state in each tissue. Each row represents a significant GO biological process which is colored according to the -log10(p.adjust). |
| Page: 1 2 3 4 5 6 7 8 9 |
| GO ID | Tissue | Disease Stage | Description | Gene Ratio | Bg Ratio | pvalue | p.adjust | Count |
| GO:0006457110 | Esophagus | ESCC | protein folding | 163/8552 | 212/18723 | 1.13e-20 | 1.74e-18 | 163 |
| GO:0035966111 | Esophagus | ESCC | response to topologically incorrect protein | 125/8552 | 159/18723 | 1.44e-17 | 1.27e-15 | 125 |
| GO:0006986111 | Esophagus | ESCC | response to unfolded protein | 107/8552 | 137/18723 | 7.01e-15 | 3.87e-13 | 107 |
| GO:0061077110 | Esophagus | ESCC | chaperone-mediated protein folding | 56/8552 | 67/18723 | 1.52e-10 | 4.36e-09 | 56 |
| GO:0009408110 | Esophagus | ESCC | response to heat | 77/8552 | 110/18723 | 2.01e-07 | 3.11e-06 | 77 |
| GO:0006458110 | Esophagus | ESCC | 'de novo' protein folding | 36/8552 | 43/18723 | 2.90e-07 | 4.20e-06 | 36 |
| GO:0051084110 | Esophagus | ESCC | 'de novo' posttranslational protein folding | 32/8552 | 39/18723 | 3.27e-06 | 3.65e-05 | 32 |
| GO:0051085110 | Esophagus | ESCC | chaperone cofactor-dependent protein refolding | 27/8552 | 34/18723 | 6.01e-05 | 4.62e-04 | 27 |
| GO:000926619 | Esophagus | ESCC | response to temperature stimulus | 106/8552 | 178/18723 | 1.30e-04 | 8.84e-04 | 106 |
| GO:00064577 | Liver | Cirrhotic | protein folding | 114/4634 | 212/18723 | 9.23e-20 | 2.31e-17 | 114 |
| GO:00359667 | Liver | Cirrhotic | response to topologically incorrect protein | 91/4634 | 159/18723 | 2.07e-18 | 3.60e-16 | 91 |
| GO:00069867 | Liver | Cirrhotic | response to unfolded protein | 79/4634 | 137/18723 | 1.99e-16 | 2.49e-14 | 79 |
| GO:00610777 | Liver | Cirrhotic | chaperone-mediated protein folding | 40/4634 | 67/18723 | 1.24e-09 | 5.43e-08 | 40 |
| GO:00094087 | Liver | Cirrhotic | response to heat | 49/4634 | 110/18723 | 4.47e-06 | 7.42e-05 | 49 |
| GO:00510857 | Liver | Cirrhotic | chaperone cofactor-dependent protein refolding | 19/4634 | 34/18723 | 1.01e-04 | 1.05e-03 | 19 |
| GO:00064587 | Liver | Cirrhotic | 'de novo' protein folding | 22/4634 | 43/18723 | 1.69e-04 | 1.59e-03 | 22 |
| GO:00510847 | Liver | Cirrhotic | 'de novo' posttranslational protein folding | 20/4634 | 39/18723 | 3.19e-04 | 2.77e-03 | 20 |
| GO:00092666 | Liver | Cirrhotic | response to temperature stimulus | 63/4634 | 178/18723 | 9.38e-04 | 6.66e-03 | 63 |
| GO:000645712 | Liver | HCC | protein folding | 160/7958 | 212/18723 | 1.07e-22 | 1.88e-20 | 160 |
| GO:003596612 | Liver | HCC | response to topologically incorrect protein | 123/7958 | 159/18723 | 2.60e-19 | 3.44e-17 | 123 |
| Page: 1 2 3 4 5 6 7 |
| Pathway ID | Tissue | Disease Stage | Description | Gene Ratio | Bg Ratio | pvalue | p.adjust | qvalue | Count |
| Page: 1 |
Top |
Cell-cell communication analysis |
| Identification of potential cell-cell interactions between two cell types and their ligand-receptor pairs for different disease states |
| Ligand | Receptor | LRpair | Pathway | Tissue | Disease Stage |
| Page: 1 |
Top |
Single-cell gene regulatory network inference analysis |
| Find out the significant the regulons (TFs) and the target genes of each regulon across cell types for different disease states |
| TF | Cell Type | Tissue | Disease Stage | Target Gene | RSS | Regulon Activity |
| ∗The dot plots of a searched regulon are shown for all cell subpopulations in each disease state of each tissue based on the regulon specific score inferred using pySCENIC and by calculating the average expression. |
| Page: 1 |
Top |
Somatic mutation of malignant transformation related genes |
| Annotation of somatic variants for genes involved in malignant transformation |
| Hugo Symbol | Variant Class | Variant Classification | dbSNP RS | HGVSc | HGVSp | HGVSp Short | SWISSPROT | BIOTYPE | SIFT | PolyPhen | Tumor Sample Barcode | Tissue | Histology | Sex | Age | Stage | Therapy Types | Drugs | Outcome |
| DNAJB4 | SNV | Missense_Mutation | c.375N>A | p.Met125Ile | p.M125I | Q9UDY4 | protein_coding | tolerated(0.19) | benign(0.061) | TCGA-A8-A07L-01 | Breast | breast invasive carcinoma | Female | <65 | III/IV | Chemotherapy | CR | ||
| DNAJB4 | SNV | Missense_Mutation | novel | c.730A>C | p.Lys244Gln | p.K244Q | Q9UDY4 | protein_coding | tolerated(0.06) | benign(0.331) | TCGA-AN-A0FY-01 | Breast | breast invasive carcinoma | Female | <65 | I/II | Unknown | Unknown | SD |
| DNAJB4 | SNV | Missense_Mutation | novel | c.686N>A | p.Ala229Glu | p.A229E | Q9UDY4 | protein_coding | deleterious(0) | probably_damaging(0.998) | TCGA-AR-A0U2-01 | Breast | breast invasive carcinoma | Female | <65 | III/IV | Hormone Therapy | tamoxiphen | PD |
| DNAJB4 | SNV | Missense_Mutation | novel | c.730N>C | p.Lys244Gln | p.K244Q | Q9UDY4 | protein_coding | tolerated(0.06) | benign(0.331) | TCGA-B6-A0IM-01 | Breast | breast invasive carcinoma | Female | >=65 | I/II | Unknown | Unknown | SD |
| DNAJB4 | SNV | Missense_Mutation | novel | c.365C>G | p.Ser122Cys | p.S122C | Q9UDY4 | protein_coding | deleterious(0.05) | benign(0.375) | TCGA-PE-A5DE-01 | Breast | breast invasive carcinoma | Female | <65 | I/II | Chemotherapy | taxotere | CR |
| DNAJB4 | deletion | Frame_Shift_Del | c.985delG | p.Val329TyrfsTer23 | p.V329Yfs*23 | Q9UDY4 | protein_coding | TCGA-EW-A2FV-01 | Breast | breast invasive carcinoma | Female | <65 | III/IV | Chemotherapy | docetaxel | SD | |||
| DNAJB4 | SNV | Missense_Mutation | c.287N>T | p.Ala96Val | p.A96V | Q9UDY4 | protein_coding | deleterious(0.04) | benign(0.103) | TCGA-AA-3966-01 | Colorectum | colon adenocarcinoma | Female | >=65 | I/II | Unknown | Unknown | SD | |
| DNAJB4 | SNV | Missense_Mutation | rs768311310 | c.344G>A | p.Arg115Gln | p.R115Q | Q9UDY4 | protein_coding | tolerated(0.59) | benign(0.013) | TCGA-AA-A00N-01 | Colorectum | colon adenocarcinoma | Male | >=65 | I/II | Unknown | Unknown | PD |
| DNAJB4 | deletion | Frame_Shift_Del | c.908delA | p.Asn303IlefsTer9 | p.N303Ifs*9 | Q9UDY4 | protein_coding | TCGA-CM-4743-01 | Colorectum | colon adenocarcinoma | Male | >=65 | I/II | Chemotherapy | capecitabine | SD | |||
| DNAJB4 | SNV | Missense_Mutation | novel | c.670C>T | p.Pro224Ser | p.P224S | Q9UDY4 | protein_coding | tolerated(0.08) | benign(0.056) | TCGA-AJ-A3EK-01 | Endometrium | uterine corpus endometrioid carcinoma | Female | <65 | I/II | Chemotherapy | carboplatin | CR |
| Page: 1 2 3 4 5 |
Top |
Related drugs of malignant transformation related genes |
| Identification of chemicals and drugs interact with genes involved in malignant transfromation |
| (DGIdb 4.0) |
| Entrez ID | Symbol | Category | Interaction Types | Drug Claim Name | Drug Name | PMIDs |
| Page: 1 |

Copyright 2023-Present -The University of Texas Health Science Center at Houston |