
|
|||||
|
 | |
| |
| |
| |
| |
| |
|
Gene: DNAJB2 |
Gene summary for DNAJB2 |
| Gene information | Species | Human | Gene symbol | DNAJB2 | Gene ID | 3300 |
| Gene name | DnaJ heat shock protein family (Hsp40) member B2 | |
| Gene Alias | CMT2T | |
| Cytomap | 2q35 | |
| Gene Type | protein-coding | GO ID | GO:0001558 | UniProtAcc | P25686 |
Top |
Malignant transformation analysis |
| Identification of the aberrant gene expression in precancerous and cancerous lesions by comparing the gene expression of stem-like cells in diseased tissues with normal stem cells |
| Entrez ID | Symbol | Replicates | Species | Organ | Tissue | Adj P-value | Log2FC | Malignancy |
| 3300 | DNAJB2 | LZE4T | Human | Esophagus | ESCC | 9.47e-08 | 2.15e-01 | 0.0811 |
| 3300 | DNAJB2 | LZE20T | Human | Esophagus | ESCC | 3.21e-07 | 2.28e-01 | 0.0662 |
| 3300 | DNAJB2 | LZE22T | Human | Esophagus | ESCC | 2.97e-04 | 2.15e-01 | 0.068 |
| 3300 | DNAJB2 | LZE24T | Human | Esophagus | ESCC | 6.53e-16 | 3.96e-01 | 0.0596 |
| 3300 | DNAJB2 | LZE6T | Human | Esophagus | ESCC | 5.84e-06 | 1.73e-01 | 0.0845 |
| 3300 | DNAJB2 | P1T-E | Human | Esophagus | ESCC | 1.52e-08 | 3.70e-01 | 0.0875 |
| 3300 | DNAJB2 | P2T-E | Human | Esophagus | ESCC | 2.87e-23 | 2.94e-01 | 0.1177 |
| 3300 | DNAJB2 | P4T-E | Human | Esophagus | ESCC | 1.04e-30 | 3.55e-01 | 0.1323 |
| 3300 | DNAJB2 | P5T-E | Human | Esophagus | ESCC | 1.42e-29 | 5.63e-01 | 0.1327 |
| 3300 | DNAJB2 | P8T-E | Human | Esophagus | ESCC | 4.27e-16 | 2.27e-01 | 0.0889 |
| 3300 | DNAJB2 | P9T-E | Human | Esophagus | ESCC | 5.40e-17 | 2.33e-01 | 0.1131 |
| 3300 | DNAJB2 | P10T-E | Human | Esophagus | ESCC | 3.77e-29 | 4.28e-01 | 0.116 |
| 3300 | DNAJB2 | P11T-E | Human | Esophagus | ESCC | 6.11e-25 | 9.57e-01 | 0.1426 |
| 3300 | DNAJB2 | P12T-E | Human | Esophagus | ESCC | 2.64e-23 | 5.29e-01 | 0.1122 |
| 3300 | DNAJB2 | P15T-E | Human | Esophagus | ESCC | 9.67e-19 | 3.41e-01 | 0.1149 |
| 3300 | DNAJB2 | P16T-E | Human | Esophagus | ESCC | 1.52e-18 | 3.80e-01 | 0.1153 |
| 3300 | DNAJB2 | P17T-E | Human | Esophagus | ESCC | 4.24e-19 | 6.10e-01 | 0.1278 |
| 3300 | DNAJB2 | P19T-E | Human | Esophagus | ESCC | 3.98e-15 | 7.19e-01 | 0.1662 |
| 3300 | DNAJB2 | P20T-E | Human | Esophagus | ESCC | 1.15e-20 | 3.75e-01 | 0.1124 |
| 3300 | DNAJB2 | P21T-E | Human | Esophagus | ESCC | 7.04e-36 | 7.36e-01 | 0.1617 |
| Page: 1 2 3 4 5 6 7 |
| Tissue | Expression Dynamics | Abbreviation |
| Esophagus | 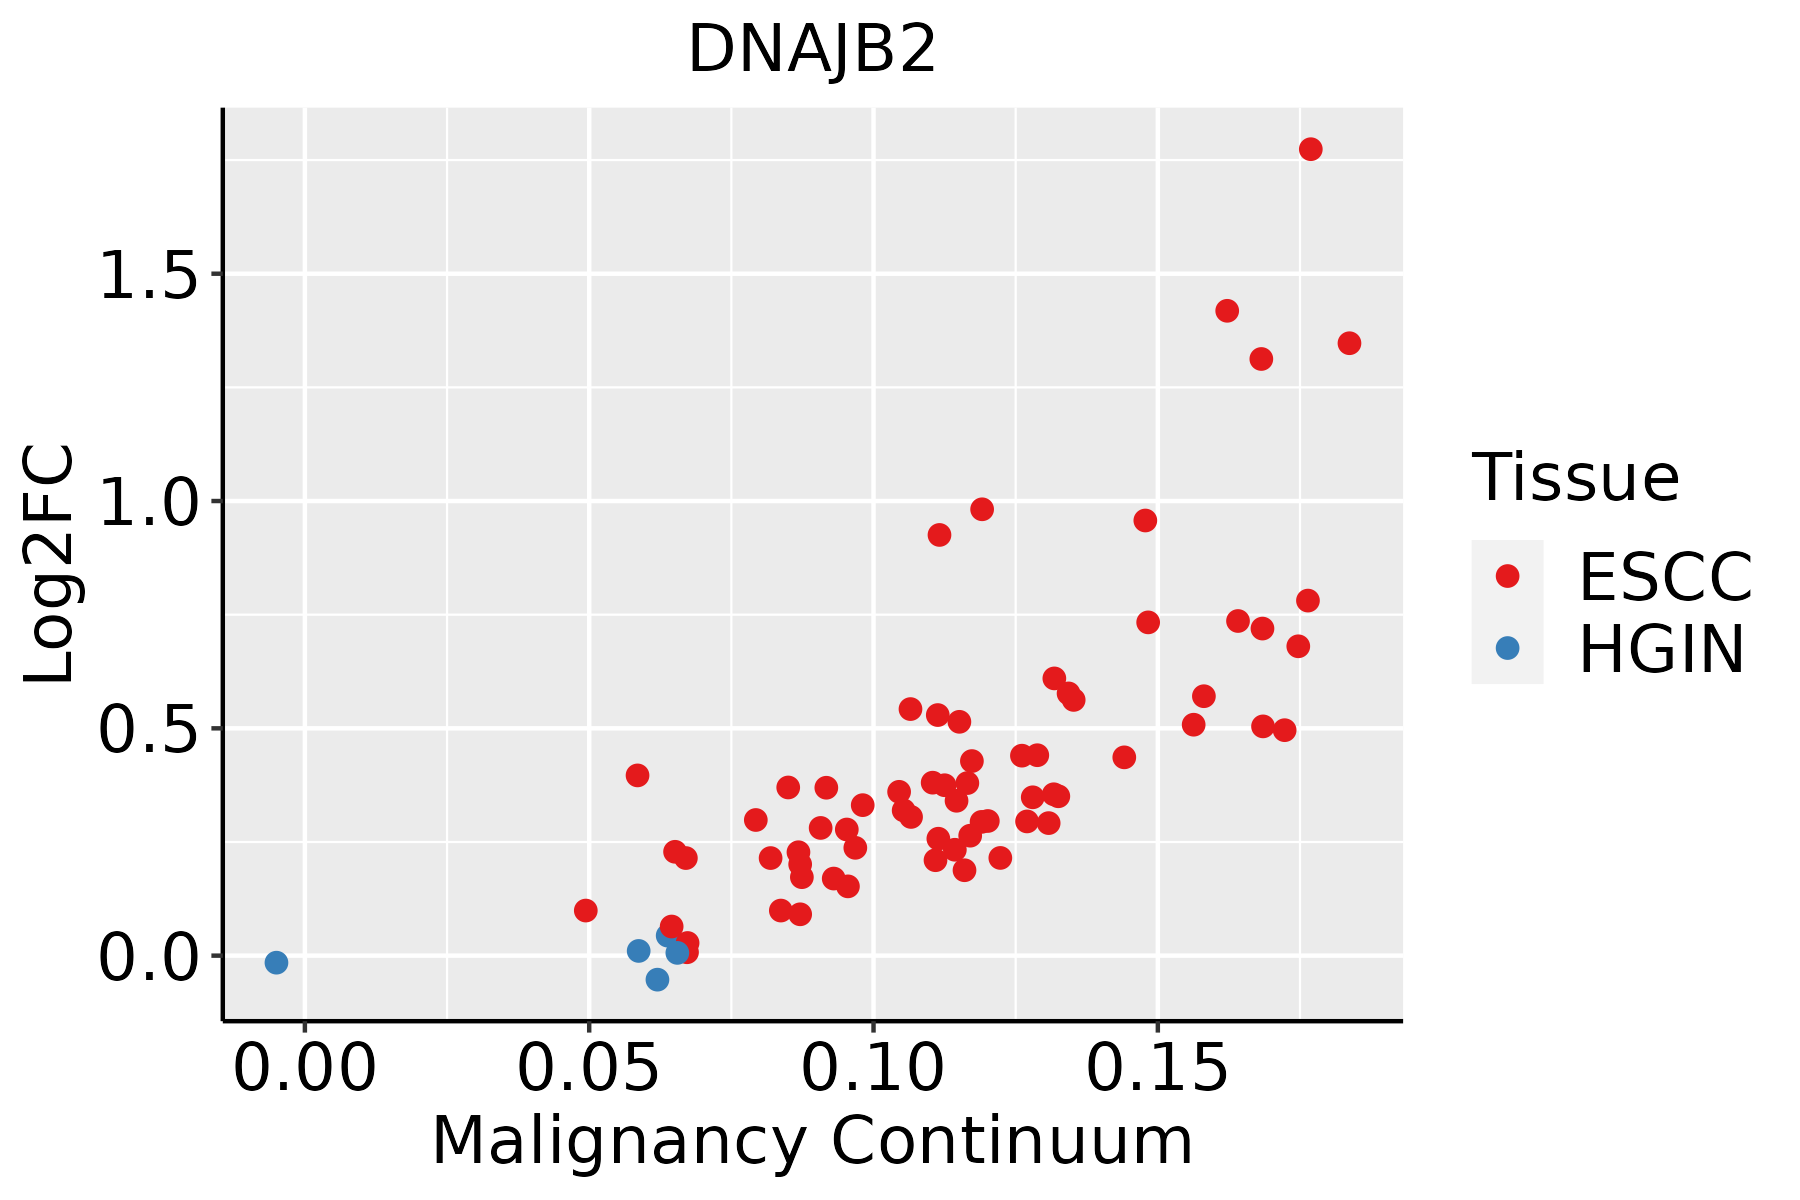 | ESCC: Esophageal squamous cell carcinoma |
| HGIN: High-grade intraepithelial neoplasias | ||
| LGIN: Low-grade intraepithelial neoplasias | ||
| Liver | 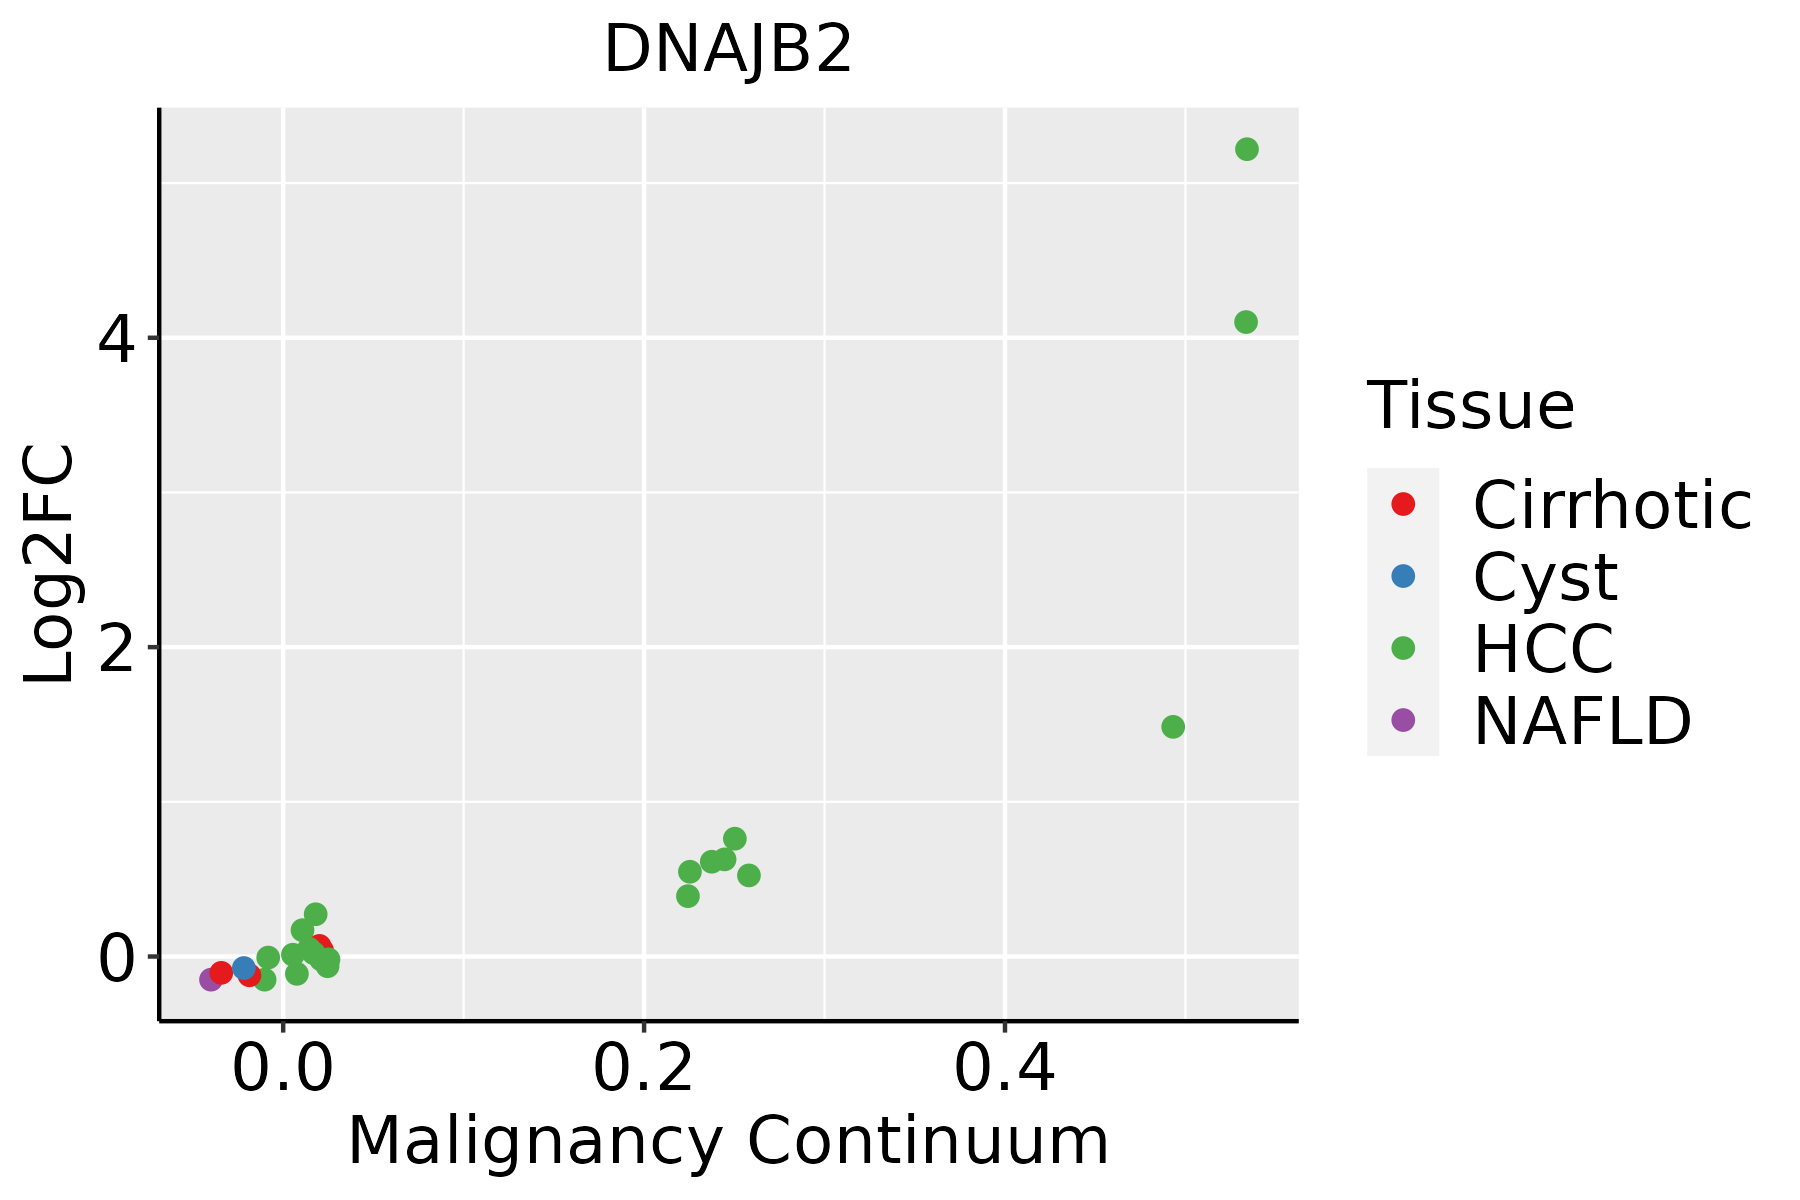 | HCC: Hepatocellular carcinoma |
| NAFLD: Non-alcoholic fatty liver disease | ||
| Oral Cavity | 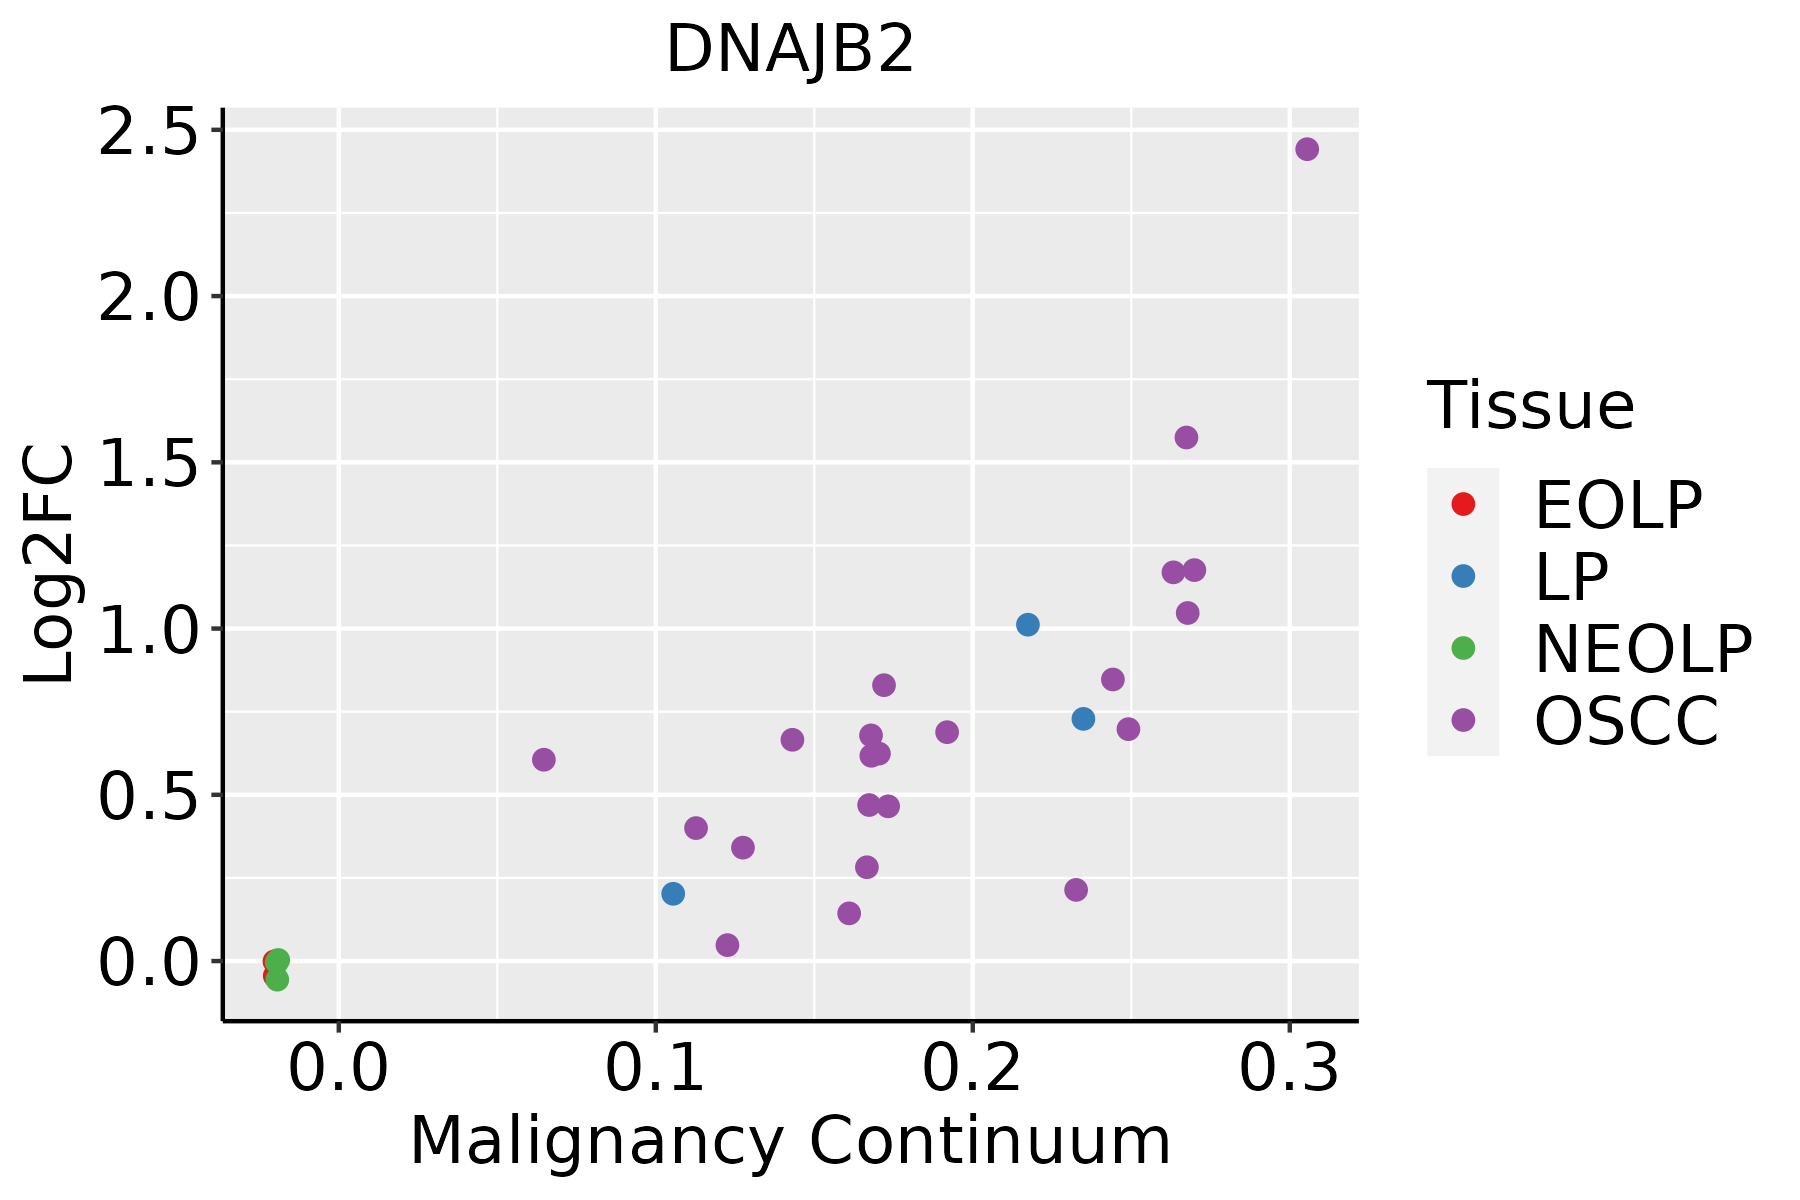 | EOLP: Erosive Oral lichen planus |
| LP: leukoplakia | ||
| NEOLP: Non-erosive oral lichen planus | ||
| OSCC: Oral squamous cell carcinoma | ||
| Prostate | 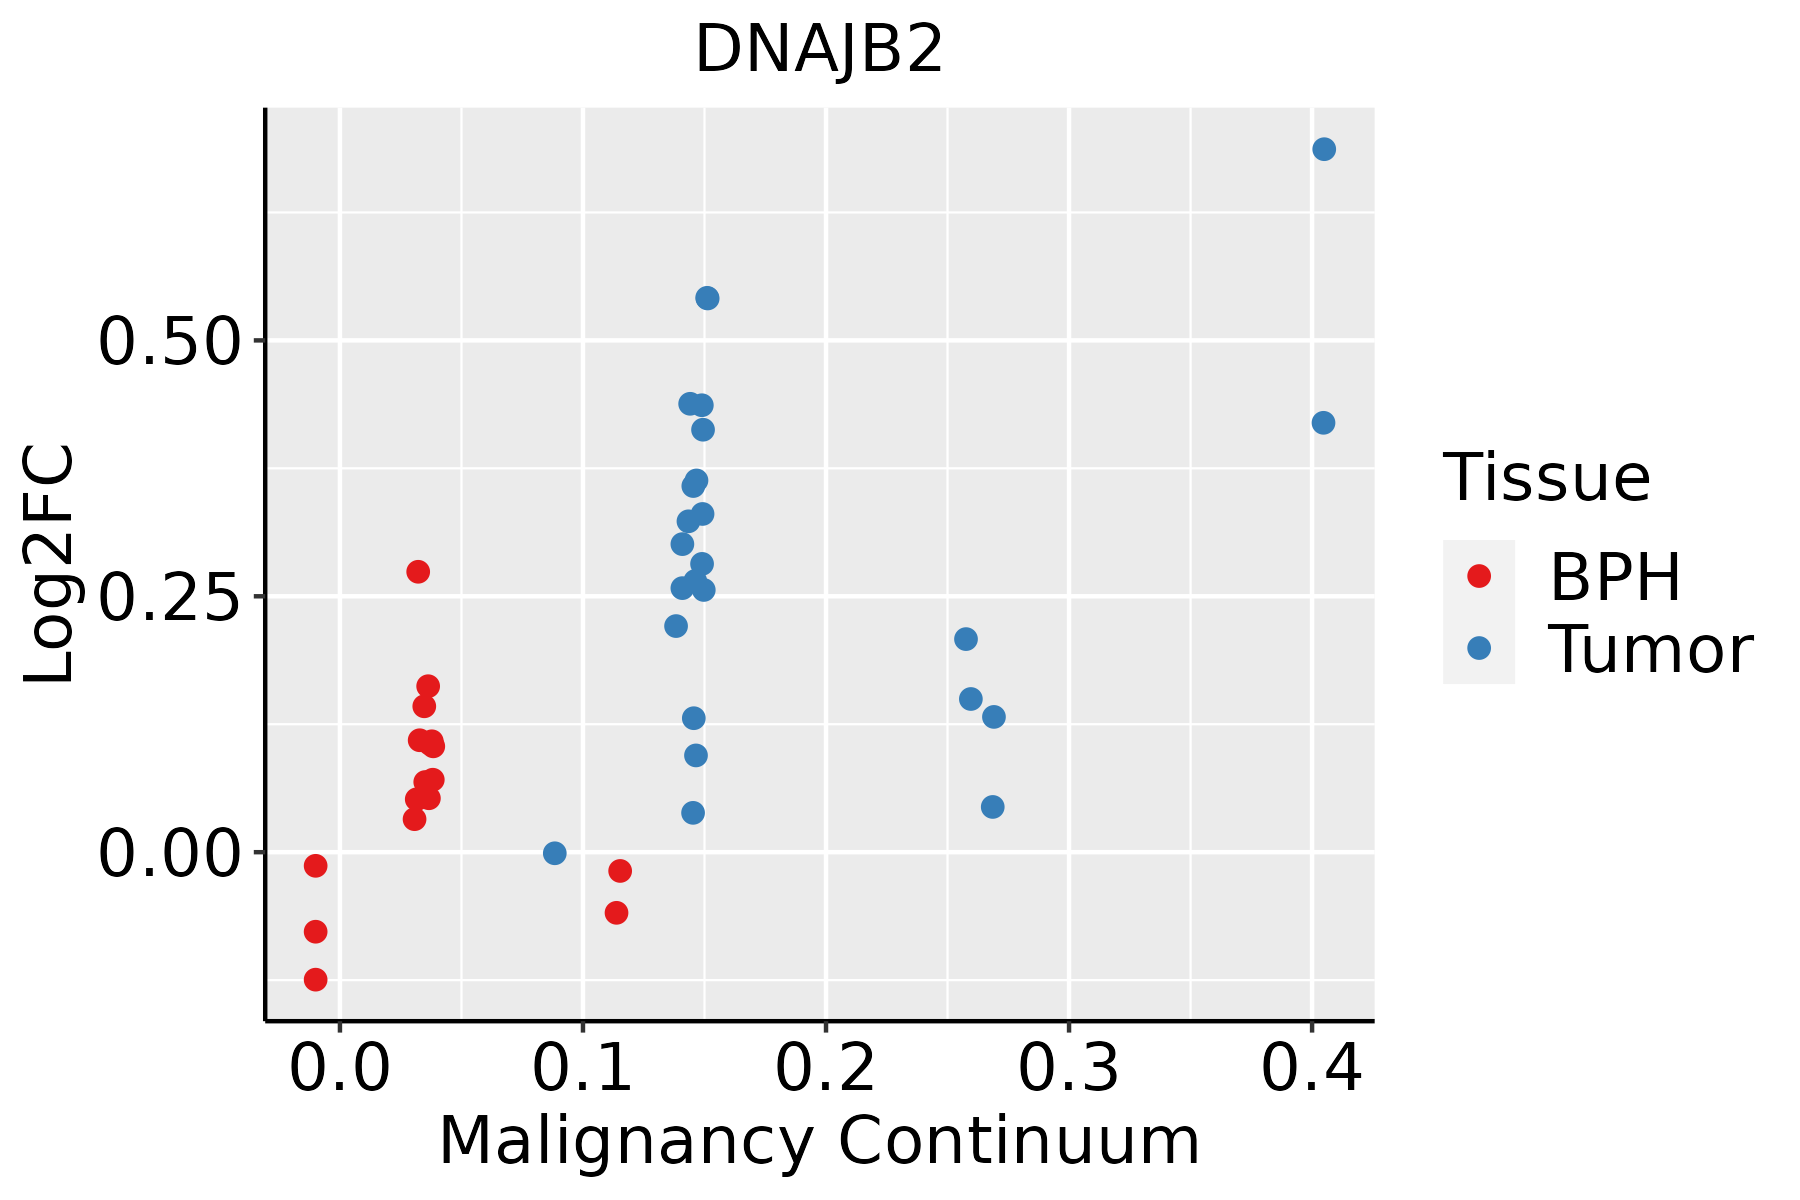 | BPH: Benign Prostatic Hyperplasia |
| Skin |  | AK: Actinic keratosis |
| cSCC: Cutaneous squamous cell carcinoma | ||
| SCCIS:squamous cell carcinoma in situ | ||
| Thyroid |  | ATC: Anaplastic thyroid cancer |
| HT: Hashimoto's thyroiditis | ||
| PTC: Papillary thyroid cancer |
| ∗log2FC in expression of this searched gene in stem-like cells from each diseased tissue sample relative to stem-like cells in normal samples in each tissue plotted against the malignancy continuum. Samples are colored based on if they are from different disease stage. |
Top |
Malignant transformation related pathway analysis |
| Find out the enriched GO biological processes and KEGG pathways involved in transition from healthy to precancer to cancer |
| Tissue | Disease Stage | Enriched GO biological Processes |
| Colorectum | AD |  |
| Colorectum | SER |  |
| Colorectum | MSS |  |
| Colorectum | MSI-H |  |
| Colorectum | FAP |  |
| ∗Top 15 enriched GO BP terms are showed in the bar plot of each disease state in each tissue. Each row represents a significant GO biological process which is colored according to the -log10(p.adjust). |
| Page: 1 2 3 4 5 6 7 8 9 |
| GO ID | Tissue | Disease Stage | Description | Gene Ratio | Bg Ratio | pvalue | p.adjust | Count |
| GO:0010498111 | Esophagus | ESCC | proteasomal protein catabolic process | 369/8552 | 490/18723 | 1.13e-41 | 1.80e-38 | 369 |
| GO:0043161111 | Esophagus | ESCC | proteasome-mediated ubiquitin-dependent protein catabolic process | 312/8552 | 412/18723 | 3.53e-36 | 4.48e-33 | 312 |
| GO:0042176111 | Esophagus | ESCC | regulation of protein catabolic process | 280/8552 | 391/18723 | 8.65e-26 | 2.39e-23 | 280 |
| GO:0009896111 | Esophagus | ESCC | positive regulation of catabolic process | 332/8552 | 492/18723 | 4.36e-23 | 9.22e-21 | 332 |
| GO:0034976111 | Esophagus | ESCC | response to endoplasmic reticulum stress | 192/8552 | 256/18723 | 7.15e-22 | 1.30e-19 | 192 |
| GO:0031331111 | Esophagus | ESCC | positive regulation of cellular catabolic process | 292/8552 | 427/18723 | 8.67e-22 | 1.53e-19 | 292 |
| GO:0006457110 | Esophagus | ESCC | protein folding | 163/8552 | 212/18723 | 1.13e-20 | 1.74e-18 | 163 |
| GO:1903320111 | Esophagus | ESCC | regulation of protein modification by small protein conjugation or removal | 181/8552 | 242/18723 | 1.80e-20 | 2.60e-18 | 181 |
| GO:1903362111 | Esophagus | ESCC | regulation of cellular protein catabolic process | 188/8552 | 255/18723 | 5.12e-20 | 6.62e-18 | 188 |
| GO:0051098111 | Esophagus | ESCC | regulation of binding | 251/8552 | 363/18723 | 6.73e-20 | 8.46e-18 | 251 |
| GO:0045862111 | Esophagus | ESCC | positive regulation of proteolysis | 256/8552 | 372/18723 | 7.88e-20 | 9.43e-18 | 256 |
| GO:0035966111 | Esophagus | ESCC | response to topologically incorrect protein | 125/8552 | 159/18723 | 1.44e-17 | 1.27e-15 | 125 |
| GO:1903050111 | Esophagus | ESCC | regulation of proteolysis involved in cellular protein catabolic process | 163/8552 | 221/18723 | 1.44e-17 | 1.27e-15 | 163 |
| GO:0061136111 | Esophagus | ESCC | regulation of proteasomal protein catabolic process | 142/8552 | 187/18723 | 2.40e-17 | 2.00e-15 | 142 |
| GO:0045732111 | Esophagus | ESCC | positive regulation of protein catabolic process | 167/8552 | 231/18723 | 1.47e-16 | 1.14e-14 | 167 |
| GO:0031396111 | Esophagus | ESCC | regulation of protein ubiquitination | 154/8552 | 210/18723 | 2.70e-16 | 2.04e-14 | 154 |
| GO:0032434111 | Esophagus | ESCC | regulation of proteasomal ubiquitin-dependent protein catabolic process | 107/8552 | 134/18723 | 4.06e-16 | 2.93e-14 | 107 |
| GO:2000058111 | Esophagus | ESCC | regulation of ubiquitin-dependent protein catabolic process | 125/8552 | 164/18723 | 1.17e-15 | 7.76e-14 | 125 |
| GO:0006986111 | Esophagus | ESCC | response to unfolded protein | 107/8552 | 137/18723 | 7.01e-15 | 3.87e-13 | 107 |
| GO:1903364111 | Esophagus | ESCC | positive regulation of cellular protein catabolic process | 117/8552 | 155/18723 | 3.25e-14 | 1.66e-12 | 117 |
| Page: 1 2 3 4 5 6 7 8 9 10 11 12 13 14 15 16 17 18 19 20 |
| Pathway ID | Tissue | Disease Stage | Description | Gene Ratio | Bg Ratio | pvalue | p.adjust | qvalue | Count |
| hsa04141211 | Esophagus | ESCC | Protein processing in endoplasmic reticulum | 147/4205 | 174/8465 | 3.29e-22 | 1.10e-19 | 5.64e-20 | 147 |
| hsa04141310 | Esophagus | ESCC | Protein processing in endoplasmic reticulum | 147/4205 | 174/8465 | 3.29e-22 | 1.10e-19 | 5.64e-20 | 147 |
| hsa0414114 | Liver | Cirrhotic | Protein processing in endoplasmic reticulum | 114/2530 | 174/8465 | 1.16e-22 | 9.67e-21 | 5.96e-21 | 114 |
| hsa0414115 | Liver | Cirrhotic | Protein processing in endoplasmic reticulum | 114/2530 | 174/8465 | 1.16e-22 | 9.67e-21 | 5.96e-21 | 114 |
| hsa0414122 | Liver | HCC | Protein processing in endoplasmic reticulum | 146/4020 | 174/8465 | 7.34e-24 | 2.46e-21 | 1.37e-21 | 146 |
| hsa0414132 | Liver | HCC | Protein processing in endoplasmic reticulum | 146/4020 | 174/8465 | 7.34e-24 | 2.46e-21 | 1.37e-21 | 146 |
| hsa0414130 | Oral cavity | OSCC | Protein processing in endoplasmic reticulum | 143/3704 | 174/8465 | 6.82e-26 | 2.28e-23 | 1.16e-23 | 143 |
| hsa04141113 | Oral cavity | OSCC | Protein processing in endoplasmic reticulum | 143/3704 | 174/8465 | 6.82e-26 | 2.28e-23 | 1.16e-23 | 143 |
| hsa04141210 | Oral cavity | LP | Protein processing in endoplasmic reticulum | 113/2418 | 174/8465 | 8.74e-24 | 5.82e-22 | 3.76e-22 | 113 |
| hsa0414138 | Oral cavity | LP | Protein processing in endoplasmic reticulum | 113/2418 | 174/8465 | 8.74e-24 | 5.82e-22 | 3.76e-22 | 113 |
| hsa0414128 | Prostate | BPH | Protein processing in endoplasmic reticulum | 97/1718 | 174/8465 | 2.37e-25 | 1.30e-23 | 8.07e-24 | 97 |
| hsa04141112 | Prostate | BPH | Protein processing in endoplasmic reticulum | 97/1718 | 174/8465 | 2.37e-25 | 1.30e-23 | 8.07e-24 | 97 |
| hsa0414129 | Prostate | Tumor | Protein processing in endoplasmic reticulum | 99/1791 | 174/8465 | 2.58e-25 | 1.71e-23 | 1.06e-23 | 99 |
| hsa0414137 | Prostate | Tumor | Protein processing in endoplasmic reticulum | 99/1791 | 174/8465 | 2.58e-25 | 1.71e-23 | 1.06e-23 | 99 |
| Page: 1 |
Top |
Cell-cell communication analysis |
| Identification of potential cell-cell interactions between two cell types and their ligand-receptor pairs for different disease states |
| Ligand | Receptor | LRpair | Pathway | Tissue | Disease Stage |
| Page: 1 |
Top |
Single-cell gene regulatory network inference analysis |
| Find out the significant the regulons (TFs) and the target genes of each regulon across cell types for different disease states |
| TF | Cell Type | Tissue | Disease Stage | Target Gene | RSS | Regulon Activity |
| ∗The dot plots of a searched regulon are shown for all cell subpopulations in each disease state of each tissue based on the regulon specific score inferred using pySCENIC and by calculating the average expression. |
| Page: 1 |
Top |
Somatic mutation of malignant transformation related genes |
| Annotation of somatic variants for genes involved in malignant transformation |
| Hugo Symbol | Variant Class | Variant Classification | dbSNP RS | HGVSc | HGVSp | HGVSp Short | SWISSPROT | BIOTYPE | SIFT | PolyPhen | Tumor Sample Barcode | Tissue | Histology | Sex | Age | Stage | Therapy Types | Drugs | Outcome |
| DNAJB2 | SNV | Missense_Mutation | novel | c.694N>T | p.Gly232Trp | p.G232W | P25686 | protein_coding | deleterious(0) | possibly_damaging(0.866) | TCGA-A7-A0DB-01 | Breast | breast invasive carcinoma | Female | <65 | I/II | Hormone Therapy | arimidex | SD |
| DNAJB2 | SNV | Missense_Mutation | rs200970147 | c.928N>T | p.Arg310Cys | p.R310C | P25686 | protein_coding | deleterious_low_confidence(0.05) | benign(0.058) | TCGA-AO-A128-01 | Breast | breast invasive carcinoma | Female | <65 | I/II | Chemotherapy | doxorubicin | SD |
| DNAJB2 | insertion | Frame_Shift_Ins | novel | c.369_370insAATTCTT | p.Ser124AsnfsTer90 | p.S124Nfs*90 | P25686 | protein_coding | TCGA-AN-A0FN-01 | Breast | breast invasive carcinoma | Female | <65 | I/II | Unknown | Unknown | SD | ||
| DNAJB2 | deletion | Frame_Shift_Del | novel | c.773delN | p.Met259TrpfsTer94 | p.M259Wfs*94 | P25686 | protein_coding | TCGA-EW-A2FV-01 | Breast | breast invasive carcinoma | Female | <65 | III/IV | Chemotherapy | docetaxel | SD | ||
| DNAJB2 | SNV | Missense_Mutation | rs747378005 | c.184N>T | p.Arg62Trp | p.R62W | P25686 | protein_coding | deleterious(0) | possibly_damaging(0.88) | TCGA-A6-5665-01 | Colorectum | colon adenocarcinoma | Female | >=65 | I/II | Unknown | Unknown | PD |
| DNAJB2 | SNV | Missense_Mutation | rs11559157 | c.200G>A | p.Arg67His | p.R67H | P25686 | protein_coding | deleterious(0.02) | benign(0.217) | TCGA-AA-A00N-01 | Colorectum | colon adenocarcinoma | Male | >=65 | I/II | Unknown | Unknown | PD |
| DNAJB2 | SNV | Missense_Mutation | rs11559157 | c.200G>A | p.Arg67His | p.R67H | P25686 | protein_coding | deleterious(0.02) | benign(0.217) | TCGA-AD-6964-01 | Colorectum | colon adenocarcinoma | Male | <65 | III/IV | Chemotherapy | folfox | PD |
| DNAJB2 | SNV | Missense_Mutation | c.529C>T | p.Arg177Cys | p.R177C | P25686 | protein_coding | deleterious(0) | possibly_damaging(0.513) | TCGA-D5-6530-01 | Colorectum | colon adenocarcinoma | Male | <65 | I/II | Unknown | Unknown | SD | |
| DNAJB2 | SNV | Missense_Mutation | rs201861589 | c.664N>A | p.Glu222Lys | p.E222K | P25686 | protein_coding | tolerated(0.05) | benign(0.241) | TCGA-WS-AB45-01 | Colorectum | colon adenocarcinoma | Female | <65 | I/II | Unknown | Unknown | SD |
| DNAJB2 | SNV | Missense_Mutation | novel | c.272N>A | p.Gly91Asp | p.G91D | P25686 | protein_coding | tolerated(0.72) | benign(0.074) | TCGA-A5-A0G1-01 | Endometrium | uterine corpus endometrioid carcinoma | Female | >=65 | I/II | Unknown | Unknown | SD |
| Page: 1 2 3 4 |
Top |
Related drugs of malignant transformation related genes |
| Identification of chemicals and drugs interact with genes involved in malignant transfromation |
| (DGIdb 4.0) |
| Entrez ID | Symbol | Category | Interaction Types | Drug Claim Name | Drug Name | PMIDs |
| Page: 1 |

Copyright 2023-Present -The University of Texas Health Science Center at Houston |