
|
|||||
|
 | |
| |
| |
| |
| |
| |
|
Gene: DNAJB14 |
Gene summary for DNAJB14 |
| Gene information | Species | Human | Gene symbol | DNAJB14 | Gene ID | 79982 |
| Gene name | DnaJ heat shock protein family (Hsp40) member B14 | |
| Gene Alias | EGNR9427 | |
| Cytomap | 4q23 | |
| Gene Type | protein-coding | GO ID | GO:0006457 | UniProtAcc | Q8TBM8 |
Top |
Malignant transformation analysis |
| Identification of the aberrant gene expression in precancerous and cancerous lesions by comparing the gene expression of stem-like cells in diseased tissues with normal stem cells |
| Entrez ID | Symbol | Replicates | Species | Organ | Tissue | Adj P-value | Log2FC | Malignancy |
| 79982 | DNAJB14 | HTA11_3410_2000001011 | Human | Colorectum | AD | 3.67e-08 | -4.29e-01 | 0.0155 |
| 79982 | DNAJB14 | HTA11_3361_2000001011 | Human | Colorectum | AD | 1.72e-05 | -5.09e-01 | -0.1207 |
| 79982 | DNAJB14 | HTA11_696_2000001011 | Human | Colorectum | AD | 6.78e-04 | -3.24e-01 | -0.1464 |
| 79982 | DNAJB14 | HTA11_866_3004761011 | Human | Colorectum | AD | 4.05e-07 | -4.02e-01 | 0.096 |
| 79982 | DNAJB14 | HTA11_7696_3000711011 | Human | Colorectum | AD | 5.79e-10 | -4.45e-01 | 0.0674 |
| 79982 | DNAJB14 | HTA11_99999970781_79442 | Human | Colorectum | MSS | 2.21e-02 | -2.56e-01 | 0.294 |
| 79982 | DNAJB14 | HTA11_99999974143_84620 | Human | Colorectum | MSS | 4.51e-07 | -3.98e-01 | 0.3005 |
| 79982 | DNAJB14 | F007 | Human | Colorectum | FAP | 3.60e-03 | -3.18e-01 | 0.1176 |
| 79982 | DNAJB14 | A001-C-207 | Human | Colorectum | FAP | 2.08e-03 | -1.96e-01 | 0.1278 |
| 79982 | DNAJB14 | A015-C-203 | Human | Colorectum | FAP | 2.02e-23 | -4.52e-01 | -0.1294 |
| 79982 | DNAJB14 | A015-C-204 | Human | Colorectum | FAP | 3.66e-07 | -3.53e-01 | -0.0228 |
| 79982 | DNAJB14 | A014-C-040 | Human | Colorectum | FAP | 6.89e-05 | -5.15e-01 | -0.1184 |
| 79982 | DNAJB14 | A002-C-201 | Human | Colorectum | FAP | 8.40e-13 | -3.22e-01 | 0.0324 |
| 79982 | DNAJB14 | A002-C-203 | Human | Colorectum | FAP | 2.66e-06 | -2.34e-01 | 0.2786 |
| 79982 | DNAJB14 | A001-C-119 | Human | Colorectum | FAP | 9.92e-10 | -4.00e-01 | -0.1557 |
| 79982 | DNAJB14 | A001-C-108 | Human | Colorectum | FAP | 5.16e-13 | -3.38e-01 | -0.0272 |
| 79982 | DNAJB14 | A002-C-205 | Human | Colorectum | FAP | 5.13e-20 | -4.51e-01 | -0.1236 |
| 79982 | DNAJB14 | A001-C-104 | Human | Colorectum | FAP | 5.48e-06 | -2.78e-01 | 0.0184 |
| 79982 | DNAJB14 | A015-C-005 | Human | Colorectum | FAP | 1.46e-04 | -2.54e-01 | -0.0336 |
| 79982 | DNAJB14 | A015-C-006 | Human | Colorectum | FAP | 3.40e-16 | -5.19e-01 | -0.0994 |
| Page: 1 2 3 4 5 6 7 8 9 |
| Tissue | Expression Dynamics | Abbreviation |
| Colorectum (GSE201348) |  | FAP: Familial adenomatous polyposis |
| CRC: Colorectal cancer | ||
| Colorectum (HTA11) |  | AD: Adenomas |
| SER: Sessile serrated lesions | ||
| MSI-H: Microsatellite-high colorectal cancer | ||
| MSS: Microsatellite stable colorectal cancer | ||
| Esophagus | 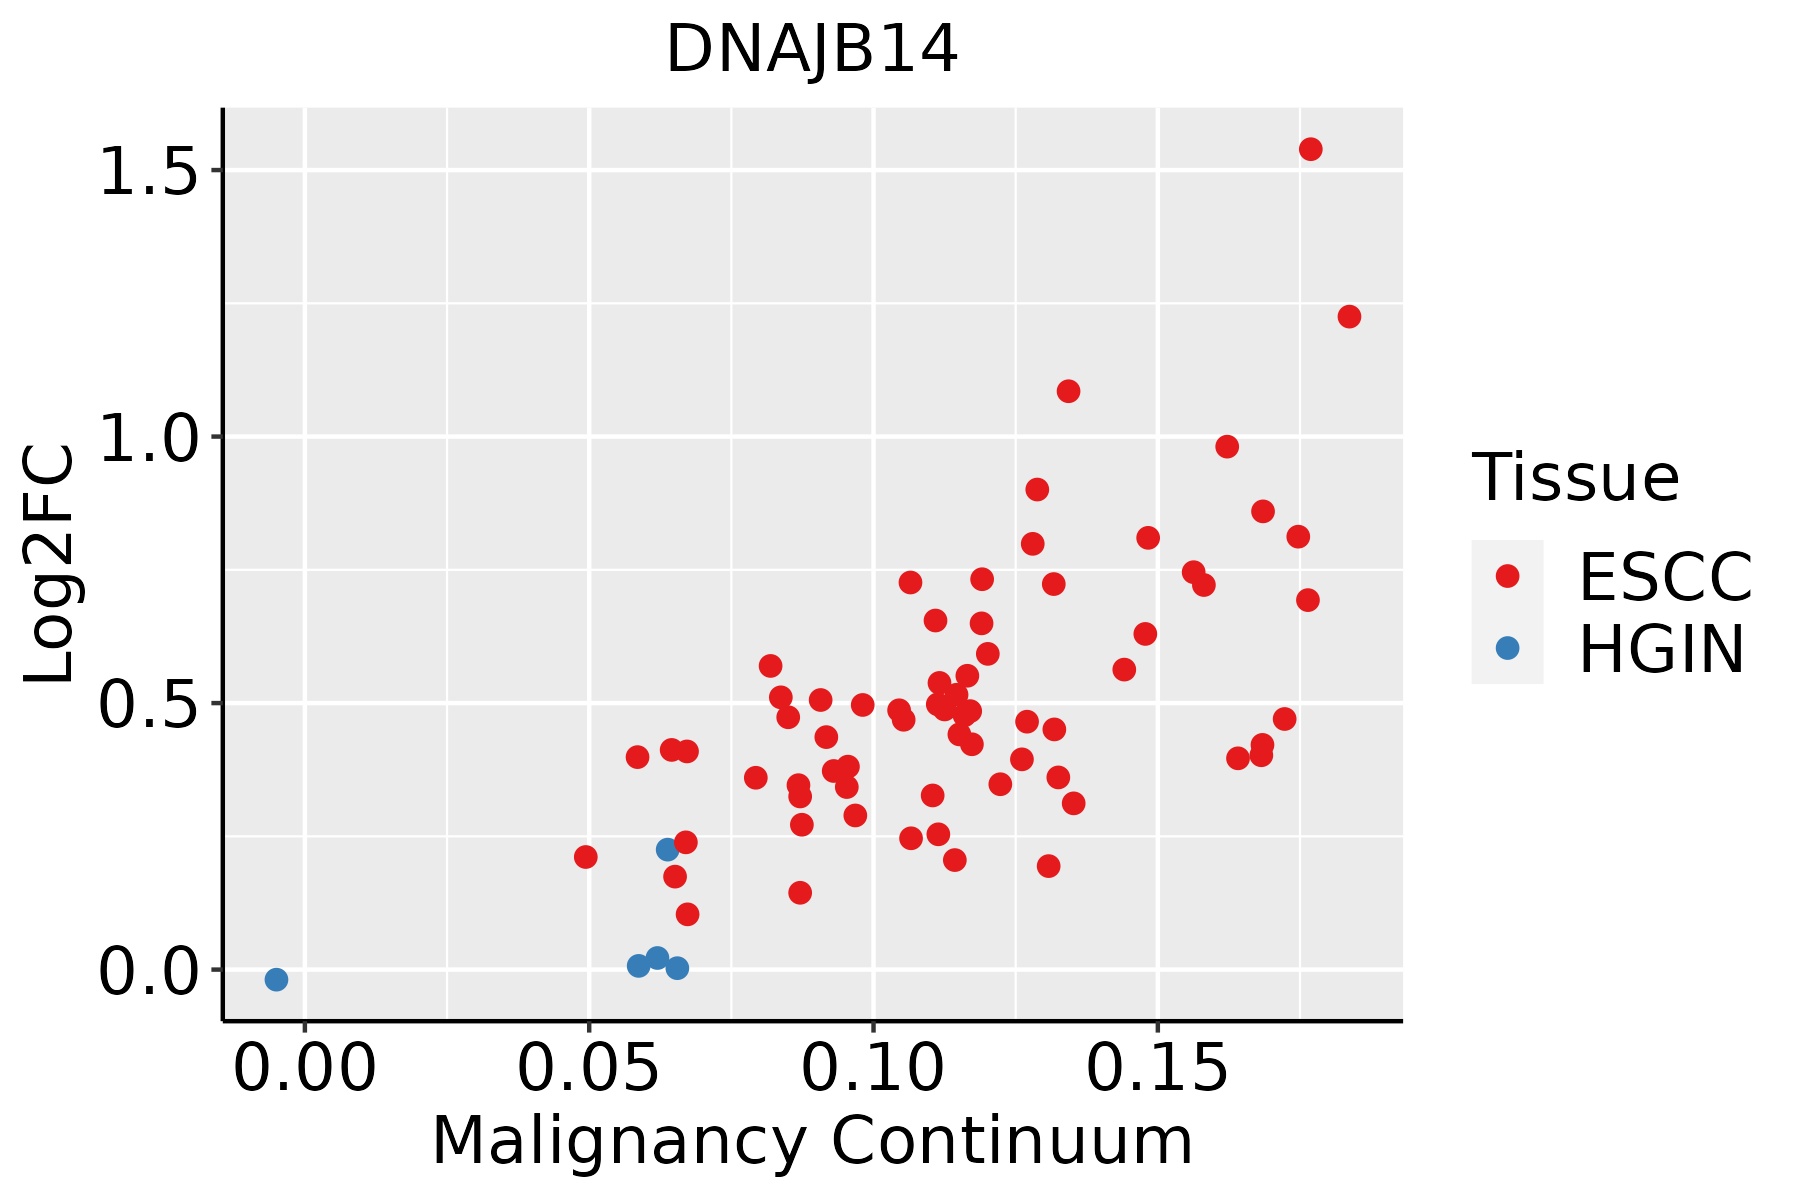 | ESCC: Esophageal squamous cell carcinoma |
| HGIN: High-grade intraepithelial neoplasias | ||
| LGIN: Low-grade intraepithelial neoplasias | ||
| Liver |  | HCC: Hepatocellular carcinoma |
| NAFLD: Non-alcoholic fatty liver disease | ||
| Lung |  | AAH: Atypical adenomatous hyperplasia |
| AIS: Adenocarcinoma in situ | ||
| IAC: Invasive lung adenocarcinoma | ||
| MIA: Minimally invasive adenocarcinoma | ||
| Oral Cavity |  | EOLP: Erosive Oral lichen planus |
| LP: leukoplakia | ||
| NEOLP: Non-erosive oral lichen planus | ||
| OSCC: Oral squamous cell carcinoma | ||
| Skin |  | AK: Actinic keratosis |
| cSCC: Cutaneous squamous cell carcinoma | ||
| SCCIS:squamous cell carcinoma in situ | ||
| Thyroid |  | ATC: Anaplastic thyroid cancer |
| HT: Hashimoto's thyroiditis | ||
| PTC: Papillary thyroid cancer |
| ∗log2FC in expression of this searched gene in stem-like cells from each diseased tissue sample relative to stem-like cells in normal samples in each tissue plotted against the malignancy continuum. Samples are colored based on if they are from different disease stage. |
Top |
Malignant transformation related pathway analysis |
| Find out the enriched GO biological processes and KEGG pathways involved in transition from healthy to precancer to cancer |
| Tissue | Disease Stage | Enriched GO biological Processes |
| Colorectum | AD |  |
| Colorectum | SER |  |
| Colorectum | MSS |  |
| Colorectum | MSI-H |  |
| Colorectum | FAP |  |
| ∗Top 15 enriched GO BP terms are showed in the bar plot of each disease state in each tissue. Each row represents a significant GO biological process which is colored according to the -log10(p.adjust). |
| Page: 1 2 3 4 5 6 7 8 9 |
| GO ID | Tissue | Disease Stage | Description | Gene Ratio | Bg Ratio | pvalue | p.adjust | Count |
| GO:0010498 | Colorectum | AD | proteasomal protein catabolic process | 174/3918 | 490/18723 | 3.18e-14 | 7.66e-12 | 174 |
| GO:0043161 | Colorectum | AD | proteasome-mediated ubiquitin-dependent protein catabolic process | 141/3918 | 412/18723 | 1.77e-10 | 1.68e-08 | 141 |
| GO:0034976 | Colorectum | AD | response to endoplasmic reticulum stress | 90/3918 | 256/18723 | 8.48e-08 | 4.28e-06 | 90 |
| GO:0006457 | Colorectum | AD | protein folding | 73/3918 | 212/18723 | 3.24e-06 | 9.10e-05 | 73 |
| GO:0035966 | Colorectum | AD | response to topologically incorrect protein | 54/3918 | 159/18723 | 8.85e-05 | 1.36e-03 | 54 |
| GO:0035967 | Colorectum | AD | cellular response to topologically incorrect protein | 42/3918 | 116/18723 | 1.04e-04 | 1.56e-03 | 42 |
| GO:0006458 | Colorectum | AD | 'de novo' protein folding | 20/3918 | 43/18723 | 1.53e-04 | 2.16e-03 | 20 |
| GO:0051084 | Colorectum | AD | 'de novo' posttranslational protein folding | 18/3918 | 39/18723 | 3.66e-04 | 4.24e-03 | 18 |
| GO:0061077 | Colorectum | AD | chaperone-mediated protein folding | 26/3918 | 67/18723 | 6.20e-04 | 6.48e-03 | 26 |
| GO:0051085 | Colorectum | AD | chaperone cofactor-dependent protein refolding | 15/3918 | 34/18723 | 1.96e-03 | 1.58e-02 | 15 |
| GO:0036503 | Colorectum | AD | ERAD pathway | 34/3918 | 107/18723 | 5.57e-03 | 3.63e-02 | 34 |
| GO:00104982 | Colorectum | MSS | proteasomal protein catabolic process | 157/3467 | 490/18723 | 2.39e-13 | 5.25e-11 | 157 |
| GO:00431612 | Colorectum | MSS | proteasome-mediated ubiquitin-dependent protein catabolic process | 127/3467 | 412/18723 | 7.70e-10 | 6.32e-08 | 127 |
| GO:00064572 | Colorectum | MSS | protein folding | 71/3467 | 212/18723 | 1.25e-07 | 5.91e-06 | 71 |
| GO:00349762 | Colorectum | MSS | response to endoplasmic reticulum stress | 81/3467 | 256/18723 | 2.65e-07 | 1.10e-05 | 81 |
| GO:00359672 | Colorectum | MSS | cellular response to topologically incorrect protein | 42/3467 | 116/18723 | 4.99e-06 | 1.38e-04 | 42 |
| GO:00359662 | Colorectum | MSS | response to topologically incorrect protein | 53/3467 | 159/18723 | 5.50e-06 | 1.49e-04 | 53 |
| GO:00064582 | Colorectum | MSS | 'de novo' protein folding | 20/3467 | 43/18723 | 2.50e-05 | 5.21e-04 | 20 |
| GO:00510842 | Colorectum | MSS | 'de novo' posttranslational protein folding | 18/3467 | 39/18723 | 7.19e-05 | 1.21e-03 | 18 |
| GO:00610772 | Colorectum | MSS | chaperone-mediated protein folding | 26/3467 | 67/18723 | 8.06e-05 | 1.33e-03 | 26 |
| Page: 1 2 3 4 5 6 7 8 9 |
| Pathway ID | Tissue | Disease Stage | Description | Gene Ratio | Bg Ratio | pvalue | p.adjust | qvalue | Count |
| Page: 1 |
Top |
Cell-cell communication analysis |
| Identification of potential cell-cell interactions between two cell types and their ligand-receptor pairs for different disease states |
| Ligand | Receptor | LRpair | Pathway | Tissue | Disease Stage |
| Page: 1 |
Top |
Single-cell gene regulatory network inference analysis |
| Find out the significant the regulons (TFs) and the target genes of each regulon across cell types for different disease states |
| TF | Cell Type | Tissue | Disease Stage | Target Gene | RSS | Regulon Activity |
| ∗The dot plots of a searched regulon are shown for all cell subpopulations in each disease state of each tissue based on the regulon specific score inferred using pySCENIC and by calculating the average expression. |
| Page: 1 |
Top |
Somatic mutation of malignant transformation related genes |
| Annotation of somatic variants for genes involved in malignant transformation |
| Hugo Symbol | Variant Class | Variant Classification | dbSNP RS | HGVSc | HGVSp | HGVSp Short | SWISSPROT | BIOTYPE | SIFT | PolyPhen | Tumor Sample Barcode | Tissue | Histology | Sex | Age | Stage | Therapy Types | Drugs | Outcome |
| DNAJB14 | SNV | Missense_Mutation | novel | c.19N>A | p.Glu7Lys | p.E7K | Q8TBM8 | protein_coding | deleterious(0) | possibly_damaging(0.519) | TCGA-A2-A0CX-01 | Breast | breast invasive carcinoma | Female | <65 | I/II | Chemotherapy | adriamycin | SD |
| DNAJB14 | SNV | Missense_Mutation | c.125N>T | p.Ser42Leu | p.S42L | Q8TBM8 | protein_coding | deleterious(0.02) | benign(0) | TCGA-D8-A1J8-01 | Breast | breast invasive carcinoma | Female | >=65 | I/II | Hormone Therapy | nolvadex | SD | |
| DNAJB14 | SNV | Missense_Mutation | novel | c.599A>G | p.Asp200Gly | p.D200G | Q8TBM8 | protein_coding | deleterious(0) | possibly_damaging(0.54) | TCGA-2W-A8YY-01 | Cervix | cervical & endocervical cancer | Female | <65 | I/II | Chemotherapy | cisplatin | CR |
| DNAJB14 | SNV | Missense_Mutation | c.380N>T | p.Ala127Val | p.A127V | Q8TBM8 | protein_coding | deleterious(0) | probably_damaging(0.997) | TCGA-FU-A3HY-01 | Cervix | cervical & endocervical cancer | Female | <65 | I/II | Chemotherapy | cisplatin | CR | |
| DNAJB14 | SNV | Missense_Mutation | novel | c.364N>A | p.Glu122Lys | p.E122K | Q8TBM8 | protein_coding | deleterious(0.01) | benign(0.141) | TCGA-VS-A94X-01 | Cervix | cervical & endocervical cancer | Female | <65 | I/II | Chemotherapy | cisplatin | PD |
| DNAJB14 | SNV | Missense_Mutation | novel | c.400N>G | p.Lys134Glu | p.K134E | Q8TBM8 | protein_coding | deleterious(0) | possibly_damaging(0.656) | TCGA-VS-A9U6-01 | Cervix | cervical & endocervical cancer | Female | <65 | I/II | Chemotherapy | cisplatin | PD |
| DNAJB14 | SNV | Missense_Mutation | novel | c.569N>C | p.Arg190Thr | p.R190T | Q8TBM8 | protein_coding | deleterious(0.02) | benign(0.053) | TCGA-ZJ-A8QR-01 | Cervix | cervical & endocervical cancer | Female | <65 | I/II | Unknown | Unknown | SD |
| DNAJB14 | SNV | Missense_Mutation | novel | c.173N>A | p.Gly58Glu | p.G58E | Q8TBM8 | protein_coding | tolerated(0.16) | benign(0.031) | TCGA-ZJ-AAXU-01 | Cervix | cervical & endocervical cancer | Female | <65 | I/II | Unknown | Unknown | SD |
| DNAJB14 | SNV | Missense_Mutation | c.1123N>A | p.Leu375Ile | p.L375I | Q8TBM8 | protein_coding | tolerated(0.41) | benign(0.003) | TCGA-AA-A010-01 | Colorectum | colon adenocarcinoma | Female | <65 | I/II | Chemotherapy | folinic | CR | |
| DNAJB14 | SNV | Missense_Mutation | c.667G>T | p.Ala223Ser | p.A223S | Q8TBM8 | protein_coding | tolerated(0.61) | benign(0.001) | TCGA-AA-A02R-01 | Colorectum | colon adenocarcinoma | Female | >=65 | I/II | Unknown | Unknown | PD |
| Page: 1 2 3 4 |
Top |
Related drugs of malignant transformation related genes |
| Identification of chemicals and drugs interact with genes involved in malignant transfromation |
| (DGIdb 4.0) |
| Entrez ID | Symbol | Category | Interaction Types | Drug Claim Name | Drug Name | PMIDs |
| Page: 1 |

Copyright 2023-Present -The University of Texas Health Science Center at Houston |