
|
|||||
|
 | |
| |
| |
| |
| |
| |
|
Gene: DNAJB12 |
Gene summary for DNAJB12 |
| Gene information | Species | Human | Gene symbol | DNAJB12 | Gene ID | 54788 |
| Gene name | DnaJ heat shock protein family (Hsp40) member B12 | |
| Gene Alias | DJ10 | |
| Cytomap | 10q22.1 | |
| Gene Type | protein-coding | GO ID | GO:0006457 | UniProtAcc | J3KPS0 |
Top |
Malignant transformation analysis |
| Identification of the aberrant gene expression in precancerous and cancerous lesions by comparing the gene expression of stem-like cells in diseased tissues with normal stem cells |
| Entrez ID | Symbol | Replicates | Species | Organ | Tissue | Adj P-value | Log2FC | Malignancy |
| 54788 | DNAJB12 | LZE4T | Human | Esophagus | ESCC | 2.95e-10 | 2.37e-01 | 0.0811 |
| 54788 | DNAJB12 | LZE8T | Human | Esophagus | ESCC | 2.17e-05 | 2.18e-01 | 0.067 |
| 54788 | DNAJB12 | LZE20T | Human | Esophagus | ESCC | 3.18e-05 | 1.52e-01 | 0.0662 |
| 54788 | DNAJB12 | LZE22T | Human | Esophagus | ESCC | 2.65e-07 | 2.91e-01 | 0.068 |
| 54788 | DNAJB12 | LZE24T | Human | Esophagus | ESCC | 1.93e-20 | 5.25e-01 | 0.0596 |
| 54788 | DNAJB12 | LZE6T | Human | Esophagus | ESCC | 1.57e-05 | 2.56e-01 | 0.0845 |
| 54788 | DNAJB12 | P1T-E | Human | Esophagus | ESCC | 9.96e-08 | 3.49e-01 | 0.0875 |
| 54788 | DNAJB12 | P2T-E | Human | Esophagus | ESCC | 3.92e-27 | 6.11e-01 | 0.1177 |
| 54788 | DNAJB12 | P4T-E | Human | Esophagus | ESCC | 2.26e-21 | 6.29e-01 | 0.1323 |
| 54788 | DNAJB12 | P5T-E | Human | Esophagus | ESCC | 4.70e-11 | 2.55e-01 | 0.1327 |
| 54788 | DNAJB12 | P8T-E | Human | Esophagus | ESCC | 1.72e-24 | 4.15e-01 | 0.0889 |
| 54788 | DNAJB12 | P9T-E | Human | Esophagus | ESCC | 1.55e-07 | 2.40e-01 | 0.1131 |
| 54788 | DNAJB12 | P10T-E | Human | Esophagus | ESCC | 1.25e-22 | 3.15e-01 | 0.116 |
| 54788 | DNAJB12 | P11T-E | Human | Esophagus | ESCC | 1.67e-18 | 7.76e-01 | 0.1426 |
| 54788 | DNAJB12 | P12T-E | Human | Esophagus | ESCC | 8.56e-29 | 6.50e-01 | 0.1122 |
| 54788 | DNAJB12 | P15T-E | Human | Esophagus | ESCC | 2.11e-20 | 4.89e-01 | 0.1149 |
| 54788 | DNAJB12 | P16T-E | Human | Esophagus | ESCC | 5.99e-22 | 5.02e-01 | 0.1153 |
| 54788 | DNAJB12 | P17T-E | Human | Esophagus | ESCC | 7.05e-10 | 4.49e-01 | 0.1278 |
| 54788 | DNAJB12 | P19T-E | Human | Esophagus | ESCC | 2.54e-09 | 5.25e-01 | 0.1662 |
| 54788 | DNAJB12 | P20T-E | Human | Esophagus | ESCC | 7.45e-24 | 4.20e-01 | 0.1124 |
| Page: 1 2 3 4 5 6 |
| Tissue | Expression Dynamics | Abbreviation |
| Esophagus | 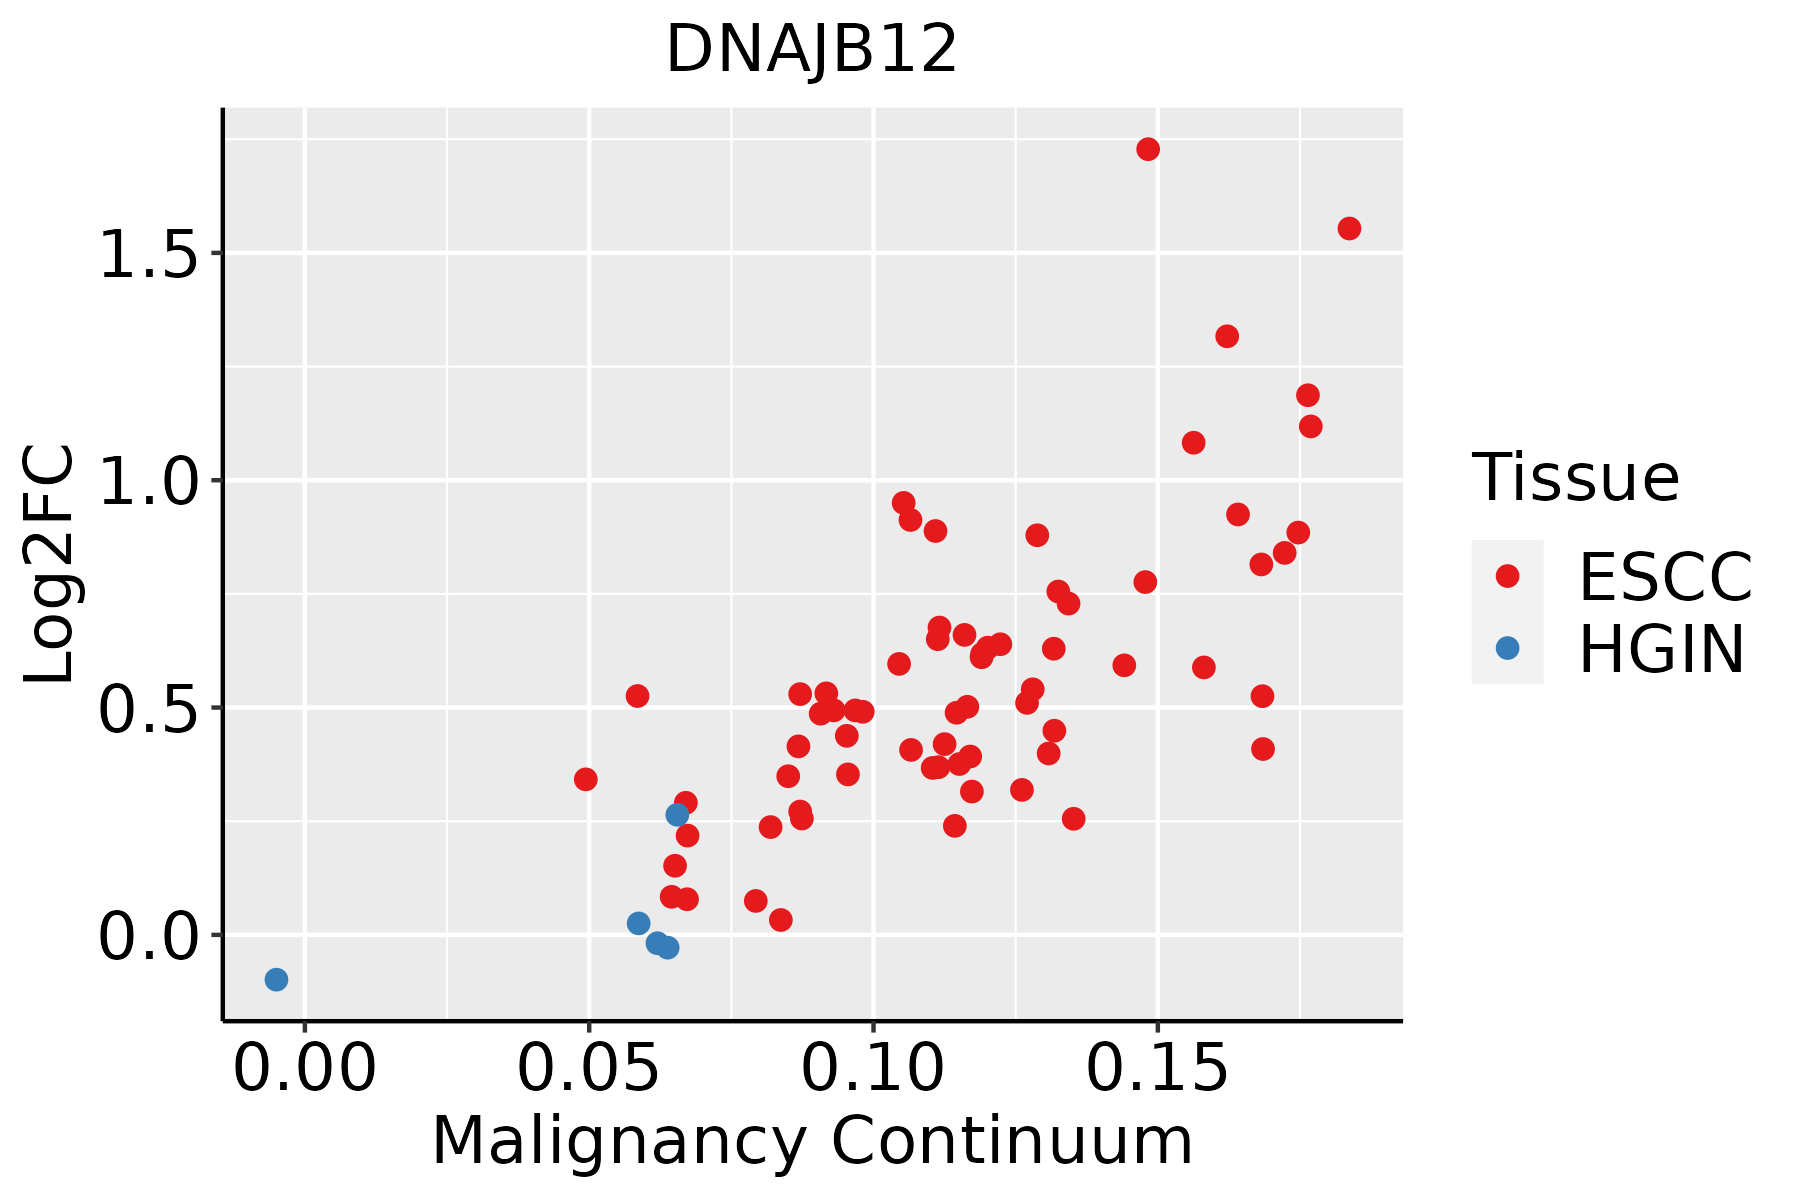 | ESCC: Esophageal squamous cell carcinoma |
| HGIN: High-grade intraepithelial neoplasias | ||
| LGIN: Low-grade intraepithelial neoplasias | ||
| Liver | 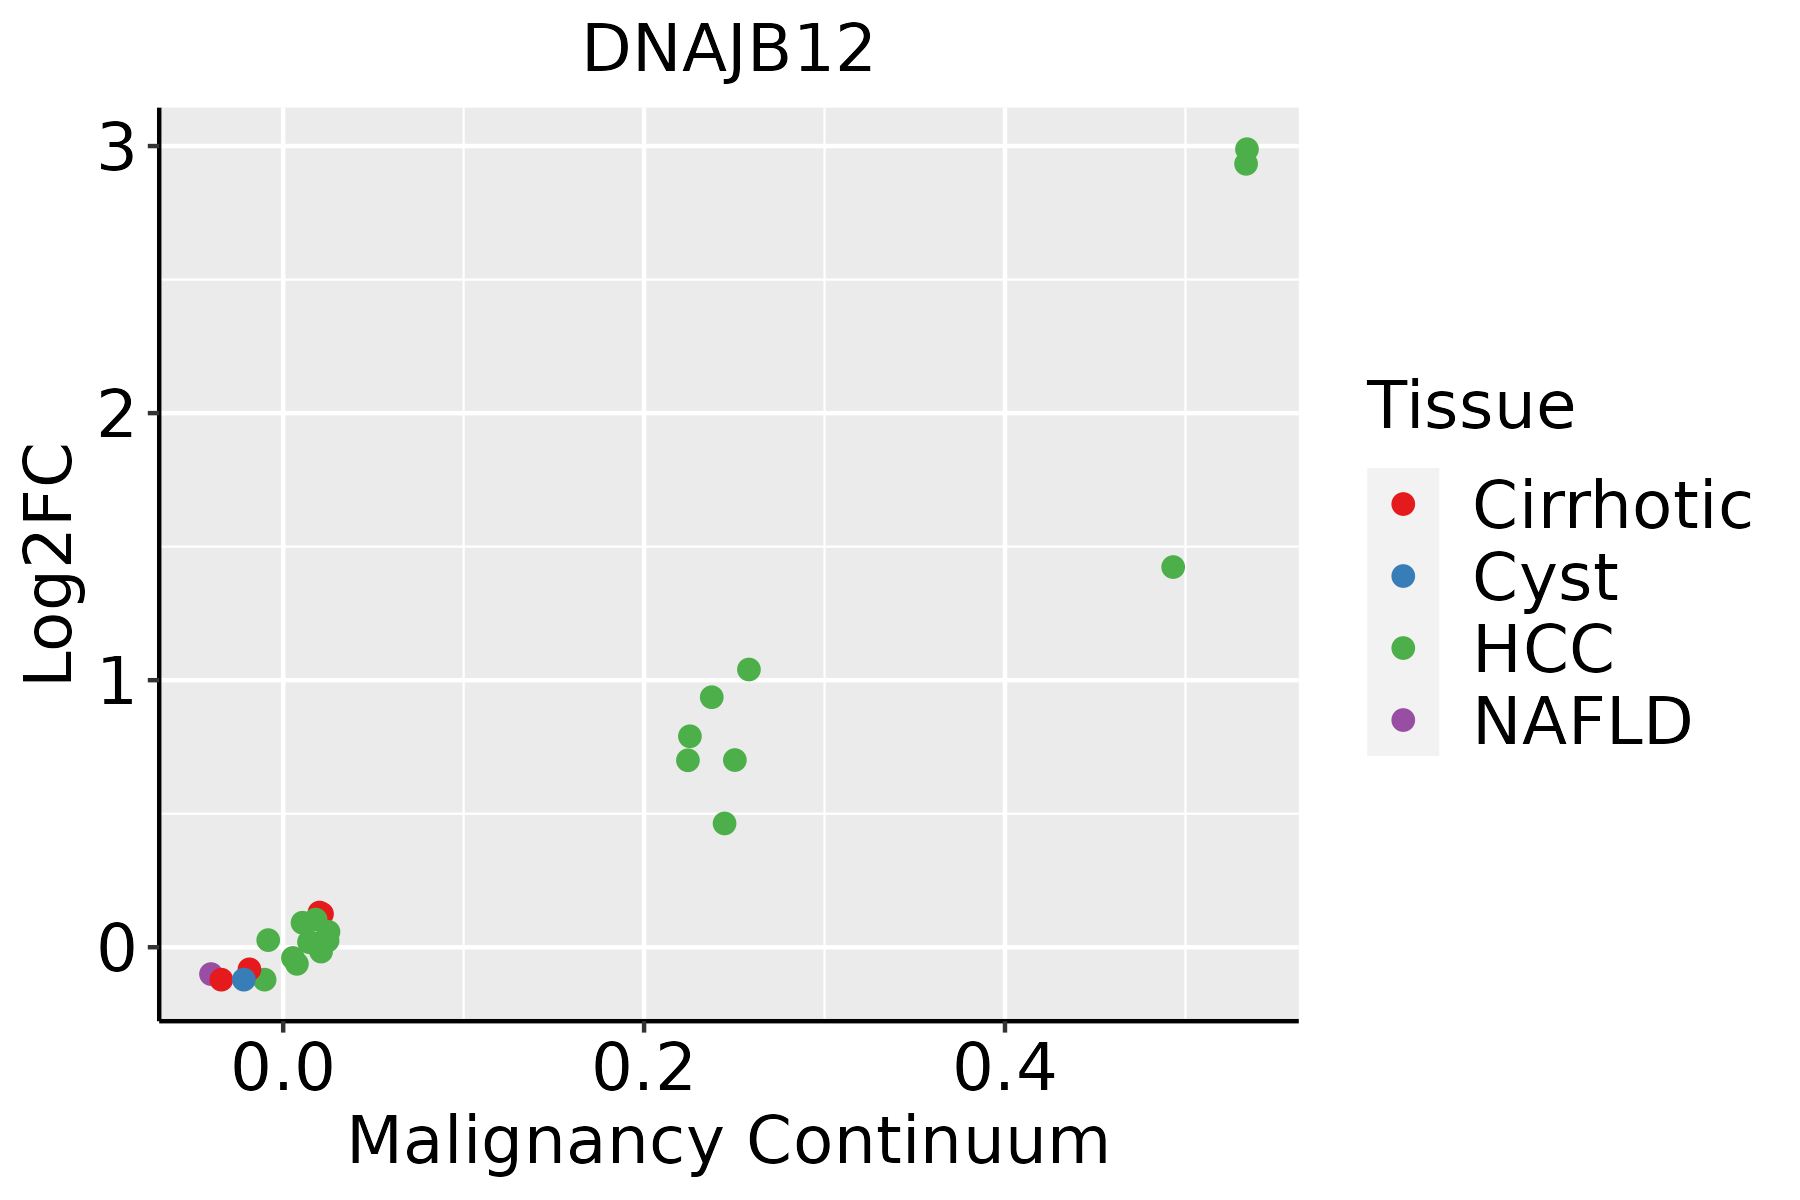 | HCC: Hepatocellular carcinoma |
| NAFLD: Non-alcoholic fatty liver disease | ||
| Oral Cavity | 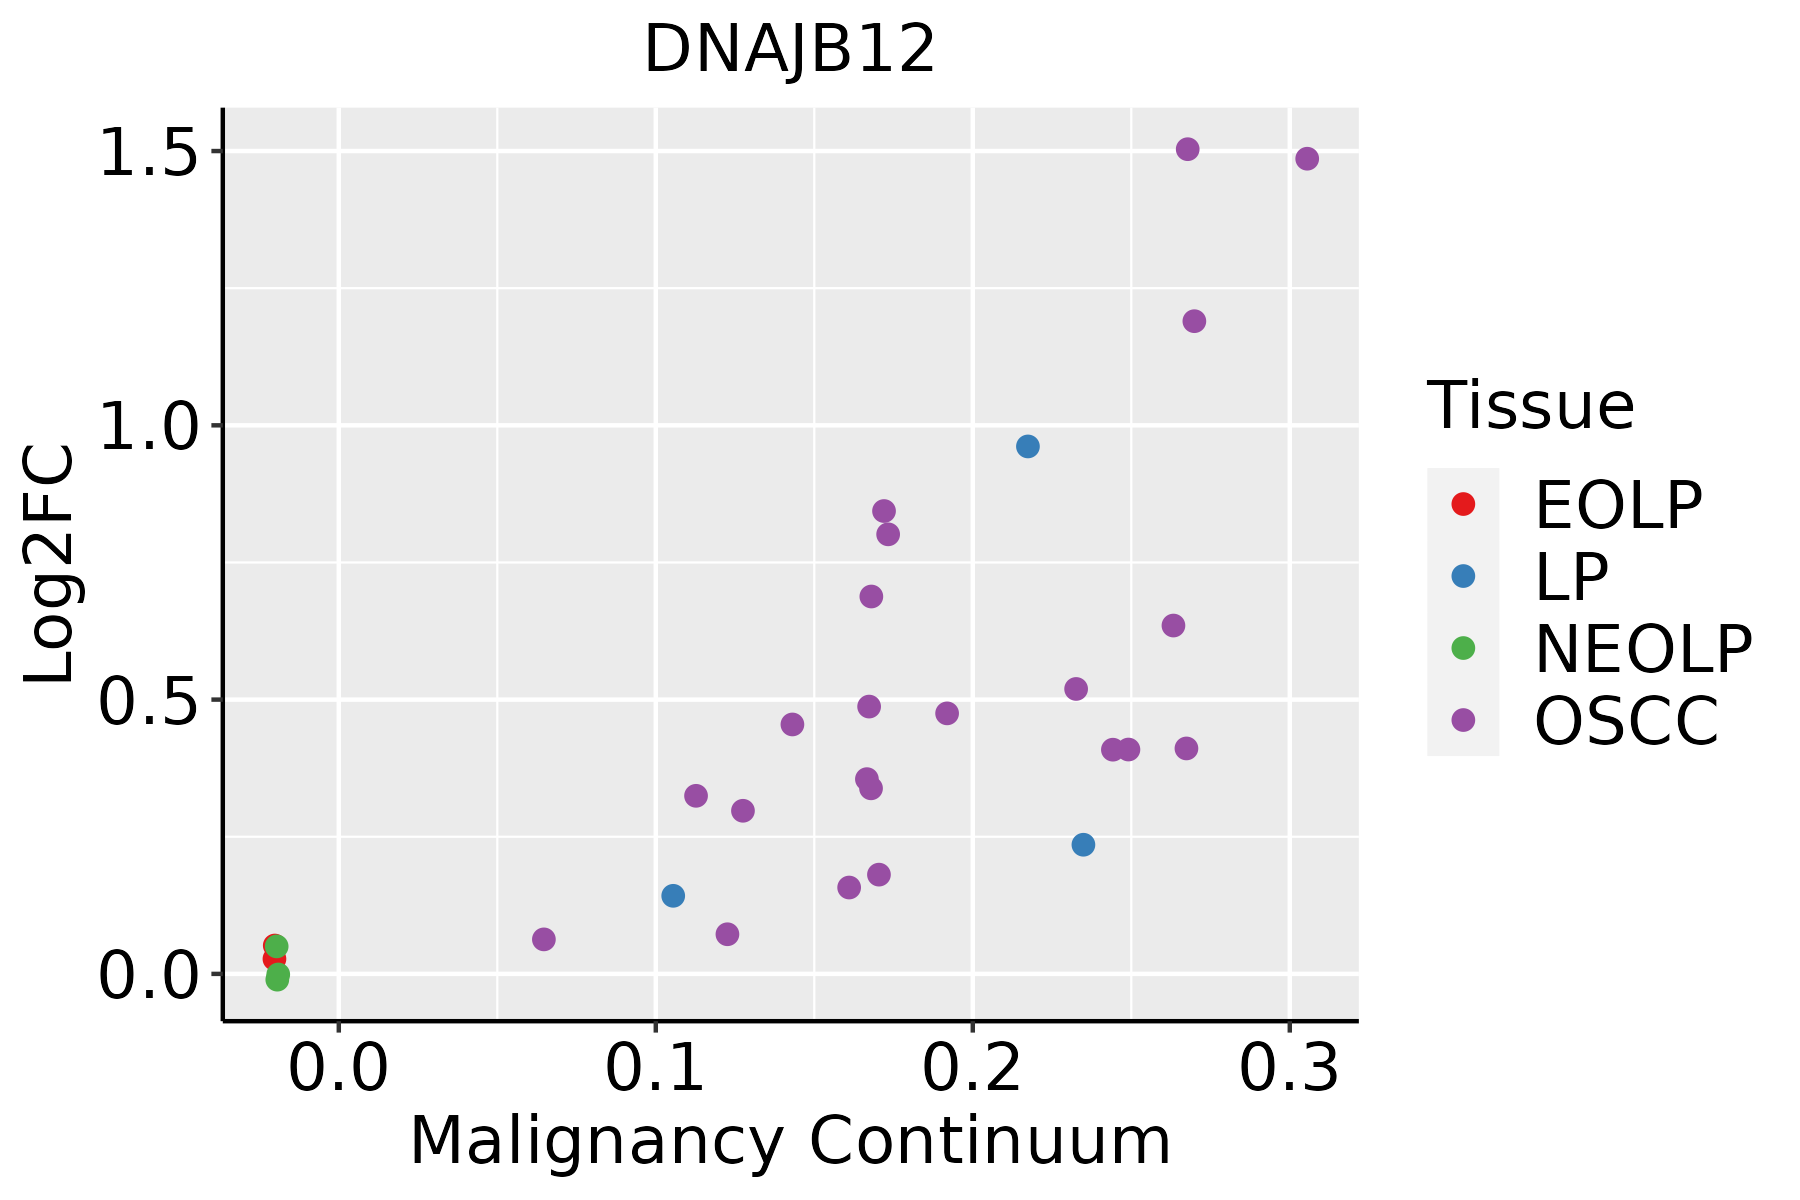 | EOLP: Erosive Oral lichen planus |
| LP: leukoplakia | ||
| NEOLP: Non-erosive oral lichen planus | ||
| OSCC: Oral squamous cell carcinoma | ||
| Skin |  | AK: Actinic keratosis |
| cSCC: Cutaneous squamous cell carcinoma | ||
| SCCIS:squamous cell carcinoma in situ | ||
| Thyroid | 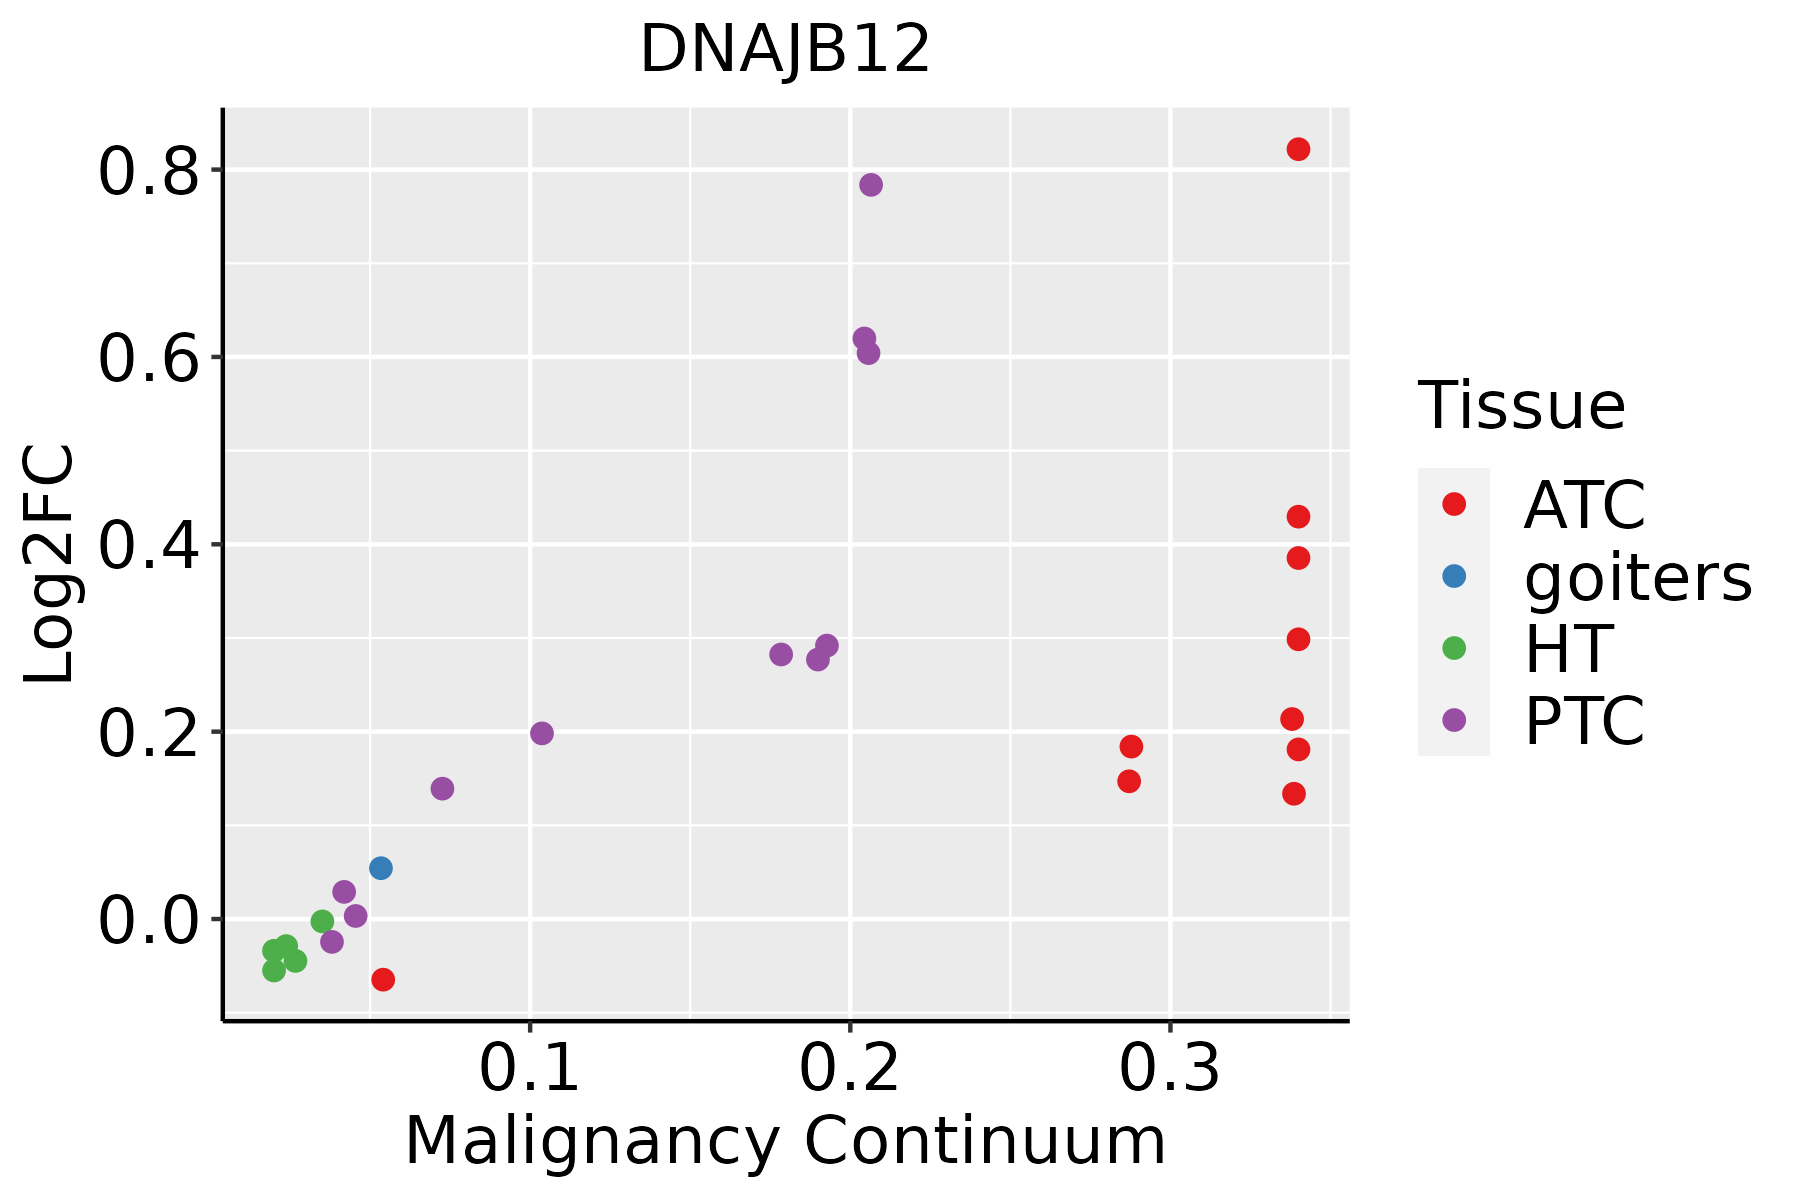 | ATC: Anaplastic thyroid cancer |
| HT: Hashimoto's thyroiditis | ||
| PTC: Papillary thyroid cancer |
| ∗log2FC in expression of this searched gene in stem-like cells from each diseased tissue sample relative to stem-like cells in normal samples in each tissue plotted against the malignancy continuum. Samples are colored based on if they are from different disease stage. |
Top |
Malignant transformation related pathway analysis |
| Find out the enriched GO biological processes and KEGG pathways involved in transition from healthy to precancer to cancer |
| Tissue | Disease Stage | Enriched GO biological Processes |
| Colorectum | AD |  |
| Colorectum | SER |  |
| Colorectum | MSS |  |
| Colorectum | MSI-H |  |
| Colorectum | FAP |  |
| ∗Top 15 enriched GO BP terms are showed in the bar plot of each disease state in each tissue. Each row represents a significant GO biological process which is colored according to the -log10(p.adjust). |
| Page: 1 2 3 4 5 6 7 8 9 |
| GO ID | Tissue | Disease Stage | Description | Gene Ratio | Bg Ratio | pvalue | p.adjust | Count |
| GO:0010498111 | Esophagus | ESCC | proteasomal protein catabolic process | 369/8552 | 490/18723 | 1.13e-41 | 1.80e-38 | 369 |
| GO:0043161111 | Esophagus | ESCC | proteasome-mediated ubiquitin-dependent protein catabolic process | 312/8552 | 412/18723 | 3.53e-36 | 4.48e-33 | 312 |
| GO:0034976111 | Esophagus | ESCC | response to endoplasmic reticulum stress | 192/8552 | 256/18723 | 7.15e-22 | 1.30e-19 | 192 |
| GO:0006457110 | Esophagus | ESCC | protein folding | 163/8552 | 212/18723 | 1.13e-20 | 1.74e-18 | 163 |
| GO:0035966111 | Esophagus | ESCC | response to topologically incorrect protein | 125/8552 | 159/18723 | 1.44e-17 | 1.27e-15 | 125 |
| GO:0035967111 | Esophagus | ESCC | cellular response to topologically incorrect protein | 90/8552 | 116/18723 | 1.94e-12 | 8.11e-11 | 90 |
| GO:003650315 | Esophagus | ESCC | ERAD pathway | 82/8552 | 107/18723 | 5.80e-11 | 1.84e-09 | 82 |
| GO:0061077110 | Esophagus | ESCC | chaperone-mediated protein folding | 56/8552 | 67/18723 | 1.52e-10 | 4.36e-09 | 56 |
| GO:003043314 | Esophagus | ESCC | ubiquitin-dependent ERAD pathway | 66/8552 | 85/18723 | 1.64e-09 | 3.78e-08 | 66 |
| GO:0006458110 | Esophagus | ESCC | 'de novo' protein folding | 36/8552 | 43/18723 | 2.90e-07 | 4.20e-06 | 36 |
| GO:0051084110 | Esophagus | ESCC | 'de novo' posttranslational protein folding | 32/8552 | 39/18723 | 3.27e-06 | 3.65e-05 | 32 |
| GO:0051085110 | Esophagus | ESCC | chaperone cofactor-dependent protein refolding | 27/8552 | 34/18723 | 6.01e-05 | 4.62e-04 | 27 |
| GO:00517884 | Esophagus | ESCC | response to misfolded protein | 21/8552 | 25/18723 | 9.12e-05 | 6.54e-04 | 21 |
| GO:00712184 | Esophagus | ESCC | cellular response to misfolded protein | 19/8552 | 23/18723 | 3.12e-04 | 1.85e-03 | 19 |
| GO:001049812 | Liver | Cirrhotic | proteasomal protein catabolic process | 216/4634 | 490/18723 | 2.52e-21 | 9.29e-19 | 216 |
| GO:00064577 | Liver | Cirrhotic | protein folding | 114/4634 | 212/18723 | 9.23e-20 | 2.31e-17 | 114 |
| GO:00349767 | Liver | Cirrhotic | response to endoplasmic reticulum stress | 130/4634 | 256/18723 | 1.72e-19 | 3.86e-17 | 130 |
| GO:004316112 | Liver | Cirrhotic | proteasome-mediated ubiquitin-dependent protein catabolic process | 184/4634 | 412/18723 | 4.52e-19 | 8.85e-17 | 184 |
| GO:00359667 | Liver | Cirrhotic | response to topologically incorrect protein | 91/4634 | 159/18723 | 2.07e-18 | 3.60e-16 | 91 |
| GO:00359677 | Liver | Cirrhotic | cellular response to topologically incorrect protein | 64/4634 | 116/18723 | 2.20e-12 | 1.62e-10 | 64 |
| Page: 1 2 3 4 5 6 |
| Pathway ID | Tissue | Disease Stage | Description | Gene Ratio | Bg Ratio | pvalue | p.adjust | qvalue | Count |
| hsa04141211 | Esophagus | ESCC | Protein processing in endoplasmic reticulum | 147/4205 | 174/8465 | 3.29e-22 | 1.10e-19 | 5.64e-20 | 147 |
| hsa04141310 | Esophagus | ESCC | Protein processing in endoplasmic reticulum | 147/4205 | 174/8465 | 3.29e-22 | 1.10e-19 | 5.64e-20 | 147 |
| hsa0414114 | Liver | Cirrhotic | Protein processing in endoplasmic reticulum | 114/2530 | 174/8465 | 1.16e-22 | 9.67e-21 | 5.96e-21 | 114 |
| hsa0414115 | Liver | Cirrhotic | Protein processing in endoplasmic reticulum | 114/2530 | 174/8465 | 1.16e-22 | 9.67e-21 | 5.96e-21 | 114 |
| hsa0414122 | Liver | HCC | Protein processing in endoplasmic reticulum | 146/4020 | 174/8465 | 7.34e-24 | 2.46e-21 | 1.37e-21 | 146 |
| hsa0414132 | Liver | HCC | Protein processing in endoplasmic reticulum | 146/4020 | 174/8465 | 7.34e-24 | 2.46e-21 | 1.37e-21 | 146 |
| hsa0414130 | Oral cavity | OSCC | Protein processing in endoplasmic reticulum | 143/3704 | 174/8465 | 6.82e-26 | 2.28e-23 | 1.16e-23 | 143 |
| hsa04141113 | Oral cavity | OSCC | Protein processing in endoplasmic reticulum | 143/3704 | 174/8465 | 6.82e-26 | 2.28e-23 | 1.16e-23 | 143 |
| hsa04141210 | Oral cavity | LP | Protein processing in endoplasmic reticulum | 113/2418 | 174/8465 | 8.74e-24 | 5.82e-22 | 3.76e-22 | 113 |
| hsa0414138 | Oral cavity | LP | Protein processing in endoplasmic reticulum | 113/2418 | 174/8465 | 8.74e-24 | 5.82e-22 | 3.76e-22 | 113 |
| Page: 1 |
Top |
Cell-cell communication analysis |
| Identification of potential cell-cell interactions between two cell types and their ligand-receptor pairs for different disease states |
| Ligand | Receptor | LRpair | Pathway | Tissue | Disease Stage |
| Page: 1 |
Top |
Single-cell gene regulatory network inference analysis |
| Find out the significant the regulons (TFs) and the target genes of each regulon across cell types for different disease states |
| TF | Cell Type | Tissue | Disease Stage | Target Gene | RSS | Regulon Activity |
| ∗The dot plots of a searched regulon are shown for all cell subpopulations in each disease state of each tissue based on the regulon specific score inferred using pySCENIC and by calculating the average expression. |
| Page: 1 |
Top |
Somatic mutation of malignant transformation related genes |
| Annotation of somatic variants for genes involved in malignant transformation |
| Hugo Symbol | Variant Class | Variant Classification | dbSNP RS | HGVSc | HGVSp | HGVSp Short | SWISSPROT | BIOTYPE | SIFT | PolyPhen | Tumor Sample Barcode | Tissue | Histology | Sex | Age | Stage | Therapy Types | Drugs | Outcome |
| DNAJB12 | SNV | Missense_Mutation | novel | c.344C>T | p.Ser115Leu | p.S115L | protein_coding | tolerated(0.11) | benign(0.092) | TCGA-AC-A3W6-01 | Breast | breast invasive carcinoma | Female | >=65 | III/IV | Unknown | Unknown | SD | |
| DNAJB12 | SNV | Missense_Mutation | novel | c.628G>A | p.Asp210Asn | p.D210N | protein_coding | tolerated(0.12) | possibly_damaging(0.535) | TCGA-AC-A5XS-01 | Breast | breast invasive carcinoma | Female | >=65 | I/II | Hormone Therapy | femara | SD | |
| DNAJB12 | SNV | Missense_Mutation | rs202084225 | c.1009N>A | p.Glu337Lys | p.E337K | protein_coding | tolerated(0.96) | benign(0.012) | TCGA-B6-A0RQ-01 | Breast | breast invasive carcinoma | Female | >=65 | I/II | Unknown | Unknown | SD | |
| DNAJB12 | SNV | Missense_Mutation | novel | c.1042N>C | p.Glu348Gln | p.E348Q | protein_coding | deleterious(0) | probably_damaging(0.958) | TCGA-E2-A574-01 | Breast | breast invasive carcinoma | Female | <65 | I/II | Chemotherapy | adriamycin | SD | |
| DNAJB12 | SNV | Missense_Mutation | novel | c.362N>A | p.Gly121Glu | p.G121E | protein_coding | tolerated(0.19) | possibly_damaging(0.691) | TCGA-DS-A1OB-01 | Cervix | cervical & endocervical cancer | Female | <65 | I/II | Chemotherapy | carboplatin | PD | |
| DNAJB12 | SNV | Missense_Mutation | novel | c.458G>A | p.Arg153Lys | p.R153K | protein_coding | tolerated(1) | benign(0.365) | TCGA-DS-A5RQ-01 | Cervix | cervical & endocervical cancer | Female | >=65 | I/II | Chemotherapy | cisplatin | CR | |
| DNAJB12 | SNV | Missense_Mutation | rs762040042 | c.778N>T | p.Arg260Cys | p.R260C | protein_coding | deleterious(0.04) | probably_damaging(0.954) | TCGA-A6-2686-01 | Colorectum | colon adenocarcinoma | Female | >=65 | I/II | Unknown | Unknown | SD | |
| DNAJB12 | SNV | Missense_Mutation | rs202084225 | c.1009N>A | p.Glu337Lys | p.E337K | protein_coding | tolerated(0.96) | benign(0.012) | TCGA-CM-6162-01 | Colorectum | colon adenocarcinoma | Female | <65 | III/IV | Chemotherapy | oxaliplatin | SD | |
| DNAJB12 | SNV | Missense_Mutation | c.1079N>A | p.Arg360Gln | p.R360Q | protein_coding | tolerated(0.25) | probably_damaging(0.976) | TCGA-G4-6586-01 | Colorectum | colon adenocarcinoma | Female | >=65 | I/II | Unknown | Unknown | SD | ||
| DNAJB12 | SNV | Missense_Mutation | c.1069G>A | p.Ala357Thr | p.A357T | protein_coding | tolerated(0.34) | probably_damaging(0.927) | TCGA-WS-AB45-01 | Colorectum | colon adenocarcinoma | Female | <65 | I/II | Unknown | Unknown | SD |
| Page: 1 2 3 4 |
Top |
Related drugs of malignant transformation related genes |
| Identification of chemicals and drugs interact with genes involved in malignant transfromation |
| (DGIdb 4.0) |
| Entrez ID | Symbol | Category | Interaction Types | Drug Claim Name | Drug Name | PMIDs |
| Page: 1 |

Copyright 2023-Present -The University of Texas Health Science Center at Houston |