
|
|||||
|
 | |
| |
| |
| |
| |
| |
|
Gene: DNAJB11 |
Gene summary for DNAJB11 |
| Gene information | Species | Human | Gene symbol | DNAJB11 | Gene ID | 51726 |
| Gene name | DnaJ heat shock protein family (Hsp40) member B11 | |
| Gene Alias | ABBP-2 | |
| Cytomap | 3q27.3 | |
| Gene Type | protein-coding | GO ID | GO:0006457 | UniProtAcc | Q9UBS4 |
Top |
Malignant transformation analysis |
| Identification of the aberrant gene expression in precancerous and cancerous lesions by comparing the gene expression of stem-like cells in diseased tissues with normal stem cells |
| Entrez ID | Symbol | Replicates | Species | Organ | Tissue | Adj P-value | Log2FC | Malignancy |
| 51726 | DNAJB11 | LZE2T | Human | Esophagus | ESCC | 1.35e-07 | 1.69e+00 | 0.082 |
| 51726 | DNAJB11 | LZE4T | Human | Esophagus | ESCC | 9.66e-34 | 1.17e+00 | 0.0811 |
| 51726 | DNAJB11 | LZE5T | Human | Esophagus | ESCC | 3.53e-03 | 9.33e-01 | 0.0514 |
| 51726 | DNAJB11 | LZE7T | Human | Esophagus | ESCC | 1.99e-14 | 1.26e+00 | 0.0667 |
| 51726 | DNAJB11 | LZE8T | Human | Esophagus | ESCC | 9.90e-11 | 5.55e-01 | 0.067 |
| 51726 | DNAJB11 | LZE20T | Human | Esophagus | ESCC | 1.95e-12 | 3.15e-01 | 0.0662 |
| 51726 | DNAJB11 | LZE22T | Human | Esophagus | ESCC | 2.70e-13 | 1.26e+00 | 0.068 |
| 51726 | DNAJB11 | LZE24T | Human | Esophagus | ESCC | 4.33e-40 | 1.24e+00 | 0.0596 |
| 51726 | DNAJB11 | LZE21T | Human | Esophagus | ESCC | 2.01e-10 | 1.32e+00 | 0.0655 |
| 51726 | DNAJB11 | LZE6T | Human | Esophagus | ESCC | 1.28e-09 | 8.51e-01 | 0.0845 |
| 51726 | DNAJB11 | P1T-E | Human | Esophagus | ESCC | 4.16e-08 | 1.17e+00 | 0.0875 |
| 51726 | DNAJB11 | P2T-E | Human | Esophagus | ESCC | 1.80e-99 | 1.94e+00 | 0.1177 |
| 51726 | DNAJB11 | P4T-E | Human | Esophagus | ESCC | 1.65e-70 | 2.05e+00 | 0.1323 |
| 51726 | DNAJB11 | P5T-E | Human | Esophagus | ESCC | 1.52e-50 | 1.19e+00 | 0.1327 |
| 51726 | DNAJB11 | P8T-E | Human | Esophagus | ESCC | 1.40e-43 | 9.24e-01 | 0.0889 |
| 51726 | DNAJB11 | P9T-E | Human | Esophagus | ESCC | 2.12e-38 | 1.17e+00 | 0.1131 |
| 51726 | DNAJB11 | P10T-E | Human | Esophagus | ESCC | 1.70e-70 | 1.30e+00 | 0.116 |
| 51726 | DNAJB11 | P11T-E | Human | Esophagus | ESCC | 6.13e-28 | 1.32e+00 | 0.1426 |
| 51726 | DNAJB11 | P12T-E | Human | Esophagus | ESCC | 5.15e-44 | 9.36e-01 | 0.1122 |
| 51726 | DNAJB11 | P15T-E | Human | Esophagus | ESCC | 5.12e-47 | 1.46e+00 | 0.1149 |
| Page: 1 2 3 4 5 6 7 8 |
| Tissue | Expression Dynamics | Abbreviation |
| Esophagus | 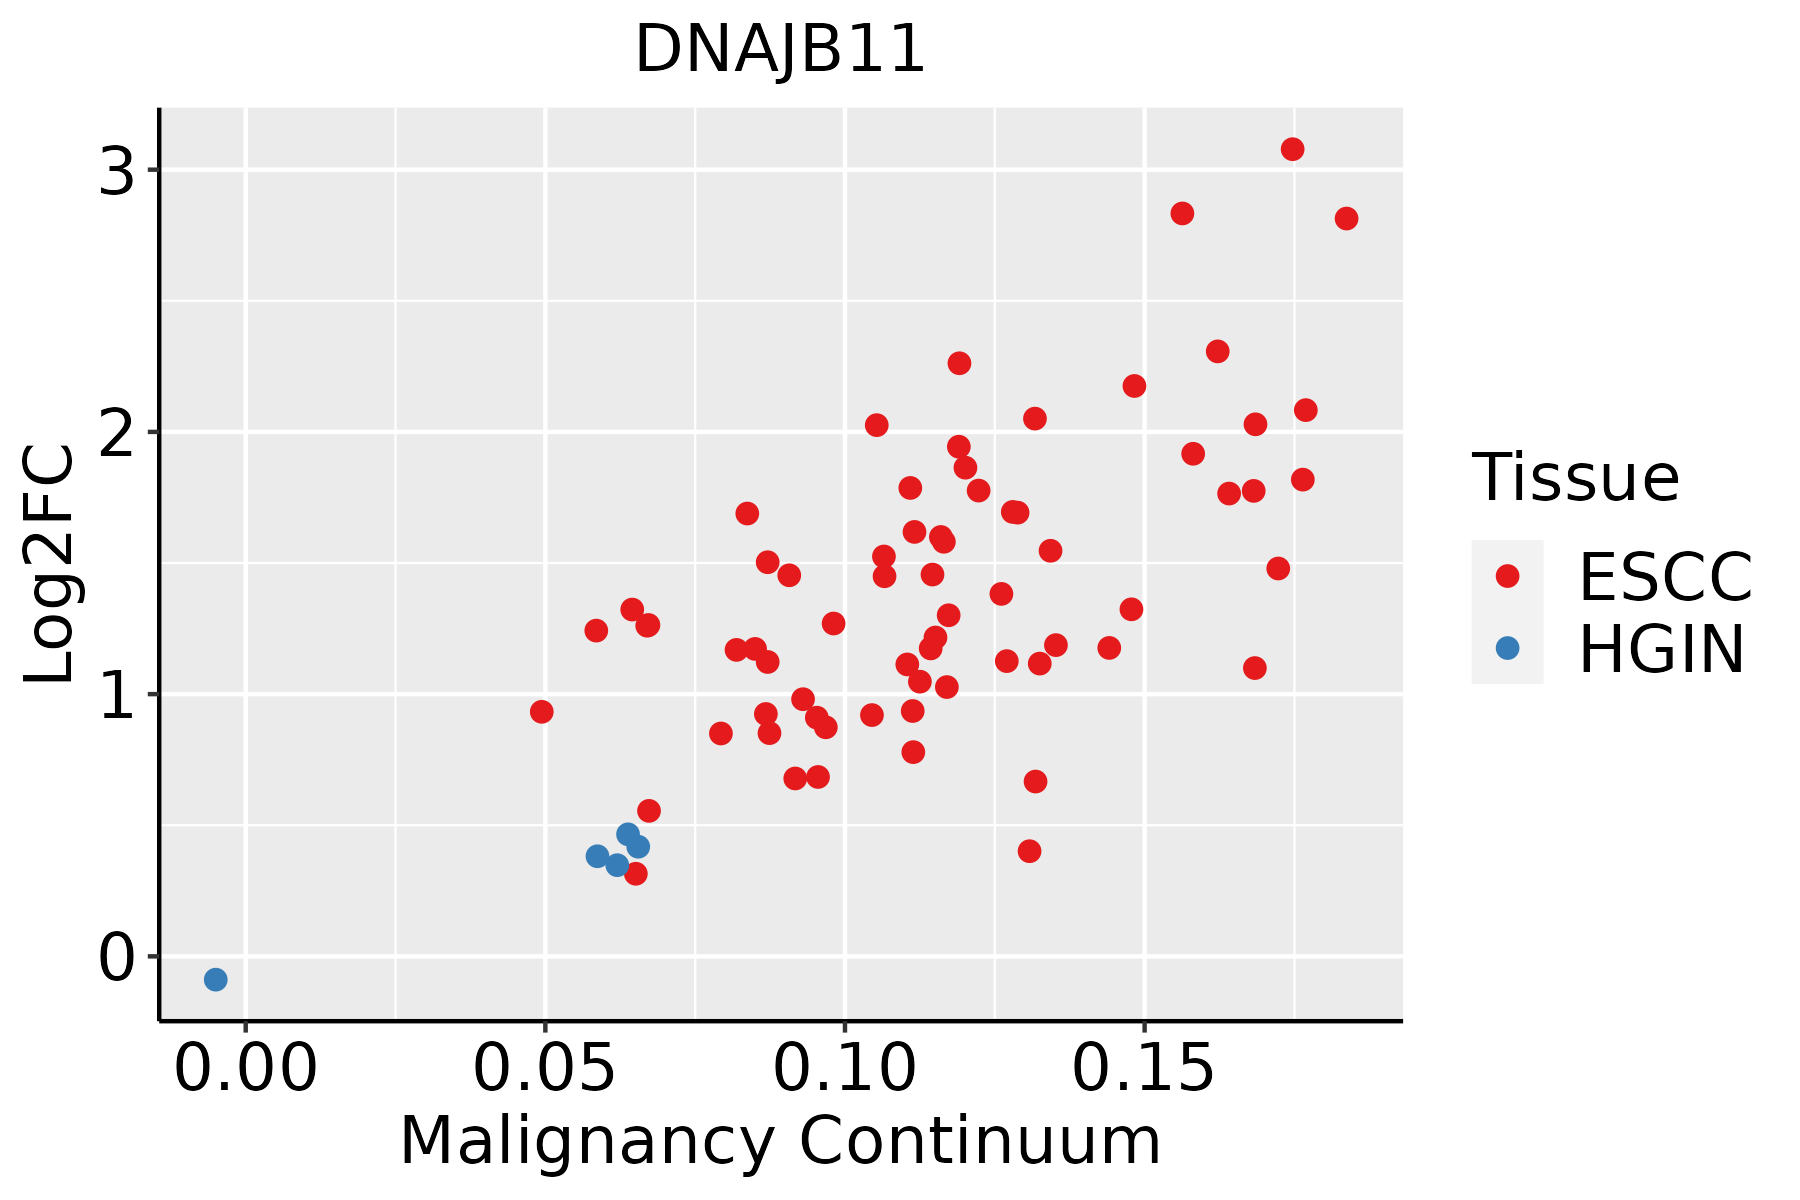 | ESCC: Esophageal squamous cell carcinoma |
| HGIN: High-grade intraepithelial neoplasias | ||
| LGIN: Low-grade intraepithelial neoplasias | ||
| Liver | 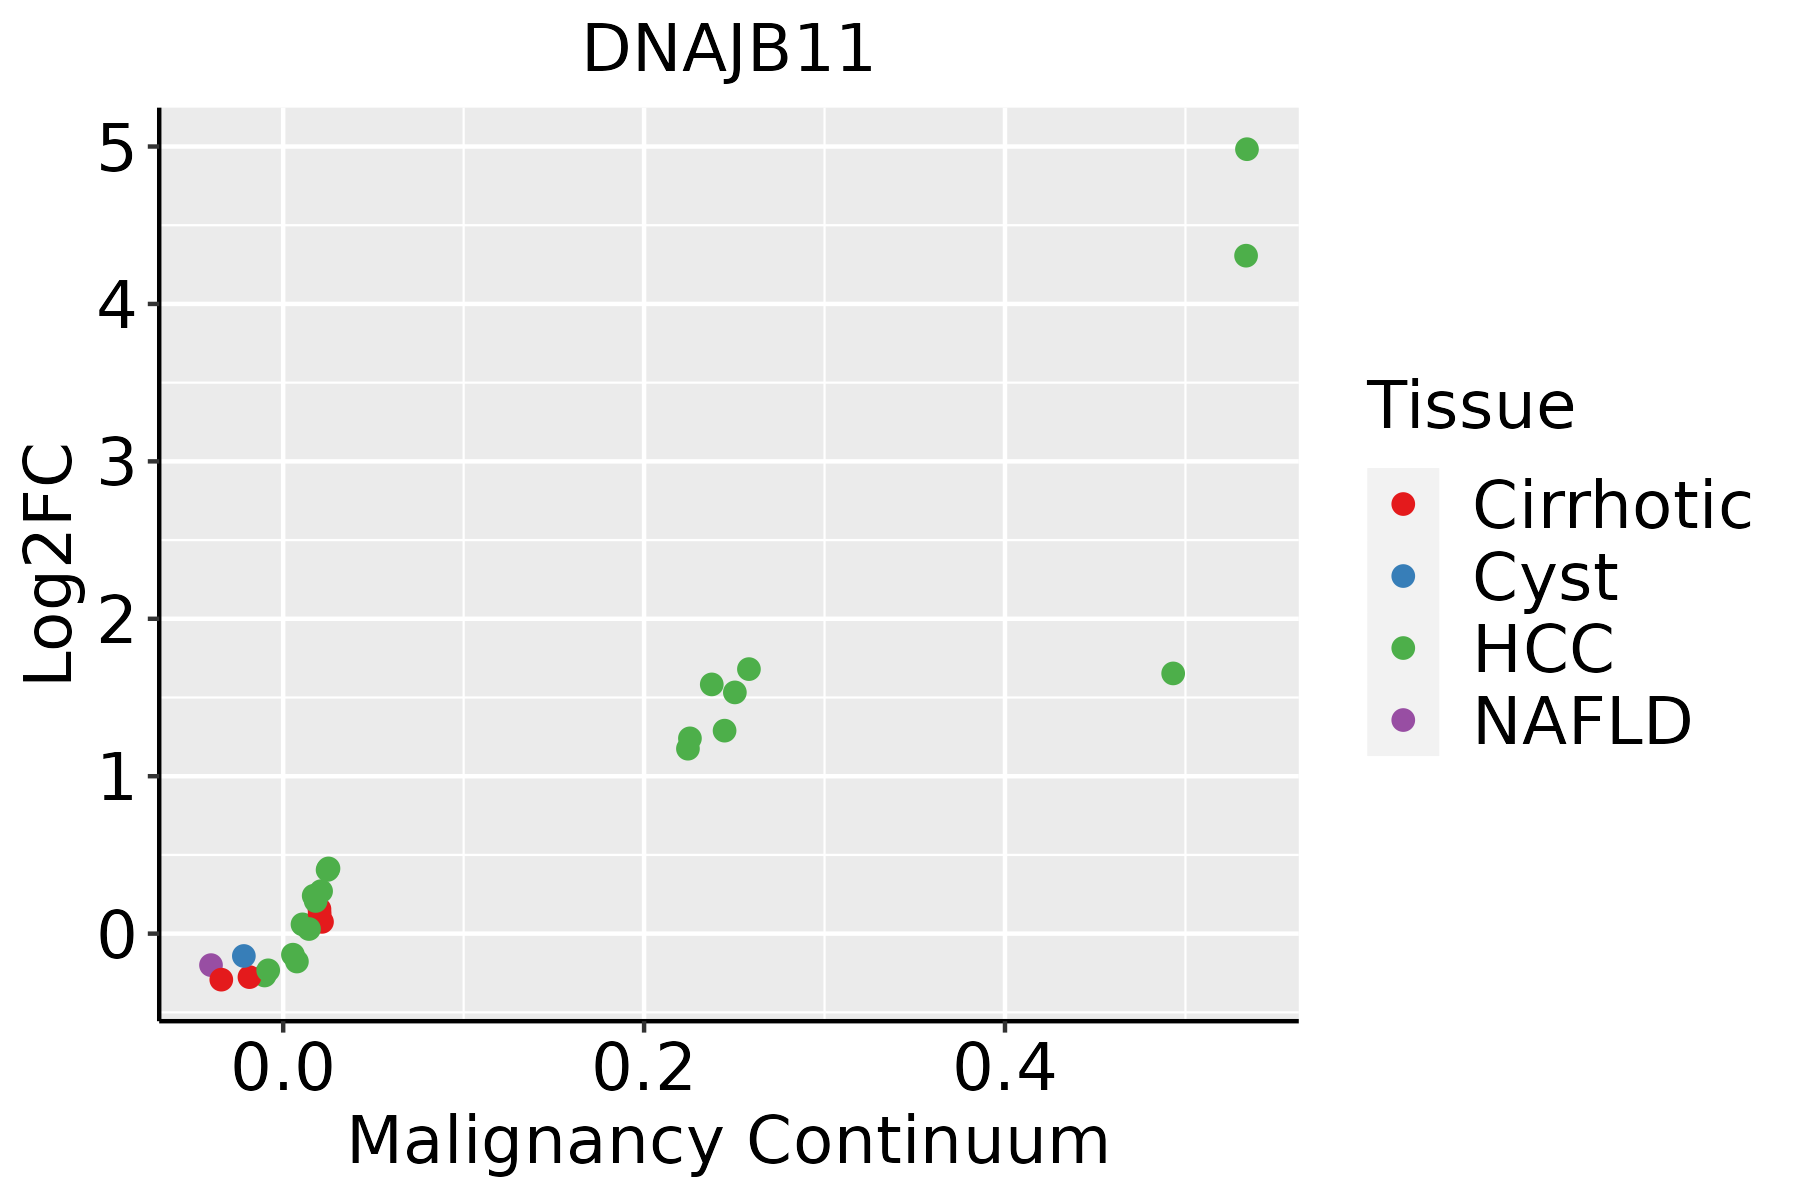 | HCC: Hepatocellular carcinoma |
| NAFLD: Non-alcoholic fatty liver disease | ||
| Oral Cavity | 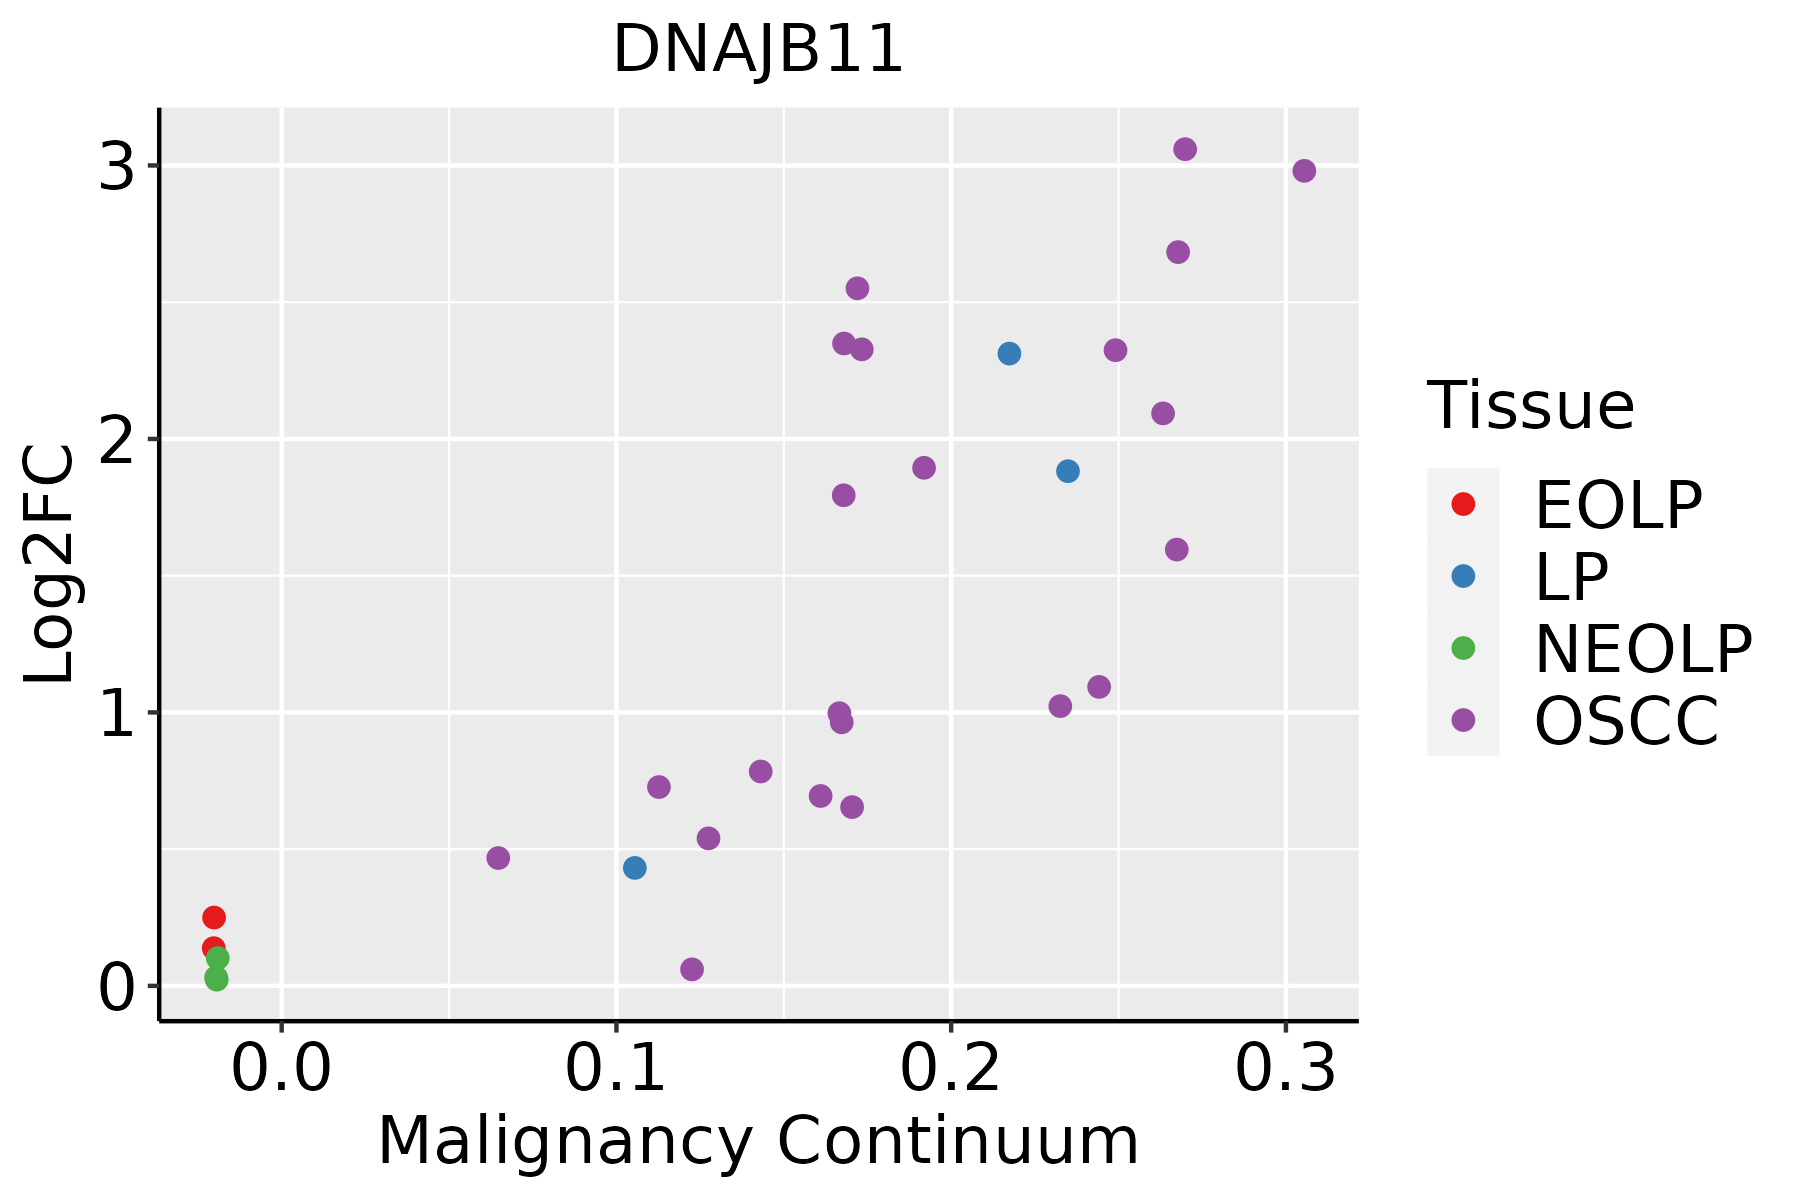 | EOLP: Erosive Oral lichen planus |
| LP: leukoplakia | ||
| NEOLP: Non-erosive oral lichen planus | ||
| OSCC: Oral squamous cell carcinoma | ||
| Prostate | 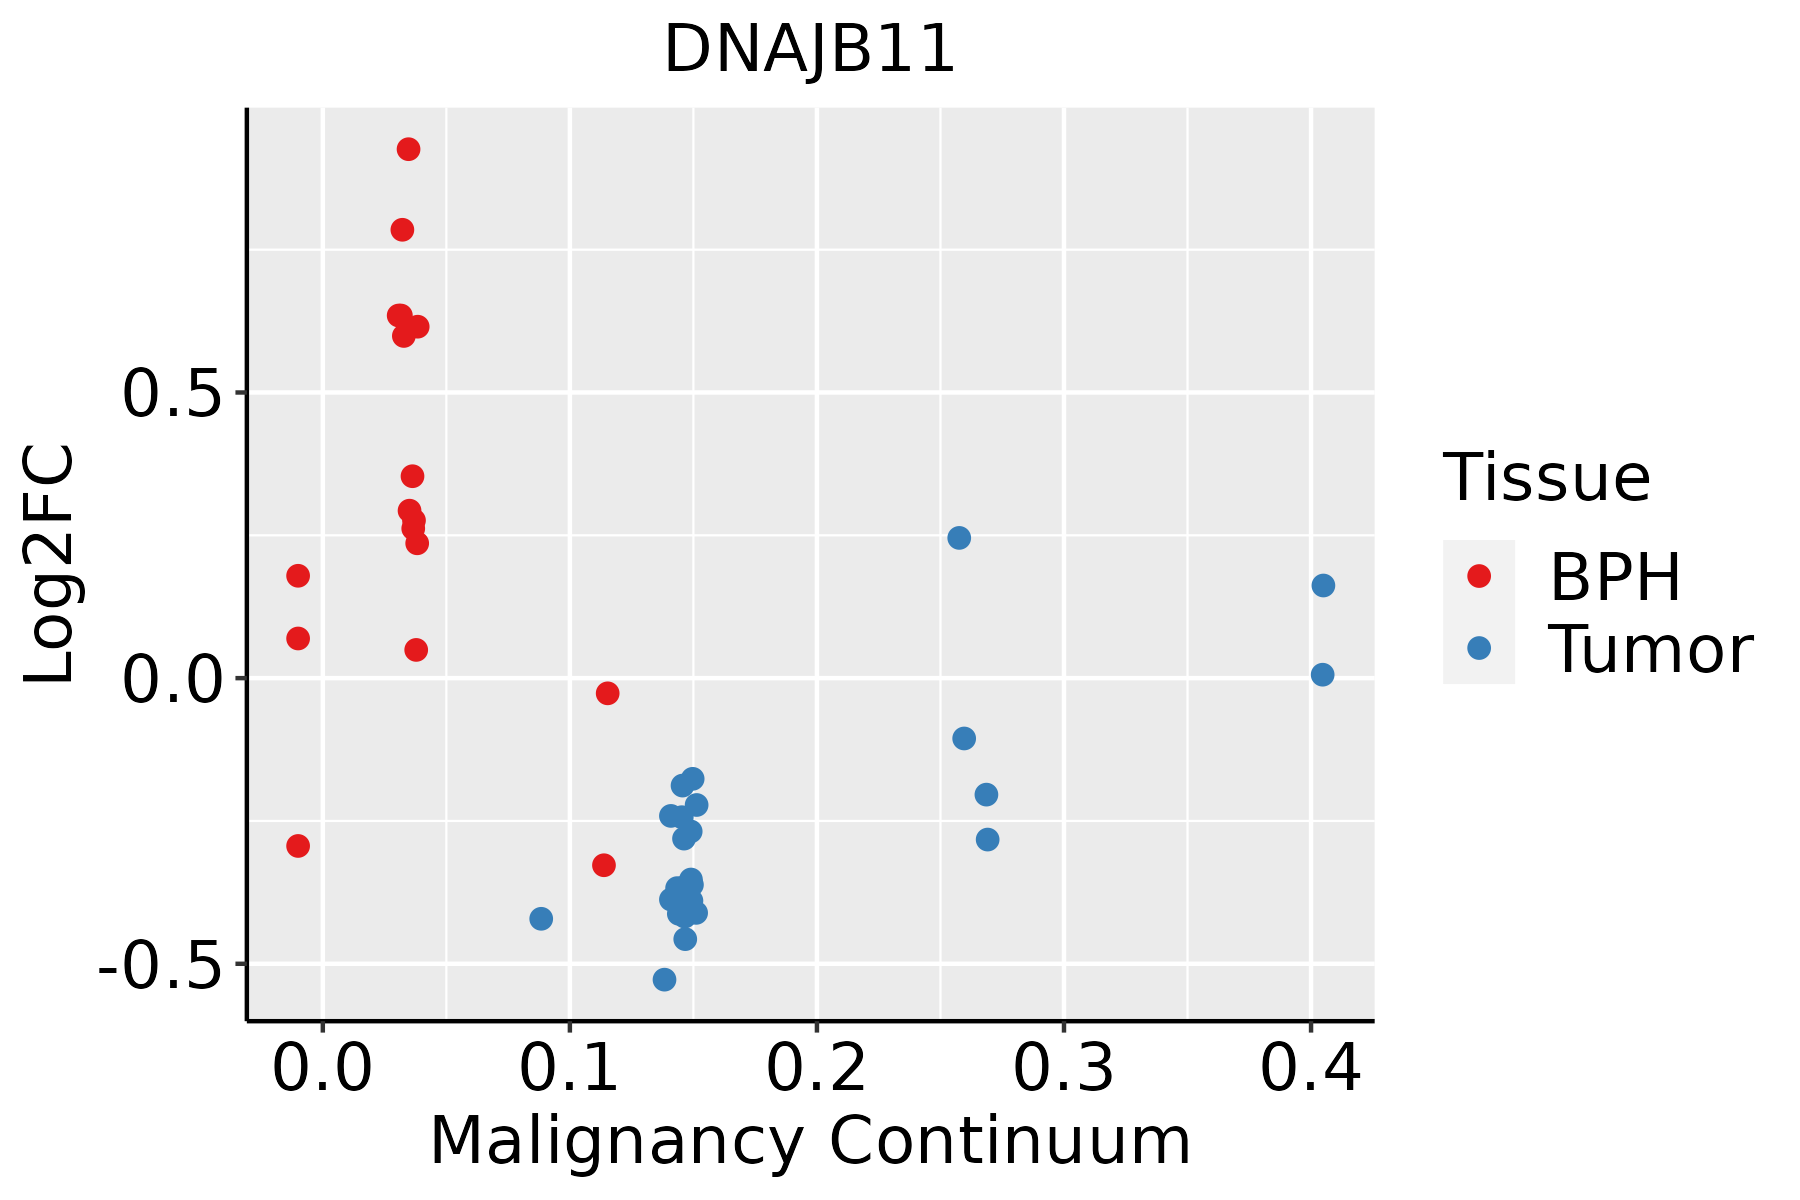 | BPH: Benign Prostatic Hyperplasia |
| Skin |  | AK: Actinic keratosis |
| cSCC: Cutaneous squamous cell carcinoma | ||
| SCCIS:squamous cell carcinoma in situ | ||
| Thyroid | 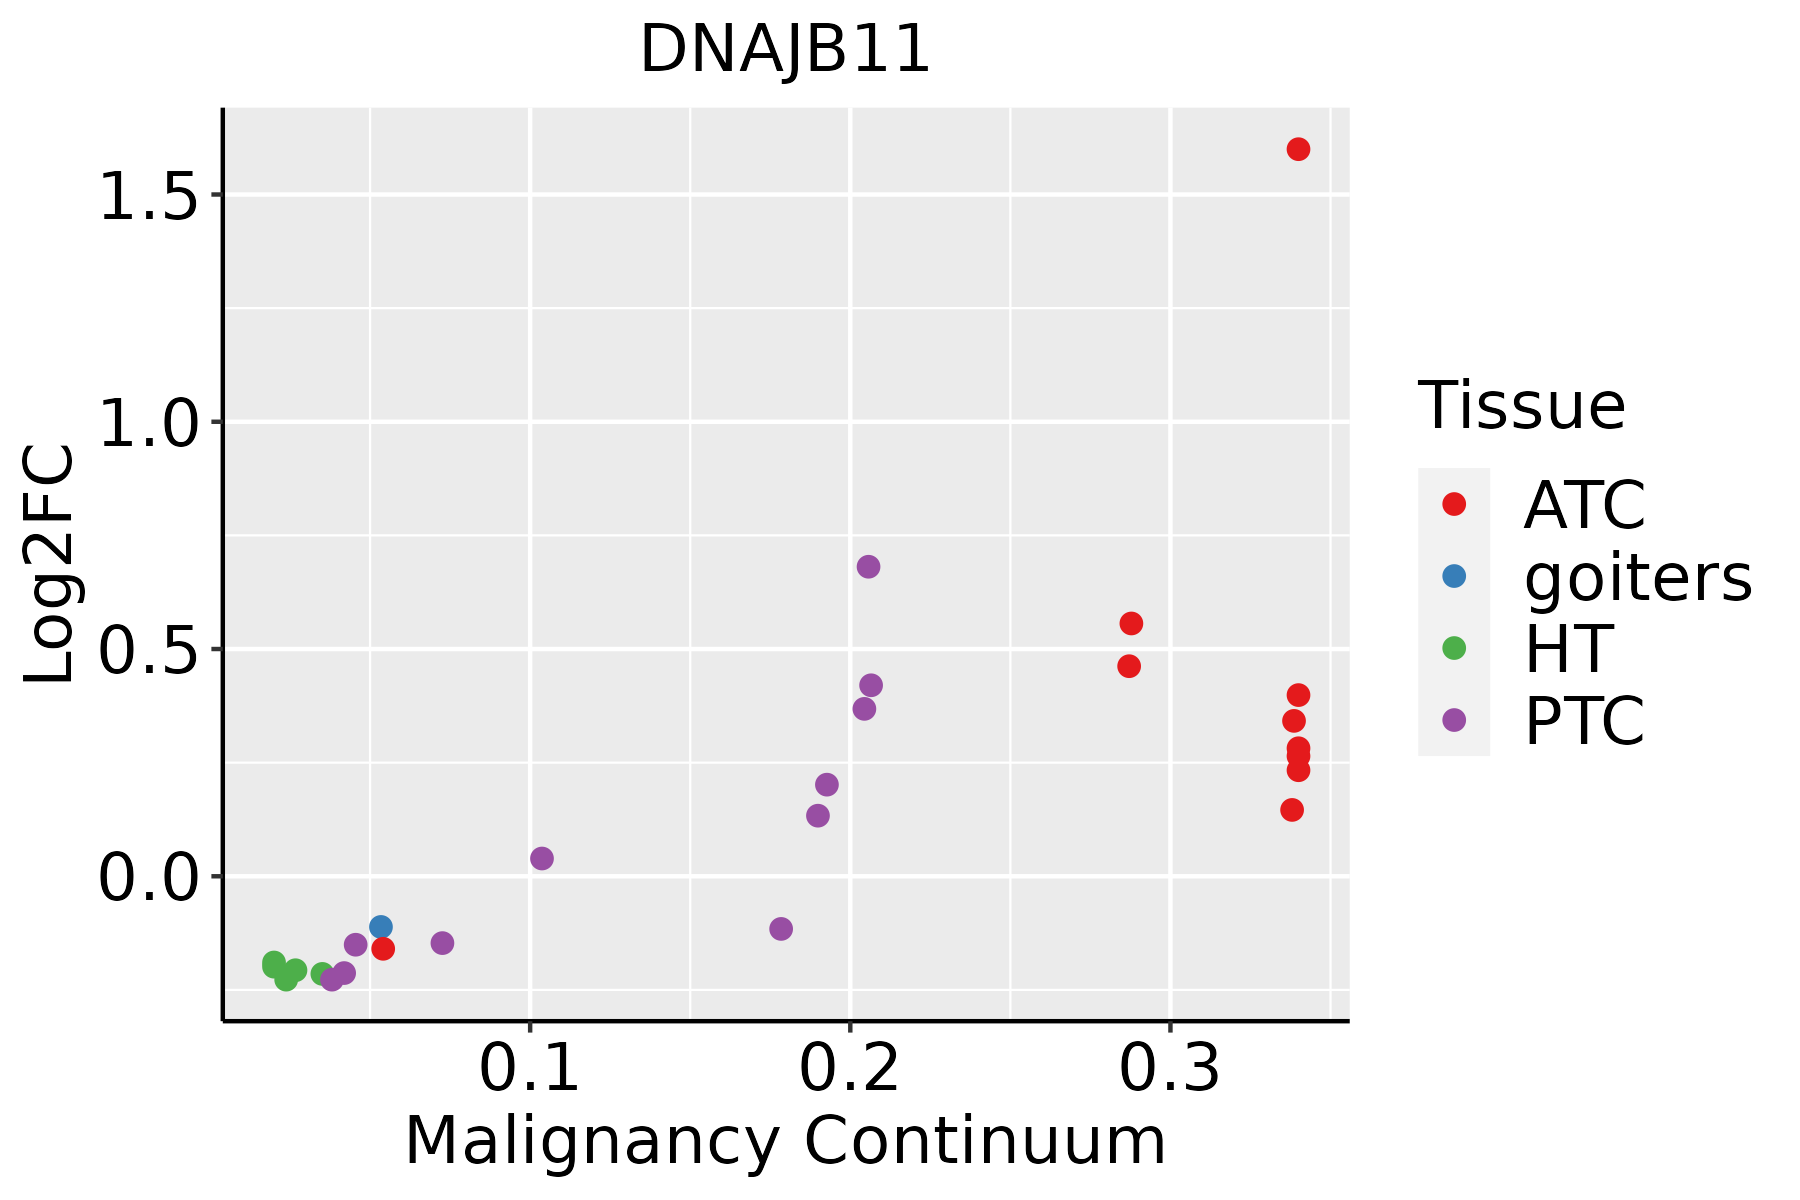 | ATC: Anaplastic thyroid cancer |
| HT: Hashimoto's thyroiditis | ||
| PTC: Papillary thyroid cancer |
| ∗log2FC in expression of this searched gene in stem-like cells from each diseased tissue sample relative to stem-like cells in normal samples in each tissue plotted against the malignancy continuum. Samples are colored based on if they are from different disease stage. |
Top |
Malignant transformation related pathway analysis |
| Find out the enriched GO biological processes and KEGG pathways involved in transition from healthy to precancer to cancer |
| Tissue | Disease Stage | Enriched GO biological Processes |
| Colorectum | AD |  |
| Colorectum | SER |  |
| Colorectum | MSS |  |
| Colorectum | MSI-H |  |
| Colorectum | FAP |  |
| ∗Top 15 enriched GO BP terms are showed in the bar plot of each disease state in each tissue. Each row represents a significant GO biological process which is colored according to the -log10(p.adjust). |
| Page: 1 2 3 4 5 6 7 8 9 |
| GO ID | Tissue | Disease Stage | Description | Gene Ratio | Bg Ratio | pvalue | p.adjust | Count |
| GO:0006457110 | Esophagus | ESCC | protein folding | 163/8552 | 212/18723 | 1.13e-20 | 1.74e-18 | 163 |
| GO:005160418 | Esophagus | ESCC | protein maturation | 189/8552 | 294/18723 | 7.64e-11 | 2.39e-09 | 189 |
| GO:00434627 | Esophagus | ESCC | regulation of ATPase activity | 30/8552 | 46/18723 | 5.91e-03 | 2.18e-02 | 30 |
| GO:00064577 | Liver | Cirrhotic | protein folding | 114/4634 | 212/18723 | 9.23e-20 | 2.31e-17 | 114 |
| GO:00516046 | Liver | Cirrhotic | protein maturation | 121/4634 | 294/18723 | 3.54e-10 | 1.68e-08 | 121 |
| GO:00327812 | Liver | Cirrhotic | positive regulation of ATPase activity | 16/4634 | 27/18723 | 1.41e-04 | 1.36e-03 | 16 |
| GO:00434623 | Liver | Cirrhotic | regulation of ATPase activity | 21/4634 | 46/18723 | 1.61e-03 | 1.04e-02 | 21 |
| GO:000645712 | Liver | HCC | protein folding | 160/7958 | 212/18723 | 1.07e-22 | 1.88e-20 | 160 |
| GO:005160412 | Liver | HCC | protein maturation | 171/7958 | 294/18723 | 3.80e-08 | 8.30e-07 | 171 |
| GO:00327811 | Liver | HCC | positive regulation of ATPase activity | 19/7958 | 27/18723 | 3.18e-03 | 1.47e-02 | 19 |
| GO:004346211 | Liver | HCC | regulation of ATPase activity | 29/7958 | 46/18723 | 3.95e-03 | 1.74e-02 | 29 |
| GO:000645718 | Oral cavity | OSCC | protein folding | 154/7305 | 212/18723 | 1.89e-23 | 4.60e-21 | 154 |
| GO:005160410 | Oral cavity | OSCC | protein maturation | 170/7305 | 294/18723 | 3.97e-11 | 1.28e-09 | 170 |
| GO:00327815 | Oral cavity | OSCC | positive regulation of ATPase activity | 18/7305 | 27/18723 | 3.34e-03 | 1.42e-02 | 18 |
| GO:00434626 | Oral cavity | OSCC | regulation of ATPase activity | 27/7305 | 46/18723 | 5.33e-03 | 2.07e-02 | 27 |
| GO:000645719 | Oral cavity | LP | protein folding | 125/4623 | 212/18723 | 1.62e-26 | 8.45e-24 | 125 |
| GO:005160416 | Oral cavity | LP | protein maturation | 122/4623 | 294/18723 | 1.37e-10 | 7.72e-09 | 122 |
| GO:003278113 | Oral cavity | LP | positive regulation of ATPase activity | 13/4623 | 27/18723 | 6.92e-03 | 3.96e-02 | 13 |
| GO:000645725 | Oral cavity | EOLP | protein folding | 59/2218 | 212/18723 | 1.76e-10 | 1.79e-08 | 59 |
| GO:005160423 | Oral cavity | EOLP | protein maturation | 50/2218 | 294/18723 | 5.32e-03 | 2.77e-02 | 50 |
| Page: 1 2 |
| Pathway ID | Tissue | Disease Stage | Description | Gene Ratio | Bg Ratio | pvalue | p.adjust | qvalue | Count |
| hsa04141211 | Esophagus | ESCC | Protein processing in endoplasmic reticulum | 147/4205 | 174/8465 | 3.29e-22 | 1.10e-19 | 5.64e-20 | 147 |
| hsa04141310 | Esophagus | ESCC | Protein processing in endoplasmic reticulum | 147/4205 | 174/8465 | 3.29e-22 | 1.10e-19 | 5.64e-20 | 147 |
| hsa0414114 | Liver | Cirrhotic | Protein processing in endoplasmic reticulum | 114/2530 | 174/8465 | 1.16e-22 | 9.67e-21 | 5.96e-21 | 114 |
| hsa0414115 | Liver | Cirrhotic | Protein processing in endoplasmic reticulum | 114/2530 | 174/8465 | 1.16e-22 | 9.67e-21 | 5.96e-21 | 114 |
| hsa0414122 | Liver | HCC | Protein processing in endoplasmic reticulum | 146/4020 | 174/8465 | 7.34e-24 | 2.46e-21 | 1.37e-21 | 146 |
| hsa0414132 | Liver | HCC | Protein processing in endoplasmic reticulum | 146/4020 | 174/8465 | 7.34e-24 | 2.46e-21 | 1.37e-21 | 146 |
| hsa0414130 | Oral cavity | OSCC | Protein processing in endoplasmic reticulum | 143/3704 | 174/8465 | 6.82e-26 | 2.28e-23 | 1.16e-23 | 143 |
| hsa04141113 | Oral cavity | OSCC | Protein processing in endoplasmic reticulum | 143/3704 | 174/8465 | 6.82e-26 | 2.28e-23 | 1.16e-23 | 143 |
| hsa04141210 | Oral cavity | LP | Protein processing in endoplasmic reticulum | 113/2418 | 174/8465 | 8.74e-24 | 5.82e-22 | 3.76e-22 | 113 |
| hsa0414138 | Oral cavity | LP | Protein processing in endoplasmic reticulum | 113/2418 | 174/8465 | 8.74e-24 | 5.82e-22 | 3.76e-22 | 113 |
| hsa0414145 | Oral cavity | EOLP | Protein processing in endoplasmic reticulum | 70/1218 | 174/8465 | 2.84e-17 | 3.06e-15 | 1.81e-15 | 70 |
| hsa0414155 | Oral cavity | EOLP | Protein processing in endoplasmic reticulum | 70/1218 | 174/8465 | 2.84e-17 | 3.06e-15 | 1.81e-15 | 70 |
| hsa0414162 | Oral cavity | NEOLP | Protein processing in endoplasmic reticulum | 49/1112 | 174/8465 | 9.02e-08 | 1.37e-06 | 8.59e-07 | 49 |
| hsa0414172 | Oral cavity | NEOLP | Protein processing in endoplasmic reticulum | 49/1112 | 174/8465 | 9.02e-08 | 1.37e-06 | 8.59e-07 | 49 |
| hsa0414128 | Prostate | BPH | Protein processing in endoplasmic reticulum | 97/1718 | 174/8465 | 2.37e-25 | 1.30e-23 | 8.07e-24 | 97 |
| hsa04141112 | Prostate | BPH | Protein processing in endoplasmic reticulum | 97/1718 | 174/8465 | 2.37e-25 | 1.30e-23 | 8.07e-24 | 97 |
| hsa0414129 | Prostate | Tumor | Protein processing in endoplasmic reticulum | 99/1791 | 174/8465 | 2.58e-25 | 1.71e-23 | 1.06e-23 | 99 |
| hsa0414137 | Prostate | Tumor | Protein processing in endoplasmic reticulum | 99/1791 | 174/8465 | 2.58e-25 | 1.71e-23 | 1.06e-23 | 99 |
| Page: 1 |
Top |
Cell-cell communication analysis |
| Identification of potential cell-cell interactions between two cell types and their ligand-receptor pairs for different disease states |
| Ligand | Receptor | LRpair | Pathway | Tissue | Disease Stage |
| Page: 1 |
Top |
Single-cell gene regulatory network inference analysis |
| Find out the significant the regulons (TFs) and the target genes of each regulon across cell types for different disease states |
| TF | Cell Type | Tissue | Disease Stage | Target Gene | RSS | Regulon Activity |
| ∗The dot plots of a searched regulon are shown for all cell subpopulations in each disease state of each tissue based on the regulon specific score inferred using pySCENIC and by calculating the average expression. |
| Page: 1 |
Top |
Somatic mutation of malignant transformation related genes |
| Annotation of somatic variants for genes involved in malignant transformation |
| Hugo Symbol | Variant Class | Variant Classification | dbSNP RS | HGVSc | HGVSp | HGVSp Short | SWISSPROT | BIOTYPE | SIFT | PolyPhen | Tumor Sample Barcode | Tissue | Histology | Sex | Age | Stage | Therapy Types | Drugs | Outcome |
| DNAJB11 | SNV | Missense_Mutation | novel | c.59T>C | p.Val20Ala | p.V20A | Q9UBS4 | protein_coding | tolerated(0.55) | benign(0) | TCGA-2W-A8YY-01 | Cervix | cervical & endocervical cancer | Female | <65 | I/II | Chemotherapy | cisplatin | CR |
| DNAJB11 | SNV | Missense_Mutation | c.1015N>G | p.Ile339Val | p.I339V | Q9UBS4 | protein_coding | tolerated(0.14) | benign(0.003) | TCGA-C5-A1MH-01 | Cervix | cervical & endocervical cancer | Female | >=65 | III/IV | Chemotherapy | cisplatin | PD | |
| DNAJB11 | SNV | Missense_Mutation | novel | c.985N>C | p.Glu329Gln | p.E329Q | Q9UBS4 | protein_coding | tolerated(0.5) | benign(0.026) | TCGA-VS-A8EI-01 | Cervix | cervical & endocervical cancer | Female | <65 | I/II | Chemotherapy | cisplatin | CR |
| DNAJB11 | SNV | Missense_Mutation | rs745390980 | c.499N>T | p.Arg167Trp | p.R167W | Q9UBS4 | protein_coding | deleterious(0.01) | possibly_damaging(0.755) | TCGA-AA-3821-01 | Colorectum | colon adenocarcinoma | Female | >=65 | I/II | Unknown | Unknown | SD |
| DNAJB11 | SNV | Missense_Mutation | c.106G>T | p.Ala36Ser | p.A36S | Q9UBS4 | protein_coding | deleterious(0) | probably_damaging(0.999) | TCGA-G4-6310-01 | Colorectum | colon adenocarcinoma | Male | >=65 | III/IV | Chemotherapy | 5-fu | SD | |
| DNAJB11 | SNV | Missense_Mutation | novel | c.259N>A | p.Asp87Asn | p.D87N | Q9UBS4 | protein_coding | tolerated(0.06) | probably_damaging(0.965) | TCGA-A5-A0G1-01 | Endometrium | uterine corpus endometrioid carcinoma | Female | >=65 | I/II | Unknown | Unknown | SD |
| DNAJB11 | SNV | Missense_Mutation | novel | c.719N>A | p.Arg240Gln | p.R240Q | Q9UBS4 | protein_coding | tolerated(0.23) | benign(0.026) | TCGA-A5-A1OF-01 | Endometrium | uterine corpus endometrioid carcinoma | Female | <65 | I/II | Unknown | Unknown | SD |
| DNAJB11 | SNV | Missense_Mutation | rs773690271 | c.725N>A | p.Arg242Gln | p.R242Q | Q9UBS4 | protein_coding | tolerated(0.18) | benign(0.042) | TCGA-A5-A2K5-01 | Endometrium | uterine corpus endometrioid carcinoma | Female | >=65 | I/II | Unknown | Unknown | SD |
| DNAJB11 | SNV | Missense_Mutation | rs201669927 | c.865N>T | p.Arg289Trp | p.R289W | Q9UBS4 | protein_coding | deleterious(0) | probably_damaging(0.998) | TCGA-A5-A2K5-01 | Endometrium | uterine corpus endometrioid carcinoma | Female | >=65 | I/II | Unknown | Unknown | SD |
| DNAJB11 | SNV | Missense_Mutation | c.76T>G | p.Phe26Val | p.F26V | Q9UBS4 | protein_coding | deleterious(0) | possibly_damaging(0.908) | TCGA-AP-A056-01 | Endometrium | uterine corpus endometrioid carcinoma | Female | <65 | I/II | Unknown | Unknown | SD |
| Page: 1 2 3 4 |
Top |
Related drugs of malignant transformation related genes |
| Identification of chemicals and drugs interact with genes involved in malignant transfromation |
| (DGIdb 4.0) |
| Entrez ID | Symbol | Category | Interaction Types | Drug Claim Name | Drug Name | PMIDs |
| Page: 1 |

Copyright 2023-Present -The University of Texas Health Science Center at Houston |