
|
|||||
|
 | |
| |
| |
| |
| |
| |
|
Gene: DNAJA4 |
Gene summary for DNAJA4 |
| Gene information | Species | Human | Gene symbol | DNAJA4 | Gene ID | 55466 |
| Gene name | DnaJ heat shock protein family (Hsp40) member A4 | |
| Gene Alias | MST104 | |
| Cytomap | 15q25.1 | |
| Gene Type | protein-coding | GO ID | GO:0001667 | UniProtAcc | Q69YX3 |
Top |
Malignant transformation analysis |
| Identification of the aberrant gene expression in precancerous and cancerous lesions by comparing the gene expression of stem-like cells in diseased tissues with normal stem cells |
| Entrez ID | Symbol | Replicates | Species | Organ | Tissue | Adj P-value | Log2FC | Malignancy |
| 55466 | DNAJA4 | CA_HPV_2 | Human | Cervix | CC | 7.11e-03 | 2.59e-01 | 0.0391 |
| 55466 | DNAJA4 | sample1 | Human | Cervix | CC | 1.24e-07 | 6.47e-01 | 0.0959 |
| 55466 | DNAJA4 | T1 | Human | Cervix | CC | 2.20e-15 | 6.47e-01 | 0.0918 |
| 55466 | DNAJA4 | LZE2T | Human | Esophagus | ESCC | 5.16e-03 | 1.84e-01 | 0.082 |
| 55466 | DNAJA4 | LZE4T | Human | Esophagus | ESCC | 1.49e-11 | 7.58e-01 | 0.0811 |
| 55466 | DNAJA4 | LZE7T | Human | Esophagus | ESCC | 1.37e-02 | 3.24e-01 | 0.0667 |
| 55466 | DNAJA4 | LZE8T | Human | Esophagus | ESCC | 1.72e-08 | 4.17e-03 | 0.067 |
| 55466 | DNAJA4 | LZE22T | Human | Esophagus | ESCC | 4.57e-03 | 2.08e-01 | 0.068 |
| 55466 | DNAJA4 | LZE24T | Human | Esophagus | ESCC | 8.44e-05 | 1.45e-01 | 0.0596 |
| 55466 | DNAJA4 | P1T-E | Human | Esophagus | ESCC | 1.07e-02 | 4.68e-01 | 0.0875 |
| 55466 | DNAJA4 | P2T-E | Human | Esophagus | ESCC | 6.45e-13 | 5.30e-02 | 0.1177 |
| 55466 | DNAJA4 | P4T-E | Human | Esophagus | ESCC | 1.87e-37 | 1.04e+00 | 0.1323 |
| 55466 | DNAJA4 | P5T-E | Human | Esophagus | ESCC | 2.34e-12 | 1.72e-01 | 0.1327 |
| 55466 | DNAJA4 | P8T-E | Human | Esophagus | ESCC | 3.26e-22 | 3.18e-01 | 0.0889 |
| 55466 | DNAJA4 | P9T-E | Human | Esophagus | ESCC | 2.05e-11 | 2.55e-01 | 0.1131 |
| 55466 | DNAJA4 | P10T-E | Human | Esophagus | ESCC | 2.56e-09 | 8.72e-02 | 0.116 |
| 55466 | DNAJA4 | P11T-E | Human | Esophagus | ESCC | 1.69e-04 | 6.92e-01 | 0.1426 |
| 55466 | DNAJA4 | P12T-E | Human | Esophagus | ESCC | 9.96e-18 | 6.84e-01 | 0.1122 |
| 55466 | DNAJA4 | P15T-E | Human | Esophagus | ESCC | 1.86e-13 | 4.78e-01 | 0.1149 |
| 55466 | DNAJA4 | P16T-E | Human | Esophagus | ESCC | 2.23e-11 | 3.32e-01 | 0.1153 |
| Page: 1 2 3 4 5 6 7 |
| Tissue | Expression Dynamics | Abbreviation |
| Cervix | 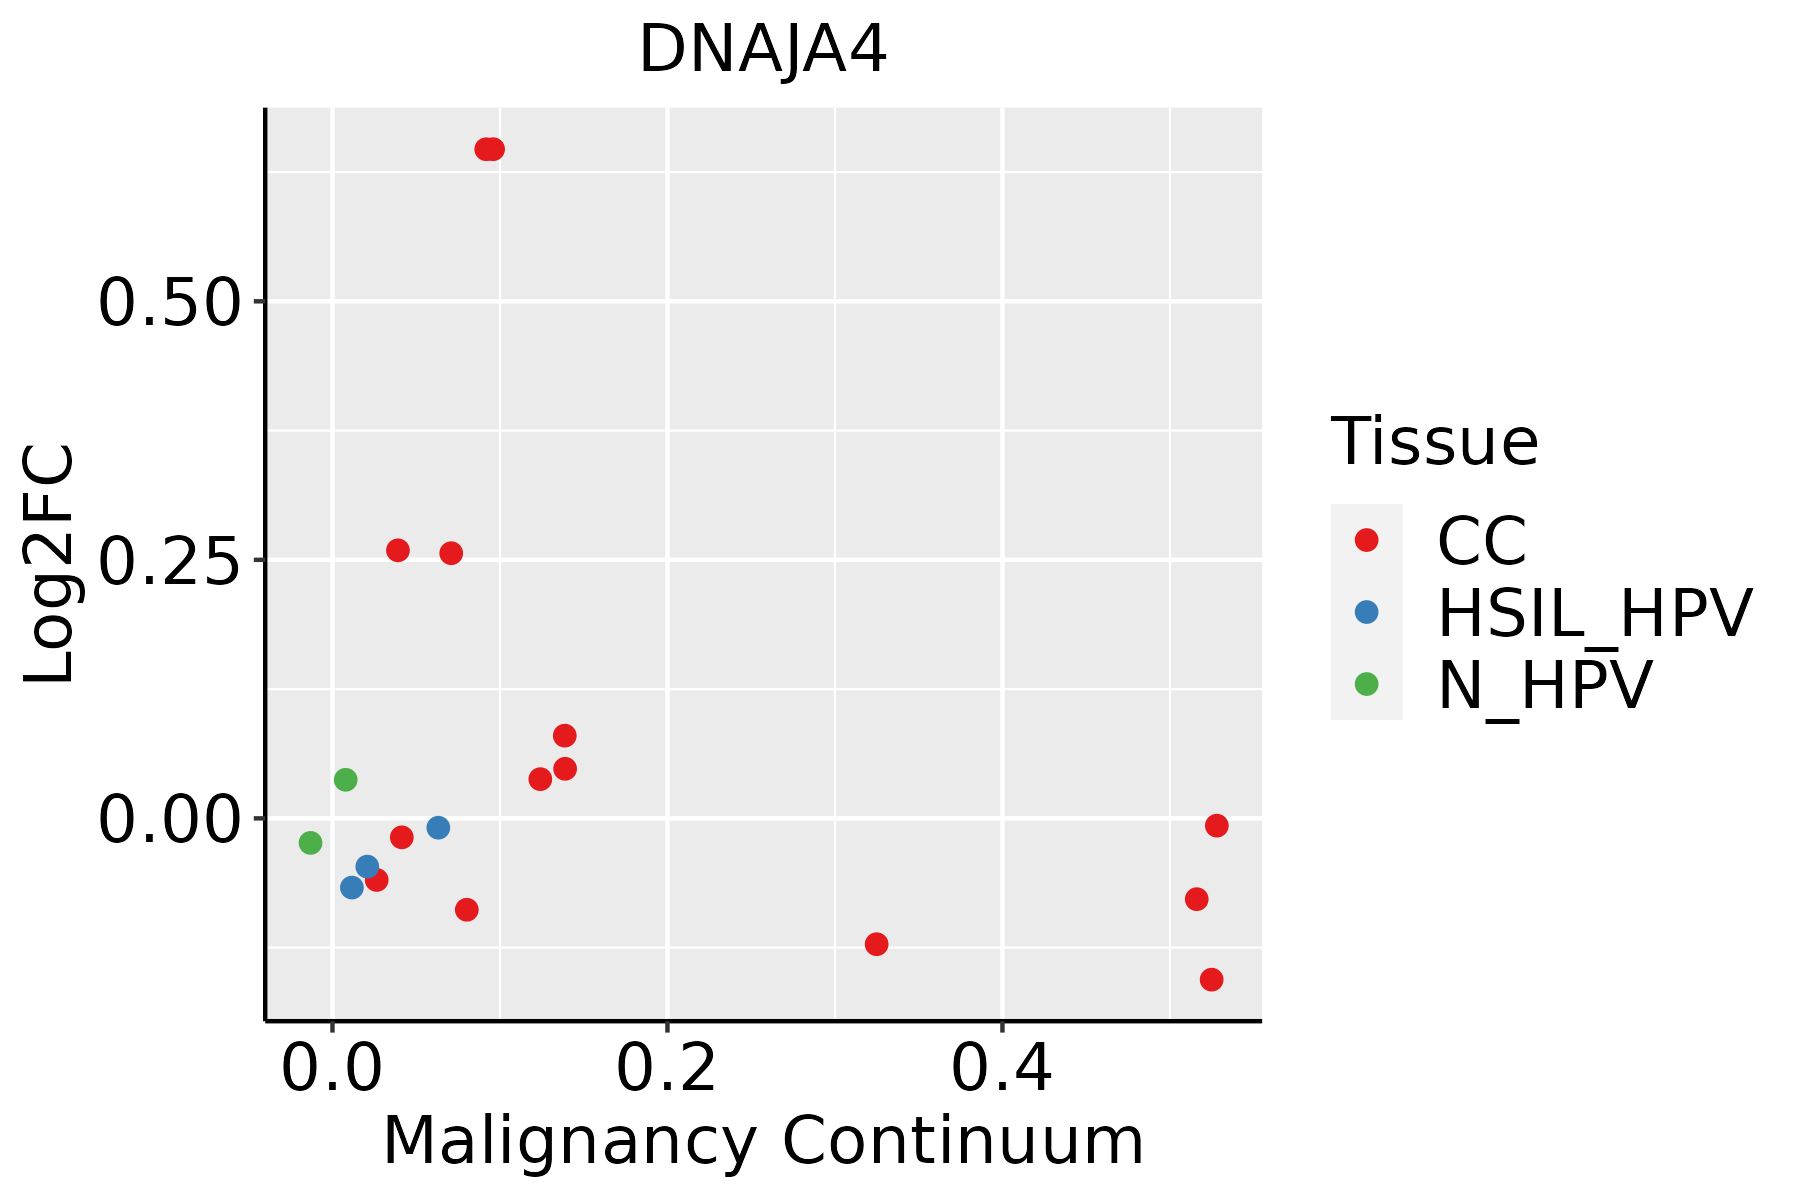 | CC: Cervix cancer |
| HSIL_HPV: HPV-infected high-grade squamous intraepithelial lesions | ||
| N_HPV: HPV-infected normal cervix | ||
| Esophagus |  | ESCC: Esophageal squamous cell carcinoma |
| HGIN: High-grade intraepithelial neoplasias | ||
| LGIN: Low-grade intraepithelial neoplasias | ||
| GC | 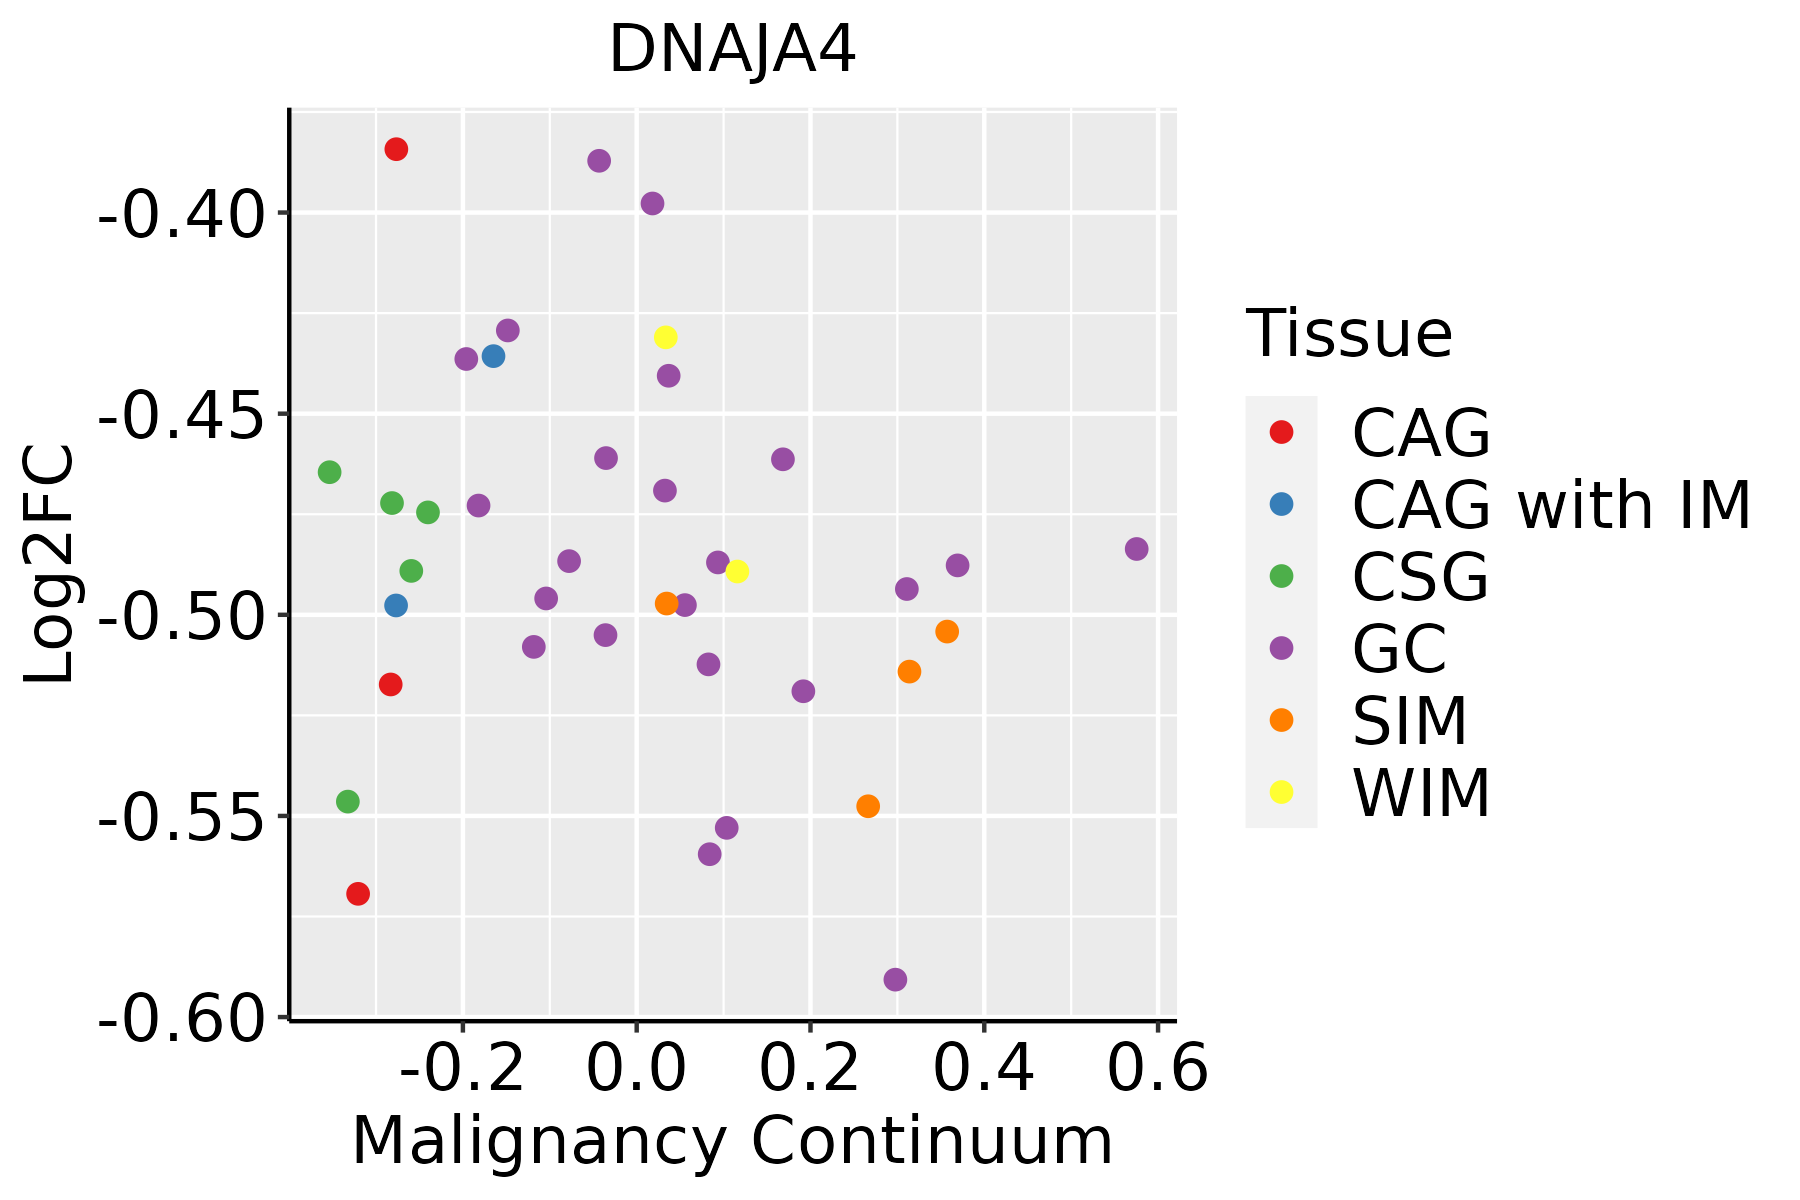 | CAG: Chronic atrophic gastritis |
| CAG with IM: Chronic atrophic gastritis with intestinal metaplasia | ||
| CSG: Chronic superficial gastritis | ||
| GC: Gastric cancer | ||
| SIM: Severe intestinal metaplasia | ||
| WIM: Wild intestinal metaplasia | ||
| Liver | 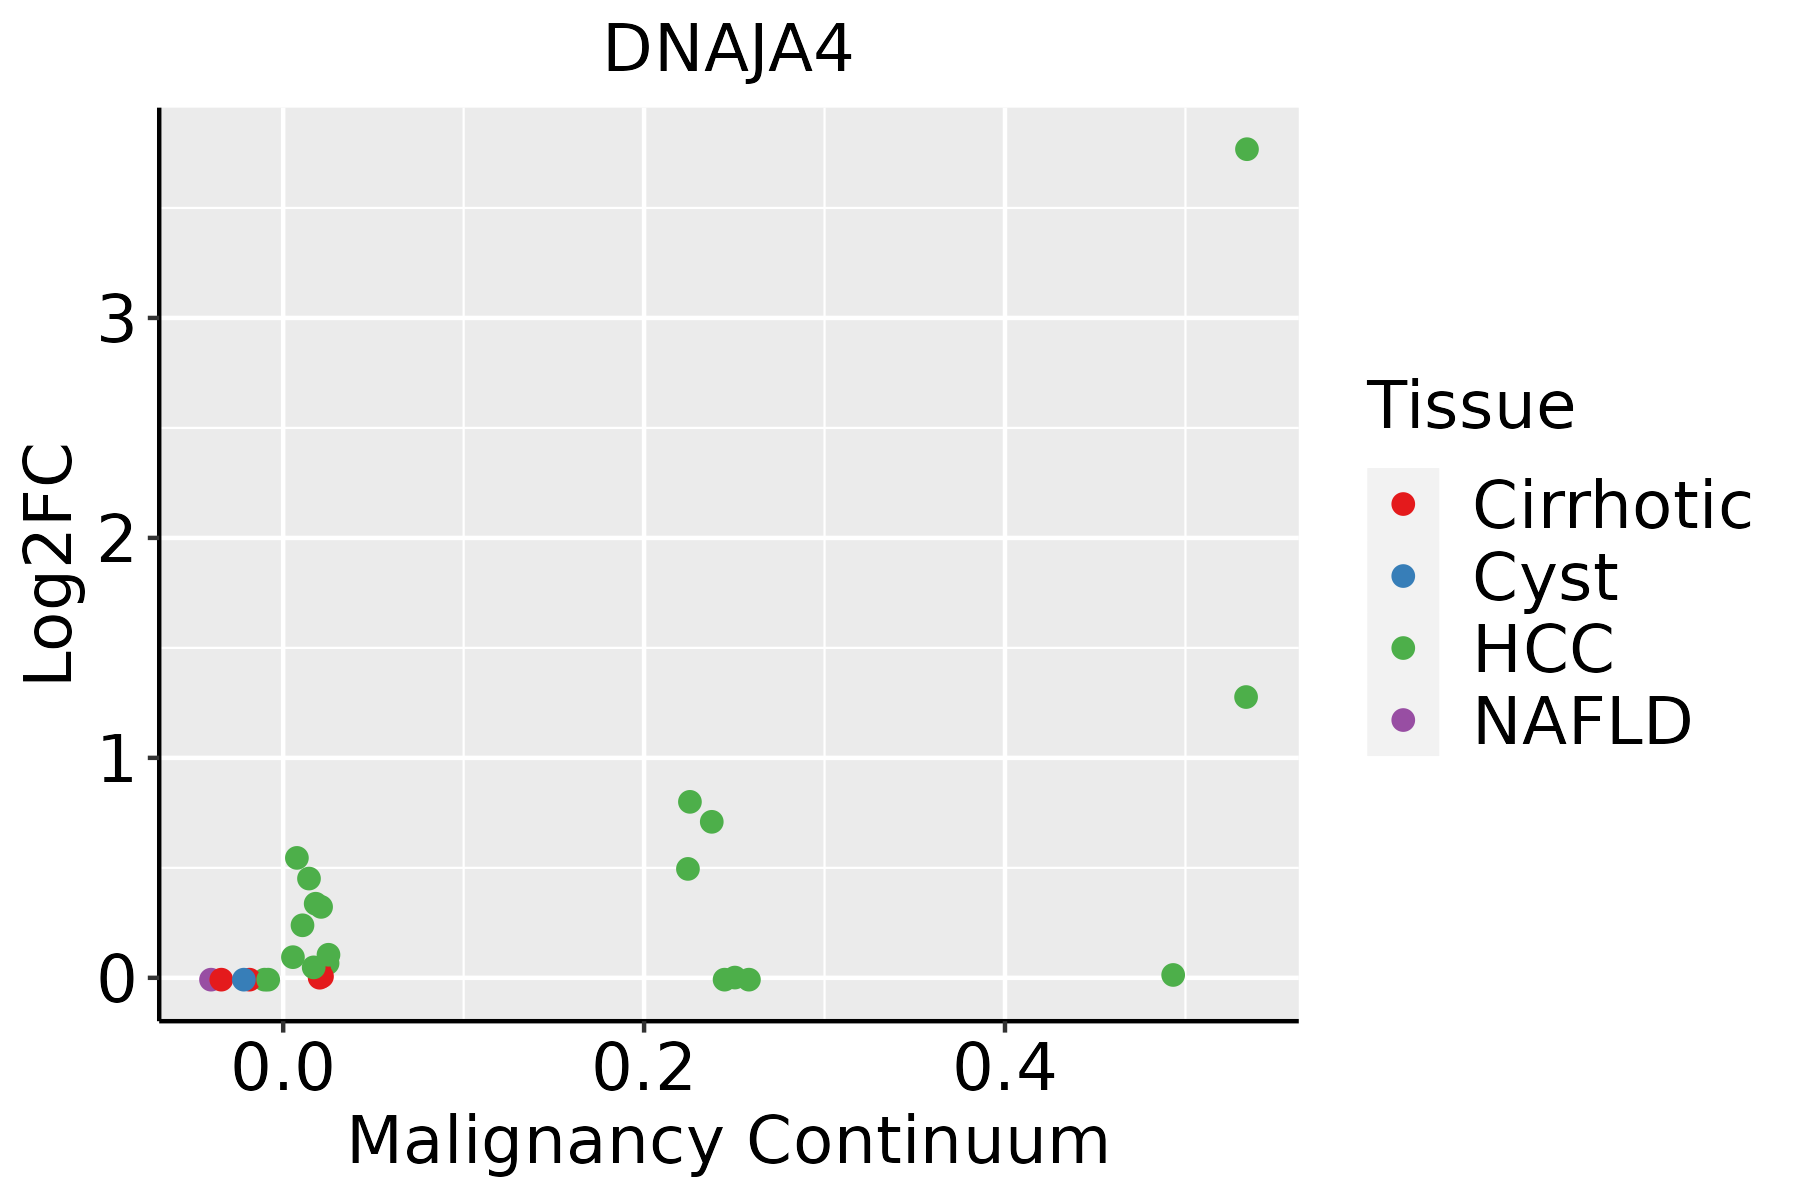 | HCC: Hepatocellular carcinoma |
| NAFLD: Non-alcoholic fatty liver disease | ||
| Oral Cavity | 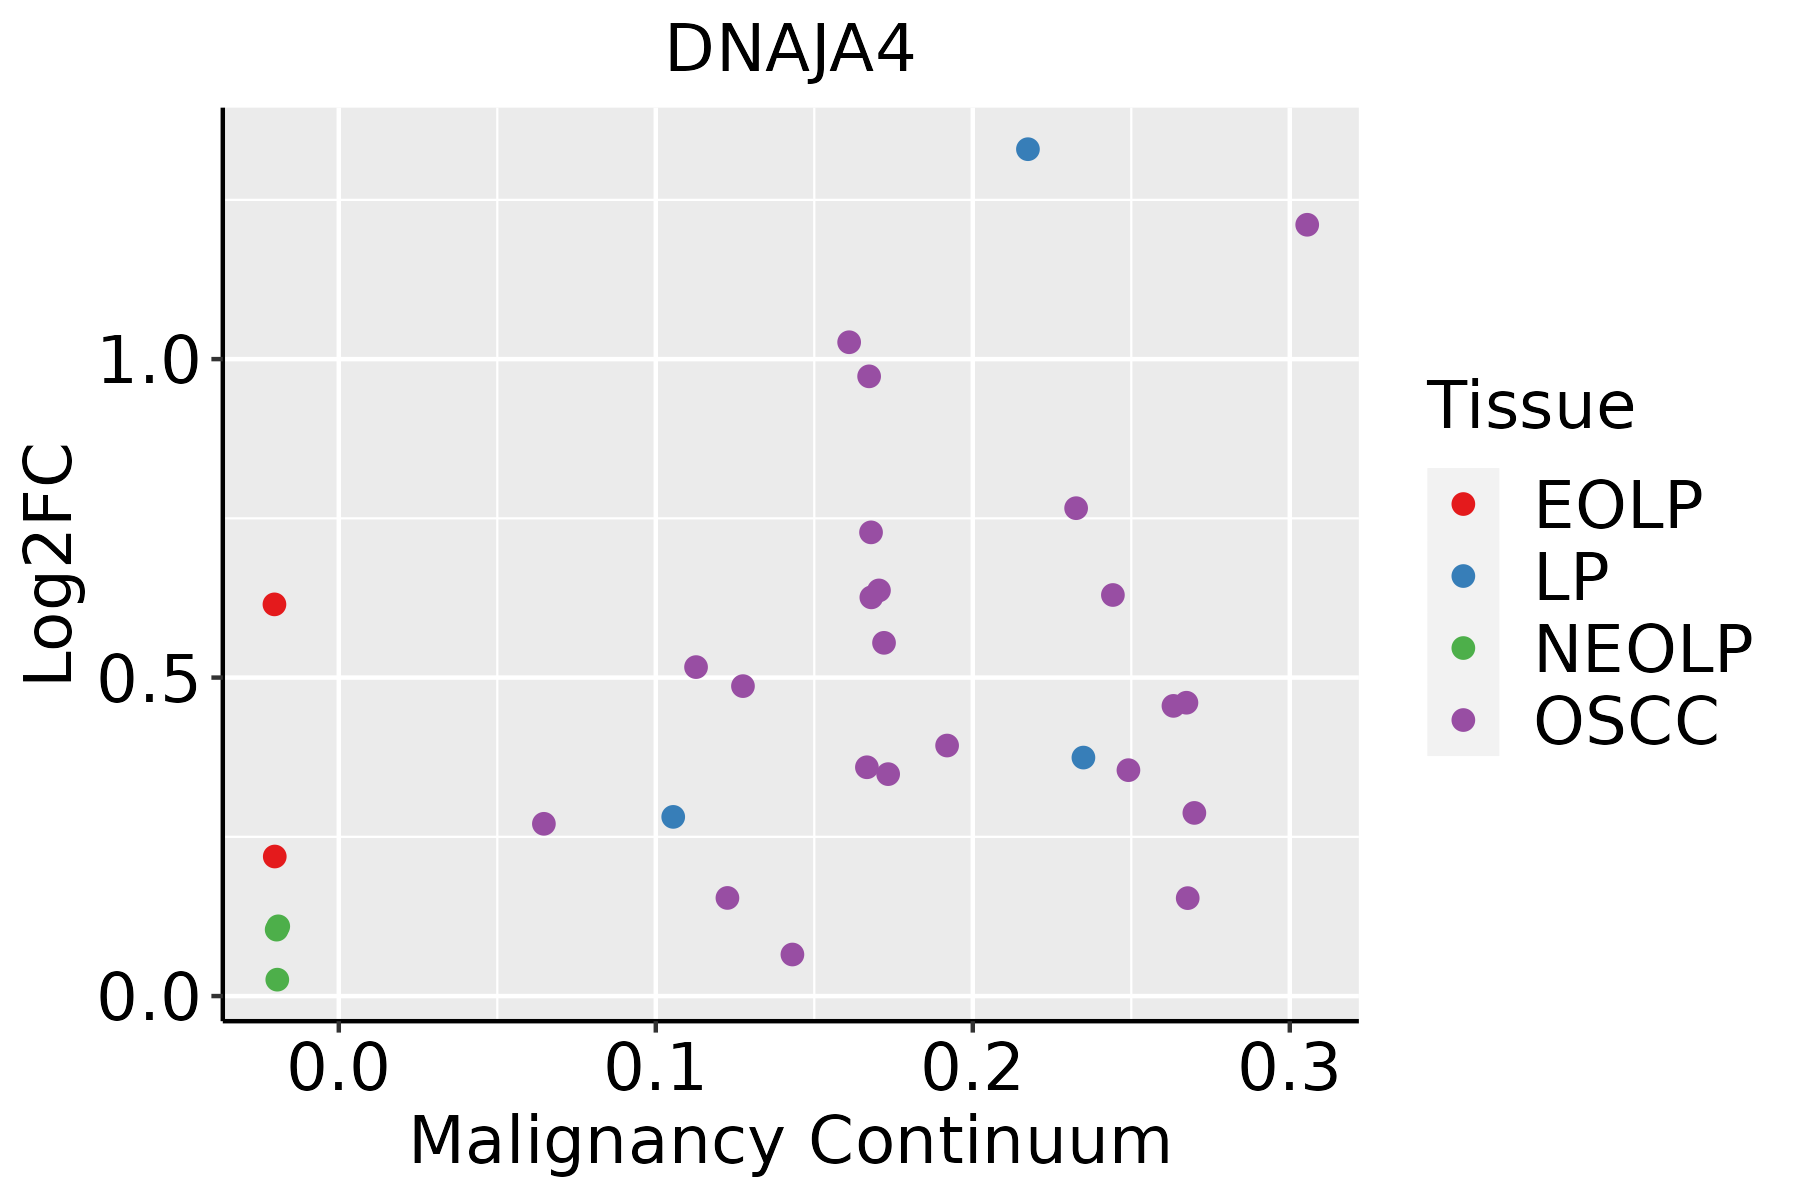 | EOLP: Erosive Oral lichen planus |
| LP: leukoplakia | ||
| NEOLP: Non-erosive oral lichen planus | ||
| OSCC: Oral squamous cell carcinoma | ||
| Skin | 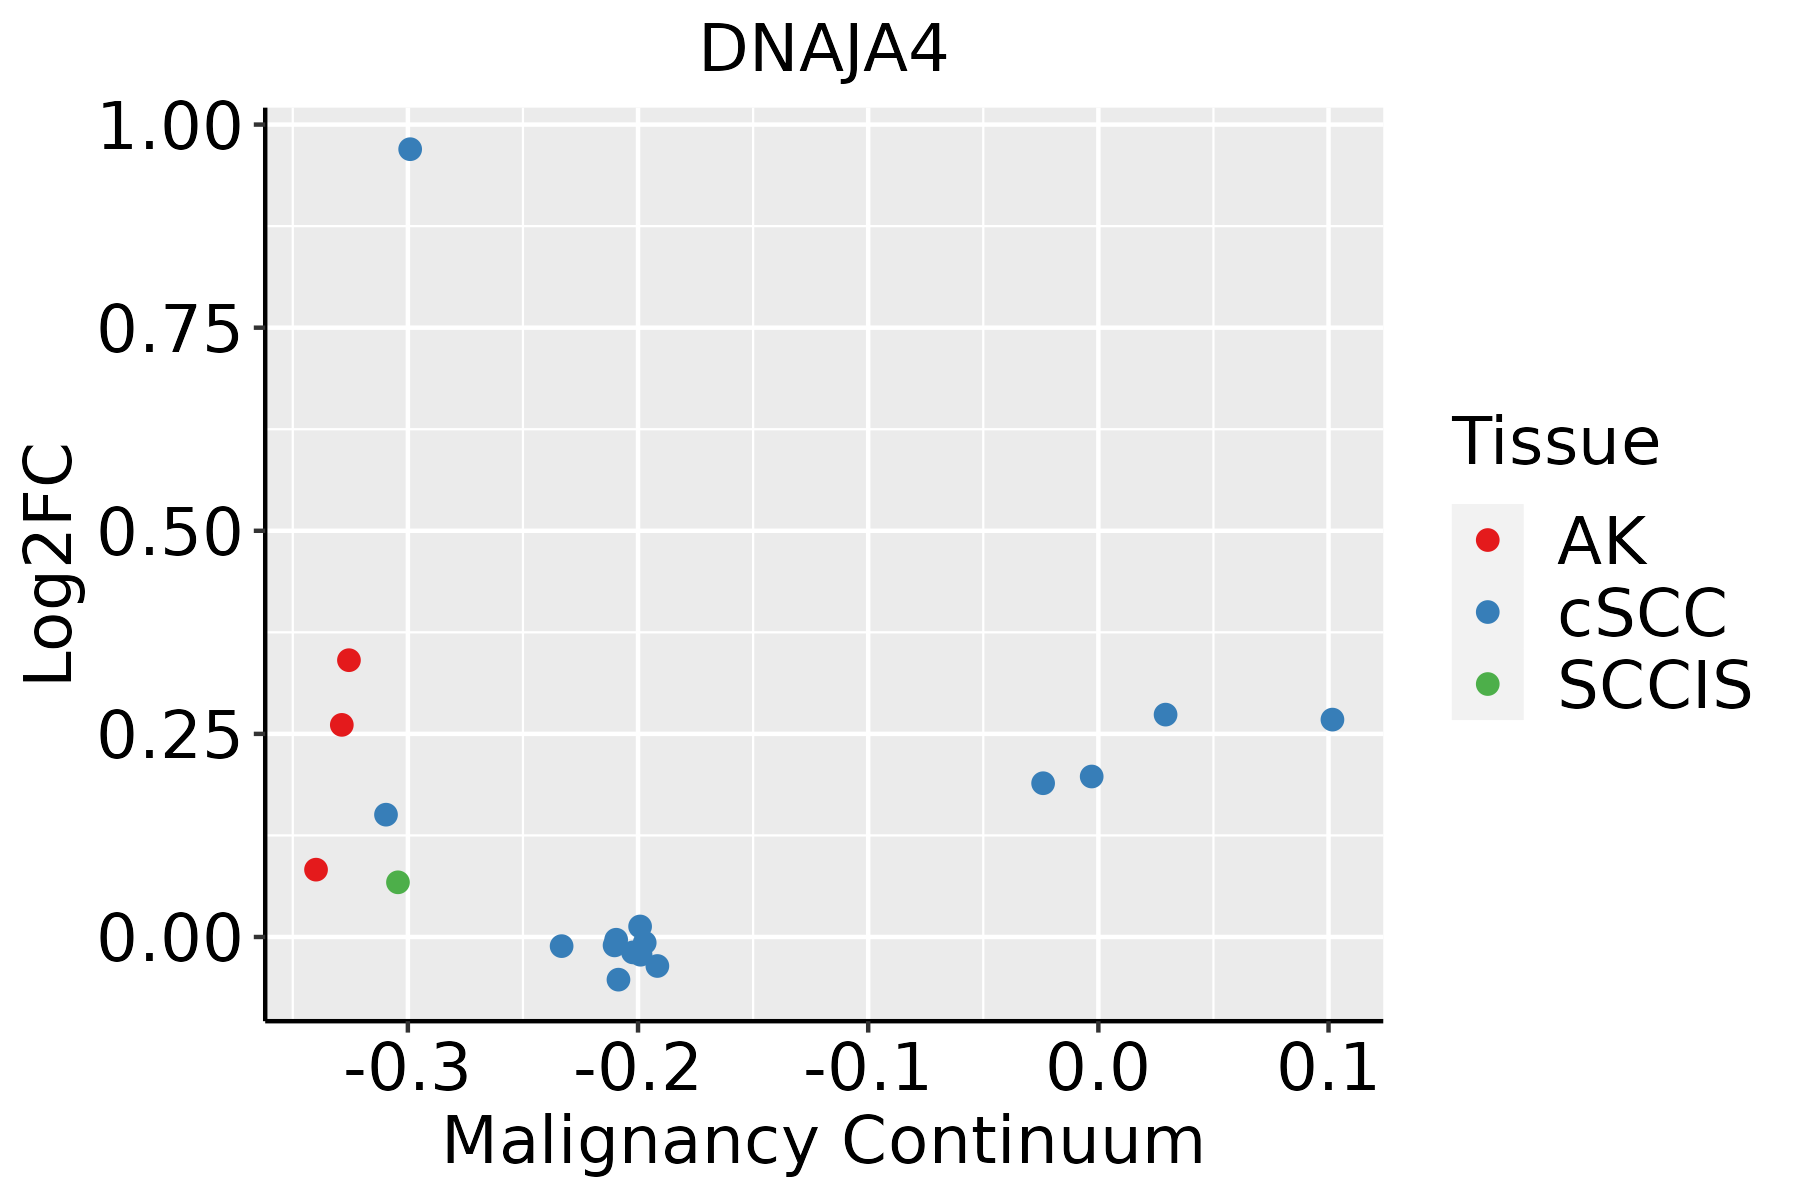 | AK: Actinic keratosis |
| cSCC: Cutaneous squamous cell carcinoma | ||
| SCCIS:squamous cell carcinoma in situ |
| ∗log2FC in expression of this searched gene in stem-like cells from each diseased tissue sample relative to stem-like cells in normal samples in each tissue plotted against the malignancy continuum. Samples are colored based on if they are from different disease stage. |
Top |
Malignant transformation related pathway analysis |
| Find out the enriched GO biological processes and KEGG pathways involved in transition from healthy to precancer to cancer |
| Tissue | Disease Stage | Enriched GO biological Processes |
| Colorectum | AD |  |
| Colorectum | SER |  |
| Colorectum | MSS |  |
| Colorectum | MSI-H |  |
| Colorectum | FAP |  |
| ∗Top 15 enriched GO BP terms are showed in the bar plot of each disease state in each tissue. Each row represents a significant GO biological process which is colored according to the -log10(p.adjust). |
| Page: 1 2 3 4 5 6 7 8 9 |
| GO ID | Tissue | Disease Stage | Description | Gene Ratio | Bg Ratio | pvalue | p.adjust | Count |
| GO:009013210 | Cervix | CC | epithelium migration | 90/2311 | 360/18723 | 2.45e-11 | 6.11e-09 | 90 |
| GO:00016679 | Cervix | CC | ameboidal-type cell migration | 110/2311 | 475/18723 | 2.66e-11 | 6.36e-09 | 110 |
| GO:001063110 | Cervix | CC | epithelial cell migration | 89/2311 | 357/18723 | 3.72e-11 | 8.54e-09 | 89 |
| GO:009013010 | Cervix | CC | tissue migration | 90/2311 | 365/18723 | 5.42e-11 | 1.05e-08 | 90 |
| GO:001063210 | Cervix | CC | regulation of epithelial cell migration | 72/2311 | 292/18723 | 4.52e-09 | 4.43e-07 | 72 |
| GO:00420269 | Cervix | CC | protein refolding | 12/2311 | 23/18723 | 4.41e-06 | 1.12e-04 | 12 |
| GO:00435427 | Cervix | CC | endothelial cell migration | 60/2311 | 279/18723 | 1.05e-05 | 2.33e-04 | 60 |
| GO:00105944 | Cervix | CC | regulation of endothelial cell migration | 52/2311 | 232/18723 | 1.20e-05 | 2.54e-04 | 52 |
| GO:00512713 | Cervix | CC | negative regulation of cellular component movement | 73/2311 | 367/18723 | 2.22e-05 | 3.95e-04 | 73 |
| GO:00400133 | Cervix | CC | negative regulation of locomotion | 76/2311 | 391/18723 | 3.47e-05 | 5.60e-04 | 76 |
| GO:20001463 | Cervix | CC | negative regulation of cell motility | 71/2311 | 359/18723 | 3.47e-05 | 5.60e-04 | 71 |
| GO:00303363 | Cervix | CC | negative regulation of cell migration | 68/2311 | 344/18723 | 5.11e-05 | 7.70e-04 | 68 |
| GO:00094089 | Cervix | CC | response to heat | 27/2311 | 110/18723 | 3.12e-04 | 3.32e-03 | 27 |
| GO:00064579 | Cervix | CC | protein folding | 44/2311 | 212/18723 | 3.43e-04 | 3.59e-03 | 44 |
| GO:00900848 | Cervix | CC | negative regulation of inclusion body assembly | 6/2311 | 11/18723 | 9.33e-04 | 7.86e-03 | 6 |
| GO:00092668 | Cervix | CC | response to temperature stimulus | 37/2311 | 178/18723 | 9.45e-04 | 7.95e-03 | 37 |
| GO:00900837 | Cervix | CC | regulation of inclusion body assembly | 7/2311 | 17/18723 | 2.72e-03 | 1.85e-02 | 7 |
| GO:00708418 | Cervix | CC | inclusion body assembly | 8/2311 | 24/18723 | 6.29e-03 | 3.54e-02 | 8 |
| GO:0006457110 | Esophagus | ESCC | protein folding | 163/8552 | 212/18723 | 1.13e-20 | 1.74e-18 | 163 |
| GO:0009408110 | Esophagus | ESCC | response to heat | 77/8552 | 110/18723 | 2.01e-07 | 3.11e-06 | 77 |
| Page: 1 2 3 4 5 6 7 8 |
| Pathway ID | Tissue | Disease Stage | Description | Gene Ratio | Bg Ratio | pvalue | p.adjust | qvalue | Count |
| Page: 1 |
Top |
Cell-cell communication analysis |
| Identification of potential cell-cell interactions between two cell types and their ligand-receptor pairs for different disease states |
| Ligand | Receptor | LRpair | Pathway | Tissue | Disease Stage |
| Page: 1 |
Top |
Single-cell gene regulatory network inference analysis |
| Find out the significant the regulons (TFs) and the target genes of each regulon across cell types for different disease states |
| TF | Cell Type | Tissue | Disease Stage | Target Gene | RSS | Regulon Activity |
| ∗The dot plots of a searched regulon are shown for all cell subpopulations in each disease state of each tissue based on the regulon specific score inferred using pySCENIC and by calculating the average expression. |
| Page: 1 |
Top |
Somatic mutation of malignant transformation related genes |
| Annotation of somatic variants for genes involved in malignant transformation |
| Hugo Symbol | Variant Class | Variant Classification | dbSNP RS | HGVSc | HGVSp | HGVSp Short | SWISSPROT | BIOTYPE | SIFT | PolyPhen | Tumor Sample Barcode | Tissue | Histology | Sex | Age | Stage | Therapy Types | Drugs | Outcome |
| DNAJA4 | SNV | Missense_Mutation | novel | c.956N>T | p.Ser319Phe | p.S319F | Q8WW22 | protein_coding | tolerated(0.11) | possibly_damaging(0.813) | TCGA-5L-AAT1-01 | Breast | breast invasive carcinoma | Female | <65 | III/IV | Hormone Therapy | letrozol | SD |
| DNAJA4 | SNV | Missense_Mutation | c.773N>T | p.Gly258Val | p.G258V | Q8WW22 | protein_coding | deleterious(0) | probably_damaging(0.99) | TCGA-AR-A1AO-01 | Breast | breast invasive carcinoma | Female | <65 | I/II | Chemotherapy | doxorubicin | SD | |
| DNAJA4 | insertion | Frame_Shift_Ins | novel | c.1164_1165insT | p.Asp389Ter | p.D389* | Q8WW22 | protein_coding | TCGA-A8-A09Q-01 | Breast | breast invasive carcinoma | Female | >=65 | III/IV | Hormone Therapy | anastrozole | SD | ||
| DNAJA4 | insertion | Frame_Shift_Ins | novel | c.1165_1166insTTTTAAACCTACCTGTGATGGCAGCTGCACC | p.Asp389ValfsTer22 | p.D389Vfs*22 | Q8WW22 | protein_coding | TCGA-A8-A09Q-01 | Breast | breast invasive carcinoma | Female | >=65 | III/IV | Hormone Therapy | anastrozole | SD | ||
| DNAJA4 | insertion | Frame_Shift_Ins | novel | c.1078_1079insCAGTTTATCCTTGGAGGTTTCC | p.Glu360AlafsTer35 | p.E360Afs*35 | Q8WW22 | protein_coding | TCGA-BH-A0BD-01 | Breast | breast invasive carcinoma | Female | <65 | I/II | Chemotherapy | doxorubicin | SD | ||
| DNAJA4 | deletion | Frame_Shift_Del | c.1142_1145delAAGT | p.Lys381ArgfsTer12 | p.K381Rfs*12 | Q8WW22 | protein_coding | TCGA-E2-A15P-01 | Breast | breast invasive carcinoma | Female | <65 | I/II | Hormone Therapy | arimidex | SD | |||
| DNAJA4 | SNV | Missense_Mutation | rs765263538 | c.917C>T | p.Thr306Met | p.T306M | Q8WW22 | protein_coding | tolerated(0.08) | possibly_damaging(0.738) | TCGA-AA-3663-01 | Colorectum | colon adenocarcinoma | Male | <65 | I/II | Unknown | Unknown | SD |
| DNAJA4 | SNV | Missense_Mutation | c.931G>A | p.Asp311Asn | p.D311N | Q8WW22 | protein_coding | deleterious(0.01) | probably_damaging(1) | TCGA-AA-3815-01 | Colorectum | colon adenocarcinoma | Female | >=65 | I/II | Unknown | Unknown | SD | |
| DNAJA4 | SNV | Missense_Mutation | c.982N>A | p.Gly328Arg | p.G328R | Q8WW22 | protein_coding | deleterious(0.02) | benign(0.3) | TCGA-AA-3833-01 | Colorectum | colon adenocarcinoma | Female | <65 | I/II | Unknown | Unknown | SD | |
| DNAJA4 | SNV | Missense_Mutation | rs751859584 | c.938N>A | p.Arg313Gln | p.R313Q | Q8WW22 | protein_coding | deleterious(0.02) | possibly_damaging(0.866) | TCGA-CA-6717-01 | Colorectum | colon adenocarcinoma | Male | <65 | I/II | Chemotherapy | oxaliplatin | CR |
| Page: 1 2 3 4 |
Top |
Related drugs of malignant transformation related genes |
| Identification of chemicals and drugs interact with genes involved in malignant transfromation |
| (DGIdb 4.0) |
| Entrez ID | Symbol | Category | Interaction Types | Drug Claim Name | Drug Name | PMIDs |
| Page: 1 |

Copyright 2023-Present -The University of Texas Health Science Center at Houston |