
|
|||||
|
 | |
| |
| |
| |
| |
| |
|
Gene: DNAJA3 |
Gene summary for DNAJA3 |
| Gene information | Species | Human | Gene symbol | DNAJA3 | Gene ID | 9093 |
| Gene name | DnaJ heat shock protein family (Hsp40) member A3 | |
| Gene Alias | HCA57 | |
| Cytomap | 16p13.3 | |
| Gene Type | protein-coding | GO ID | GO:0000122 | UniProtAcc | B3KM81 |
Top |
Malignant transformation analysis |
| Identification of the aberrant gene expression in precancerous and cancerous lesions by comparing the gene expression of stem-like cells in diseased tissues with normal stem cells |
| Entrez ID | Symbol | Replicates | Species | Organ | Tissue | Adj P-value | Log2FC | Malignancy |
| 9093 | DNAJA3 | LZE4T | Human | Esophagus | ESCC | 1.63e-11 | 3.16e-01 | 0.0811 |
| 9093 | DNAJA3 | LZE7T | Human | Esophagus | ESCC | 8.56e-10 | 4.62e-01 | 0.0667 |
| 9093 | DNAJA3 | LZE8T | Human | Esophagus | ESCC | 2.26e-08 | 1.70e-01 | 0.067 |
| 9093 | DNAJA3 | LZE20T | Human | Esophagus | ESCC | 1.39e-02 | 1.13e-01 | 0.0662 |
| 9093 | DNAJA3 | LZE22T | Human | Esophagus | ESCC | 7.98e-04 | 3.24e-01 | 0.068 |
| 9093 | DNAJA3 | LZE24T | Human | Esophagus | ESCC | 6.70e-08 | 2.93e-01 | 0.0596 |
| 9093 | DNAJA3 | LZE21T | Human | Esophagus | ESCC | 4.73e-05 | 2.71e-01 | 0.0655 |
| 9093 | DNAJA3 | P1T-E | Human | Esophagus | ESCC | 3.64e-07 | 3.63e-01 | 0.0875 |
| 9093 | DNAJA3 | P2T-E | Human | Esophagus | ESCC | 6.32e-41 | 6.93e-01 | 0.1177 |
| 9093 | DNAJA3 | P4T-E | Human | Esophagus | ESCC | 3.06e-14 | 3.38e-01 | 0.1323 |
| 9093 | DNAJA3 | P5T-E | Human | Esophagus | ESCC | 9.42e-19 | 3.25e-01 | 0.1327 |
| 9093 | DNAJA3 | P8T-E | Human | Esophagus | ESCC | 2.06e-24 | 4.19e-01 | 0.0889 |
| 9093 | DNAJA3 | P9T-E | Human | Esophagus | ESCC | 2.17e-14 | 1.12e-01 | 0.1131 |
| 9093 | DNAJA3 | P10T-E | Human | Esophagus | ESCC | 2.00e-19 | 2.61e-01 | 0.116 |
| 9093 | DNAJA3 | P11T-E | Human | Esophagus | ESCC | 1.61e-13 | 6.00e-01 | 0.1426 |
| 9093 | DNAJA3 | P12T-E | Human | Esophagus | ESCC | 4.15e-42 | 7.20e-01 | 0.1122 |
| 9093 | DNAJA3 | P15T-E | Human | Esophagus | ESCC | 5.90e-42 | 8.51e-01 | 0.1149 |
| 9093 | DNAJA3 | P16T-E | Human | Esophagus | ESCC | 1.48e-20 | 3.12e-01 | 0.1153 |
| 9093 | DNAJA3 | P17T-E | Human | Esophagus | ESCC | 6.36e-05 | 2.57e-01 | 0.1278 |
| 9093 | DNAJA3 | P19T-E | Human | Esophagus | ESCC | 3.83e-03 | 4.02e-01 | 0.1662 |
| Page: 1 2 3 4 5 |
| Tissue | Expression Dynamics | Abbreviation |
| Esophagus | 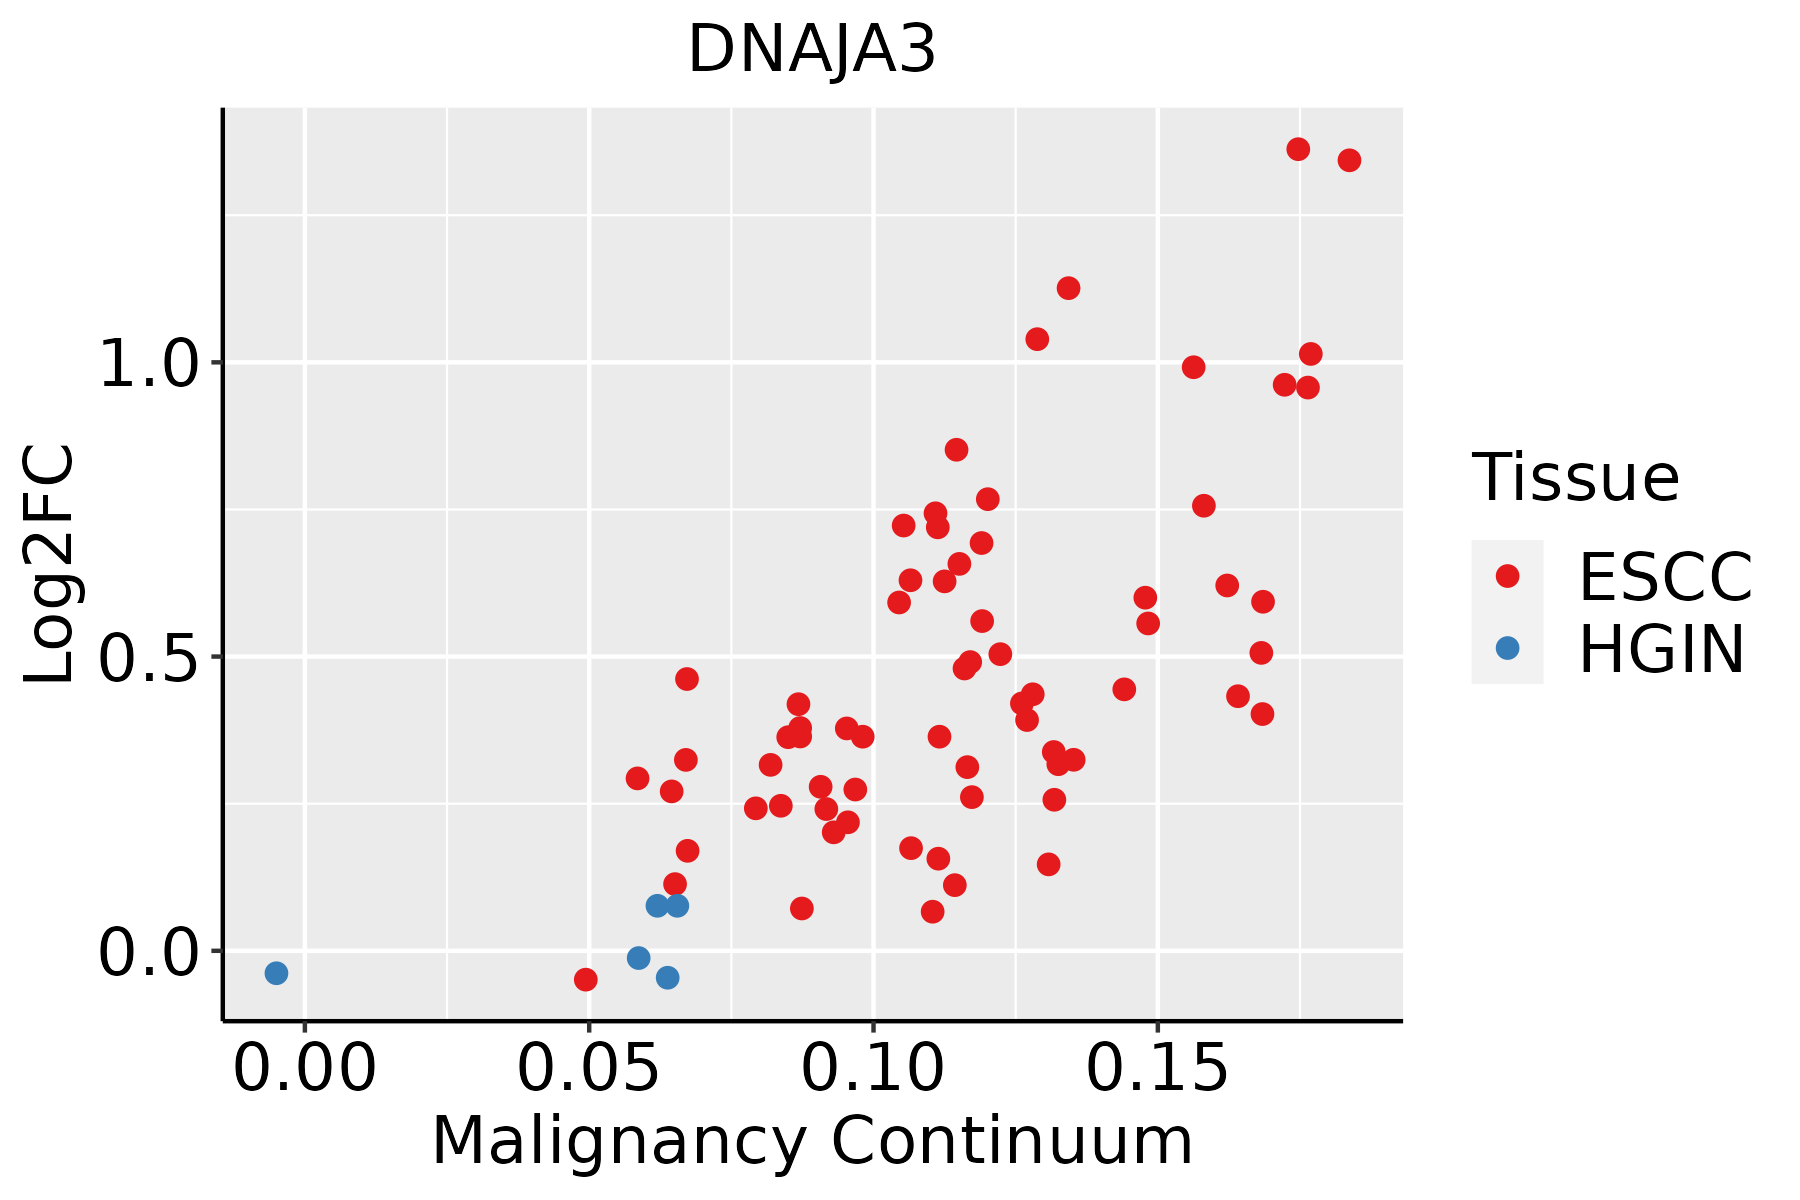 | ESCC: Esophageal squamous cell carcinoma |
| HGIN: High-grade intraepithelial neoplasias | ||
| LGIN: Low-grade intraepithelial neoplasias | ||
| Liver | 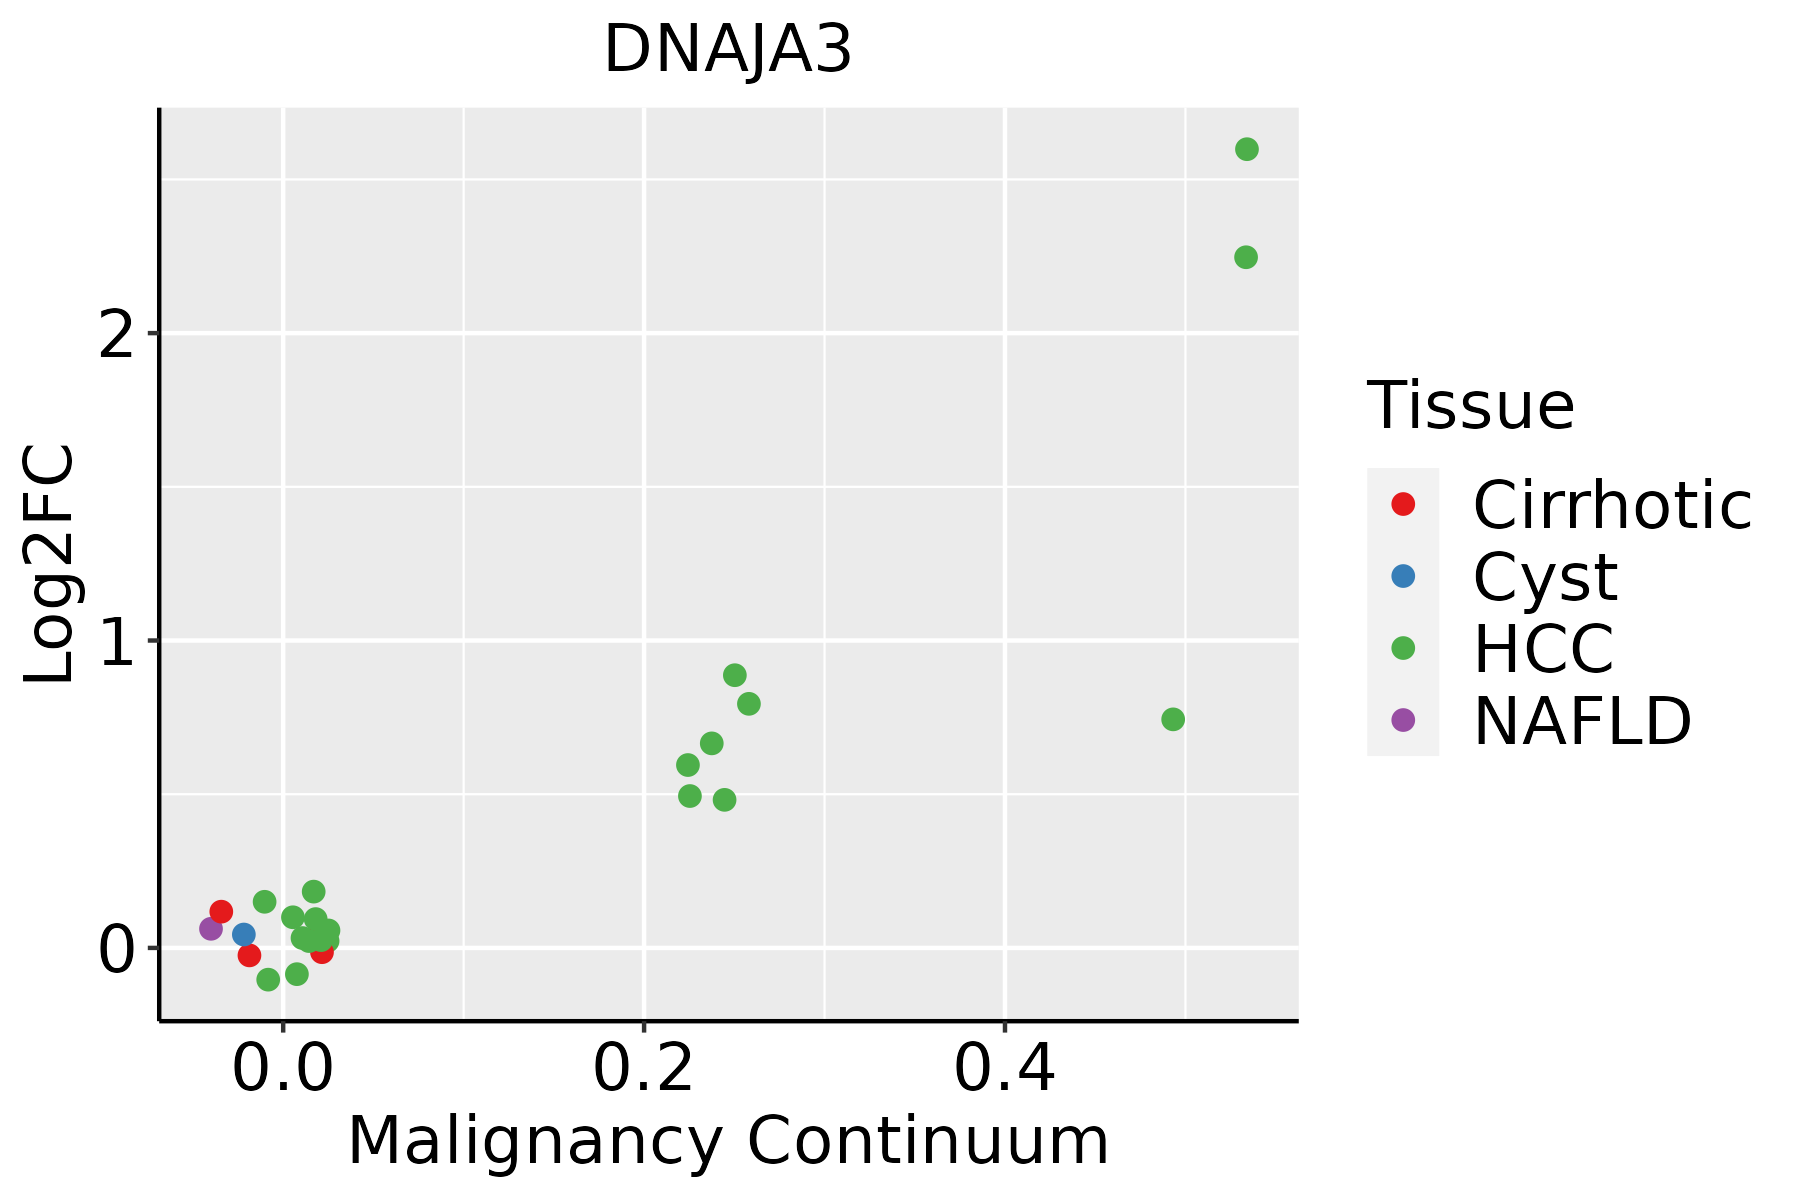 | HCC: Hepatocellular carcinoma |
| NAFLD: Non-alcoholic fatty liver disease | ||
| Oral Cavity |  | EOLP: Erosive Oral lichen planus |
| LP: leukoplakia | ||
| NEOLP: Non-erosive oral lichen planus | ||
| OSCC: Oral squamous cell carcinoma | ||
| Skin |  | AK: Actinic keratosis |
| cSCC: Cutaneous squamous cell carcinoma | ||
| SCCIS:squamous cell carcinoma in situ |
| ∗log2FC in expression of this searched gene in stem-like cells from each diseased tissue sample relative to stem-like cells in normal samples in each tissue plotted against the malignancy continuum. Samples are colored based on if they are from different disease stage. |
Top |
Malignant transformation related pathway analysis |
| Find out the enriched GO biological processes and KEGG pathways involved in transition from healthy to precancer to cancer |
| Tissue | Disease Stage | Enriched GO biological Processes |
| Colorectum | AD |  |
| Colorectum | SER |  |
| Colorectum | MSS |  |
| Colorectum | MSI-H |  |
| Colorectum | FAP |  |
| ∗Top 15 enriched GO BP terms are showed in the bar plot of each disease state in each tissue. Each row represents a significant GO biological process which is colored according to the -log10(p.adjust). |
| Page: 1 2 3 4 5 6 7 8 9 |
| GO ID | Tissue | Disease Stage | Description | Gene Ratio | Bg Ratio | pvalue | p.adjust | Count |
| GO:0006457110 | Esophagus | ESCC | protein folding | 163/8552 | 212/18723 | 1.13e-20 | 1.74e-18 | 163 |
| GO:00062604 | Esophagus | ESCC | DNA replication | 181/8552 | 260/18723 | 3.55e-15 | 2.05e-13 | 181 |
| GO:004578527 | Esophagus | ESCC | positive regulation of cell adhesion | 255/8552 | 437/18723 | 5.07e-08 | 9.11e-07 | 255 |
| GO:0009408110 | Esophagus | ESCC | response to heat | 77/8552 | 110/18723 | 2.01e-07 | 3.11e-06 | 77 |
| GO:00062612 | Esophagus | ESCC | DNA-dependent DNA replication | 100/8552 | 151/18723 | 2.61e-07 | 3.94e-06 | 100 |
| GO:000756820 | Esophagus | ESCC | aging | 201/8552 | 339/18723 | 2.64e-07 | 3.94e-06 | 201 |
| GO:0048872111 | Esophagus | ESCC | homeostasis of number of cells | 163/8552 | 272/18723 | 1.40e-06 | 1.69e-05 | 163 |
| GO:000926619 | Esophagus | ESCC | response to temperature stimulus | 106/8552 | 178/18723 | 1.30e-04 | 8.84e-04 | 106 |
| GO:00075699 | Esophagus | ESCC | cell aging | 81/8552 | 132/18723 | 2.00e-04 | 1.27e-03 | 81 |
| GO:002240720 | Esophagus | ESCC | regulation of cell-cell adhesion | 239/8552 | 448/18723 | 5.88e-04 | 3.19e-03 | 239 |
| GO:00718871 | Esophagus | ESCC | leukocyte apoptotic process | 65/8552 | 106/18723 | 8.39e-04 | 4.32e-03 | 65 |
| GO:004211018 | Esophagus | ESCC | T cell activation | 256/8552 | 487/18723 | 1.18e-03 | 5.87e-03 | 256 |
| GO:19031317 | Esophagus | ESCC | mononuclear cell differentiation | 226/8552 | 426/18723 | 1.20e-03 | 5.88e-03 | 226 |
| GO:00702271 | Esophagus | ESCC | lymphocyte apoptotic process | 46/8552 | 72/18723 | 1.39e-03 | 6.62e-03 | 46 |
| GO:002240919 | Esophagus | ESCC | positive regulation of cell-cell adhesion | 155/8552 | 284/18723 | 1.50e-03 | 7.06e-03 | 155 |
| GO:005087015 | Esophagus | ESCC | positive regulation of T cell activation | 117/8552 | 216/18723 | 7.23e-03 | 2.62e-02 | 117 |
| GO:00302176 | Esophagus | ESCC | T cell differentiation | 137/8552 | 257/18723 | 8.09e-03 | 2.87e-02 | 137 |
| GO:190303916 | Esophagus | ESCC | positive regulation of leukocyte cell-cell adhesion | 128/8552 | 239/18723 | 8.40e-03 | 2.96e-02 | 128 |
| GO:000715918 | Esophagus | ESCC | leukocyte cell-cell adhesion | 192/8552 | 371/18723 | 1.03e-02 | 3.51e-02 | 192 |
| GO:190303717 | Esophagus | ESCC | regulation of leukocyte cell-cell adhesion | 174/8552 | 336/18723 | 1.36e-02 | 4.43e-02 | 174 |
| Page: 1 2 3 4 |
| Pathway ID | Tissue | Disease Stage | Description | Gene Ratio | Bg Ratio | pvalue | p.adjust | qvalue | Count |
| hsa0520325 | Esophagus | ESCC | Viral carcinogenesis | 137/4205 | 204/8465 | 2.47e-07 | 1.88e-06 | 9.62e-07 | 137 |
| hsa0520335 | Esophagus | ESCC | Viral carcinogenesis | 137/4205 | 204/8465 | 2.47e-07 | 1.88e-06 | 9.62e-07 | 137 |
| hsa052032 | Liver | HCC | Viral carcinogenesis | 117/4020 | 204/8465 | 2.68e-03 | 8.98e-03 | 5.00e-03 | 117 |
| hsa052033 | Liver | HCC | Viral carcinogenesis | 117/4020 | 204/8465 | 2.68e-03 | 8.98e-03 | 5.00e-03 | 117 |
| hsa052038 | Oral cavity | OSCC | Viral carcinogenesis | 124/3704 | 204/8465 | 5.57e-07 | 3.28e-06 | 1.67e-06 | 124 |
| hsa0520314 | Oral cavity | OSCC | Viral carcinogenesis | 124/3704 | 204/8465 | 5.57e-07 | 3.28e-06 | 1.67e-06 | 124 |
| hsa0520324 | Oral cavity | LP | Viral carcinogenesis | 90/2418 | 204/8465 | 1.20e-06 | 1.38e-05 | 8.89e-06 | 90 |
| hsa0520334 | Oral cavity | LP | Viral carcinogenesis | 90/2418 | 204/8465 | 1.20e-06 | 1.38e-05 | 8.89e-06 | 90 |
| Page: 1 |
Top |
Cell-cell communication analysis |
| Identification of potential cell-cell interactions between two cell types and their ligand-receptor pairs for different disease states |
| Ligand | Receptor | LRpair | Pathway | Tissue | Disease Stage |
| Page: 1 |
Top |
Single-cell gene regulatory network inference analysis |
| Find out the significant the regulons (TFs) and the target genes of each regulon across cell types for different disease states |
| TF | Cell Type | Tissue | Disease Stage | Target Gene | RSS | Regulon Activity |
| ∗The dot plots of a searched regulon are shown for all cell subpopulations in each disease state of each tissue based on the regulon specific score inferred using pySCENIC and by calculating the average expression. |
| Page: 1 |
Top |
Somatic mutation of malignant transformation related genes |
| Annotation of somatic variants for genes involved in malignant transformation |
| Hugo Symbol | Variant Class | Variant Classification | dbSNP RS | HGVSc | HGVSp | HGVSp Short | SWISSPROT | BIOTYPE | SIFT | PolyPhen | Tumor Sample Barcode | Tissue | Histology | Sex | Age | Stage | Therapy Types | Drugs | Outcome |
| DNAJA3 | SNV | Missense_Mutation | novel | c.1406G>A | p.Gly469Glu | p.G469E | Q96EY1 | protein_coding | deleterious(0) | probably_damaging(0.999) | TCGA-E2-A2P6-01 | Breast | breast invasive carcinoma | Female | >=65 | I/II | Hormone Therapy | anastrozole | SD |
| DNAJA3 | insertion | Nonsense_Mutation | novel | c.740_741insAAAGTGAGGGC | p.Thr248LysfsTer2 | p.T248Kfs*2 | Q96EY1 | protein_coding | TCGA-AN-A04A-01 | Breast | breast invasive carcinoma | Female | <65 | III/IV | Unknown | Unknown | SD | ||
| DNAJA3 | insertion | Nonsense_Mutation | novel | c.742_743insGGCACGGTGGCTCACGCTTGTAATC | p.Thr248ArgfsTer8 | p.T248Rfs*8 | Q96EY1 | protein_coding | TCGA-AN-A04A-01 | Breast | breast invasive carcinoma | Female | <65 | III/IV | Unknown | Unknown | SD | ||
| DNAJA3 | SNV | Missense_Mutation | c.1204G>A | p.Gly402Arg | p.G402R | Q96EY1 | protein_coding | deleterious(0.01) | possibly_damaging(0.694) | TCGA-2W-A8YY-01 | Cervix | cervical & endocervical cancer | Female | <65 | I/II | Chemotherapy | cisplatin | CR | |
| DNAJA3 | SNV | Missense_Mutation | novel | c.1410C>G | p.Phe470Leu | p.F470L | Q96EY1 | protein_coding | tolerated(0.15) | benign(0.012) | TCGA-C5-A7UI-01 | Cervix | cervical & endocervical cancer | Female | <65 | I/II | Unknown | Unknown | SD |
| DNAJA3 | SNV | Missense_Mutation | novel | c.318N>C | p.Gln106His | p.Q106H | Q96EY1 | protein_coding | deleterious(0.01) | probably_damaging(0.997) | TCGA-VS-A8QA-01 | Cervix | cervical & endocervical cancer | Female | <65 | I/II | Unknown | Unknown | SD |
| DNAJA3 | SNV | Missense_Mutation | c.511N>A | p.His171Asn | p.H171N | Q96EY1 | protein_coding | tolerated(0.21) | benign(0.013) | TCGA-AA-A00O-01 | Colorectum | colon adenocarcinoma | Female | >=65 | III/IV | Unknown | Unknown | SD | |
| DNAJA3 | SNV | Missense_Mutation | novel | c.978N>C | p.Glu326Asp | p.E326D | Q96EY1 | protein_coding | deleterious(0.02) | probably_damaging(0.918) | TCGA-AZ-4315-01 | Colorectum | colon adenocarcinoma | Male | <65 | I/II | Unknown | Unknown | SD |
| DNAJA3 | SNV | Missense_Mutation | rs753693250 | c.814C>T | p.Arg272Cys | p.R272C | Q96EY1 | protein_coding | deleterious(0) | probably_damaging(1) | TCGA-CK-6746-01 | Colorectum | colon adenocarcinoma | Female | >=65 | I/II | Unknown | Unknown | SD |
| DNAJA3 | SNV | Missense_Mutation | c.1165N>A | p.Gly389Ser | p.G389S | Q96EY1 | protein_coding | tolerated(1) | benign(0) | TCGA-G4-6586-01 | Colorectum | colon adenocarcinoma | Female | >=65 | I/II | Unknown | Unknown | SD |
| Page: 1 2 3 4 |
Top |
Related drugs of malignant transformation related genes |
| Identification of chemicals and drugs interact with genes involved in malignant transfromation |
| (DGIdb 4.0) |
| Entrez ID | Symbol | Category | Interaction Types | Drug Claim Name | Drug Name | PMIDs |
| Page: 1 |

Copyright 2023-Present -The University of Texas Health Science Center at Houston |