
|
|||||
|
 | |
| |
| |
| |
| |
| |
|
Gene: DNAJA2 |
Gene summary for DNAJA2 |
| Gene information | Species | Human | Gene symbol | DNAJA2 | Gene ID | 10294 |
| Gene name | DnaJ heat shock protein family (Hsp40) member A2 | |
| Gene Alias | CPR3 | |
| Cytomap | 16q11.2 | |
| Gene Type | protein-coding | GO ID | GO:0006457 | UniProtAcc | A0A024R6S1 |
Top |
Malignant transformation analysis |
| Identification of the aberrant gene expression in precancerous and cancerous lesions by comparing the gene expression of stem-like cells in diseased tissues with normal stem cells |
| Entrez ID | Symbol | Replicates | Species | Organ | Tissue | Adj P-value | Log2FC | Malignancy |
| 10294 | DNAJA2 | LZE2D | Human | Esophagus | HGIN | 9.05e-03 | 1.93e-01 | 0.0642 |
| 10294 | DNAJA2 | LZE2T | Human | Esophagus | ESCC | 3.29e-04 | 1.15e+00 | 0.082 |
| 10294 | DNAJA2 | LZE4T | Human | Esophagus | ESCC | 6.69e-32 | 9.44e-01 | 0.0811 |
| 10294 | DNAJA2 | LZE7T | Human | Esophagus | ESCC | 1.24e-07 | 7.79e-01 | 0.0667 |
| 10294 | DNAJA2 | LZE8T | Human | Esophagus | ESCC | 7.00e-13 | 6.09e-01 | 0.067 |
| 10294 | DNAJA2 | LZE20T | Human | Esophagus | ESCC | 7.07e-07 | 2.42e-01 | 0.0662 |
| 10294 | DNAJA2 | LZE24T | Human | Esophagus | ESCC | 3.64e-25 | 7.65e-01 | 0.0596 |
| 10294 | DNAJA2 | LZE21T | Human | Esophagus | ESCC | 2.62e-04 | 3.29e-01 | 0.0655 |
| 10294 | DNAJA2 | LZE6T | Human | Esophagus | ESCC | 2.68e-02 | 2.86e-01 | 0.0845 |
| 10294 | DNAJA2 | P1T-E | Human | Esophagus | ESCC | 1.41e-07 | 8.13e-01 | 0.0875 |
| 10294 | DNAJA2 | P2T-E | Human | Esophagus | ESCC | 2.16e-23 | 4.53e-01 | 0.1177 |
| 10294 | DNAJA2 | P4T-E | Human | Esophagus | ESCC | 8.92e-46 | 1.32e+00 | 0.1323 |
| 10294 | DNAJA2 | P5T-E | Human | Esophagus | ESCC | 2.89e-38 | 9.52e-01 | 0.1327 |
| 10294 | DNAJA2 | P8T-E | Human | Esophagus | ESCC | 5.42e-32 | 8.08e-01 | 0.0889 |
| 10294 | DNAJA2 | P9T-E | Human | Esophagus | ESCC | 2.97e-26 | 5.29e-01 | 0.1131 |
| 10294 | DNAJA2 | P10T-E | Human | Esophagus | ESCC | 6.05e-28 | 5.41e-01 | 0.116 |
| 10294 | DNAJA2 | P11T-E | Human | Esophagus | ESCC | 1.17e-19 | 9.73e-01 | 0.1426 |
| 10294 | DNAJA2 | P12T-E | Human | Esophagus | ESCC | 4.22e-30 | 7.10e-01 | 0.1122 |
| 10294 | DNAJA2 | P15T-E | Human | Esophagus | ESCC | 8.19e-46 | 1.10e+00 | 0.1149 |
| 10294 | DNAJA2 | P16T-E | Human | Esophagus | ESCC | 2.00e-29 | 8.42e-01 | 0.1153 |
| Page: 1 2 3 4 5 6 7 |
| Tissue | Expression Dynamics | Abbreviation |
| Esophagus | 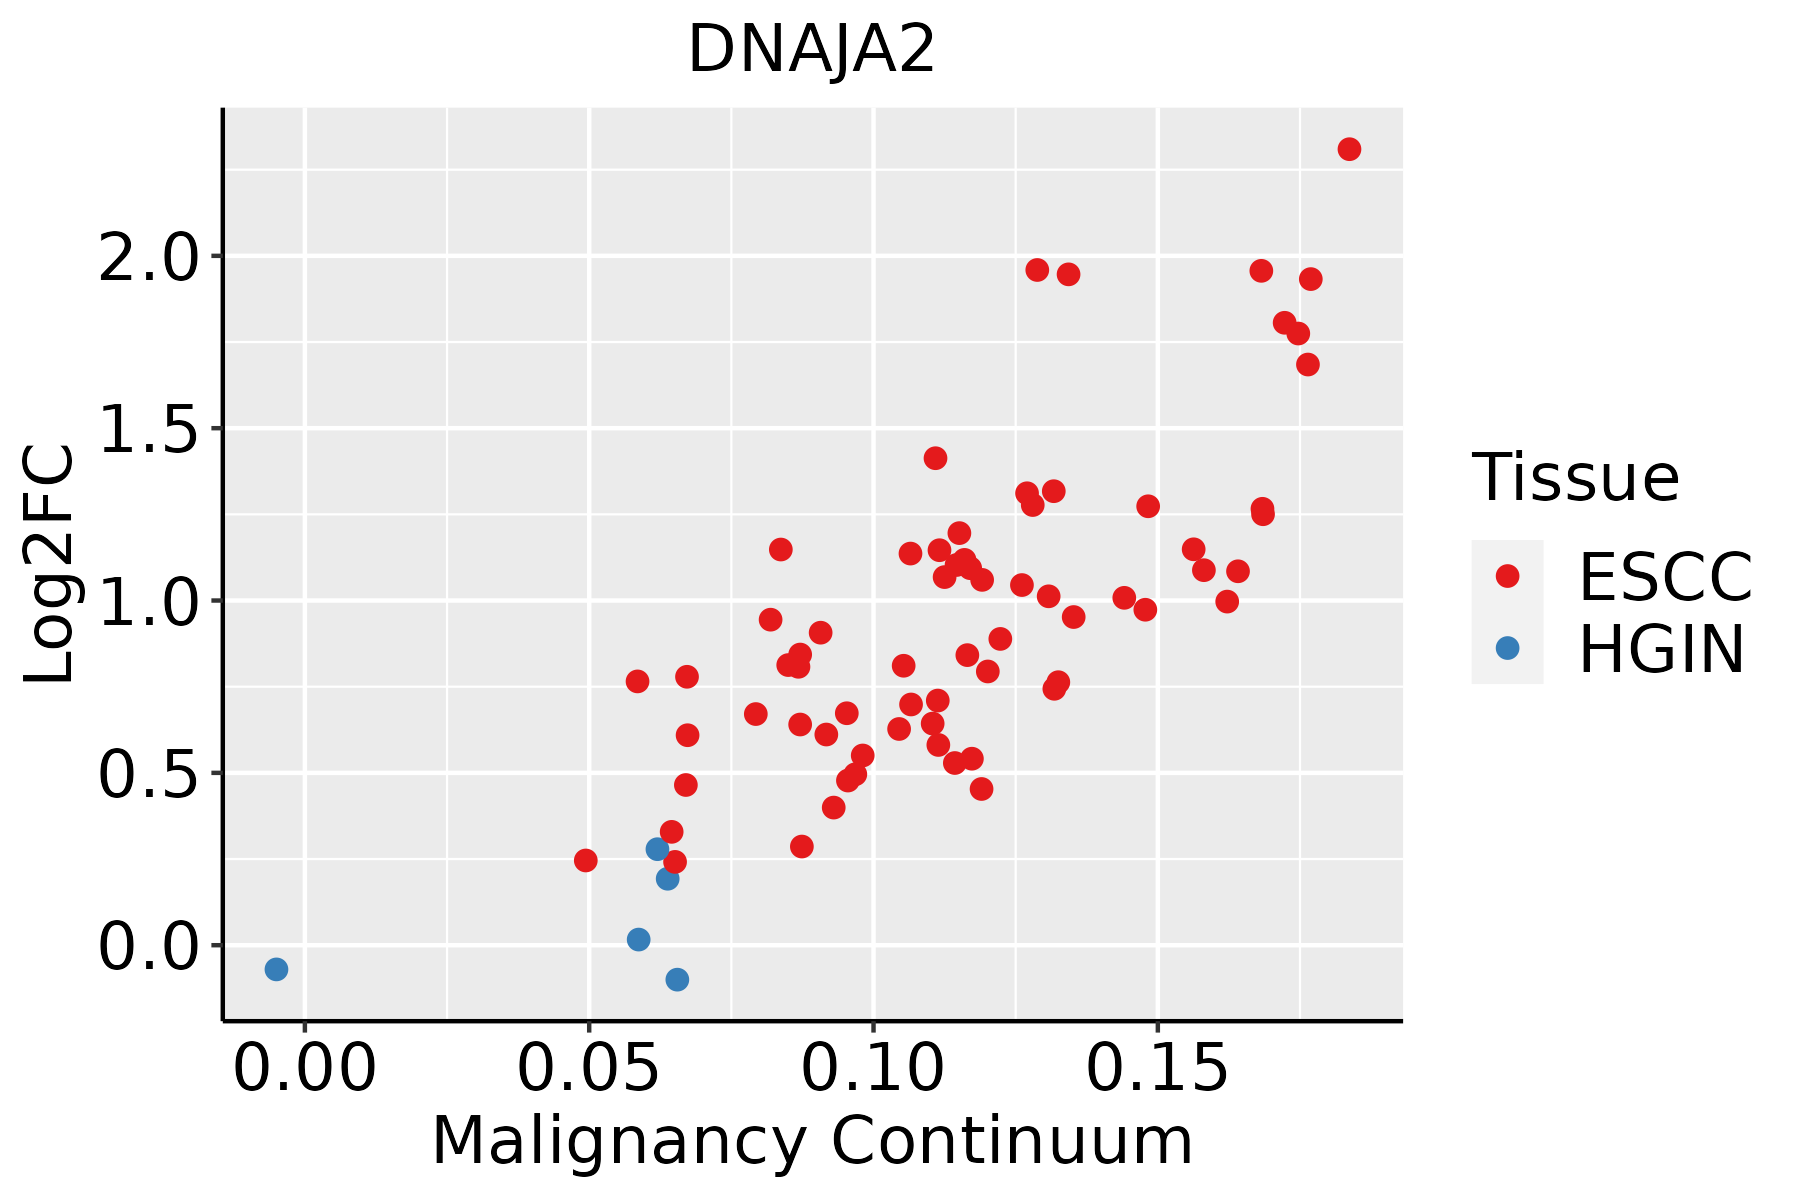 | ESCC: Esophageal squamous cell carcinoma |
| HGIN: High-grade intraepithelial neoplasias | ||
| LGIN: Low-grade intraepithelial neoplasias | ||
| Liver | 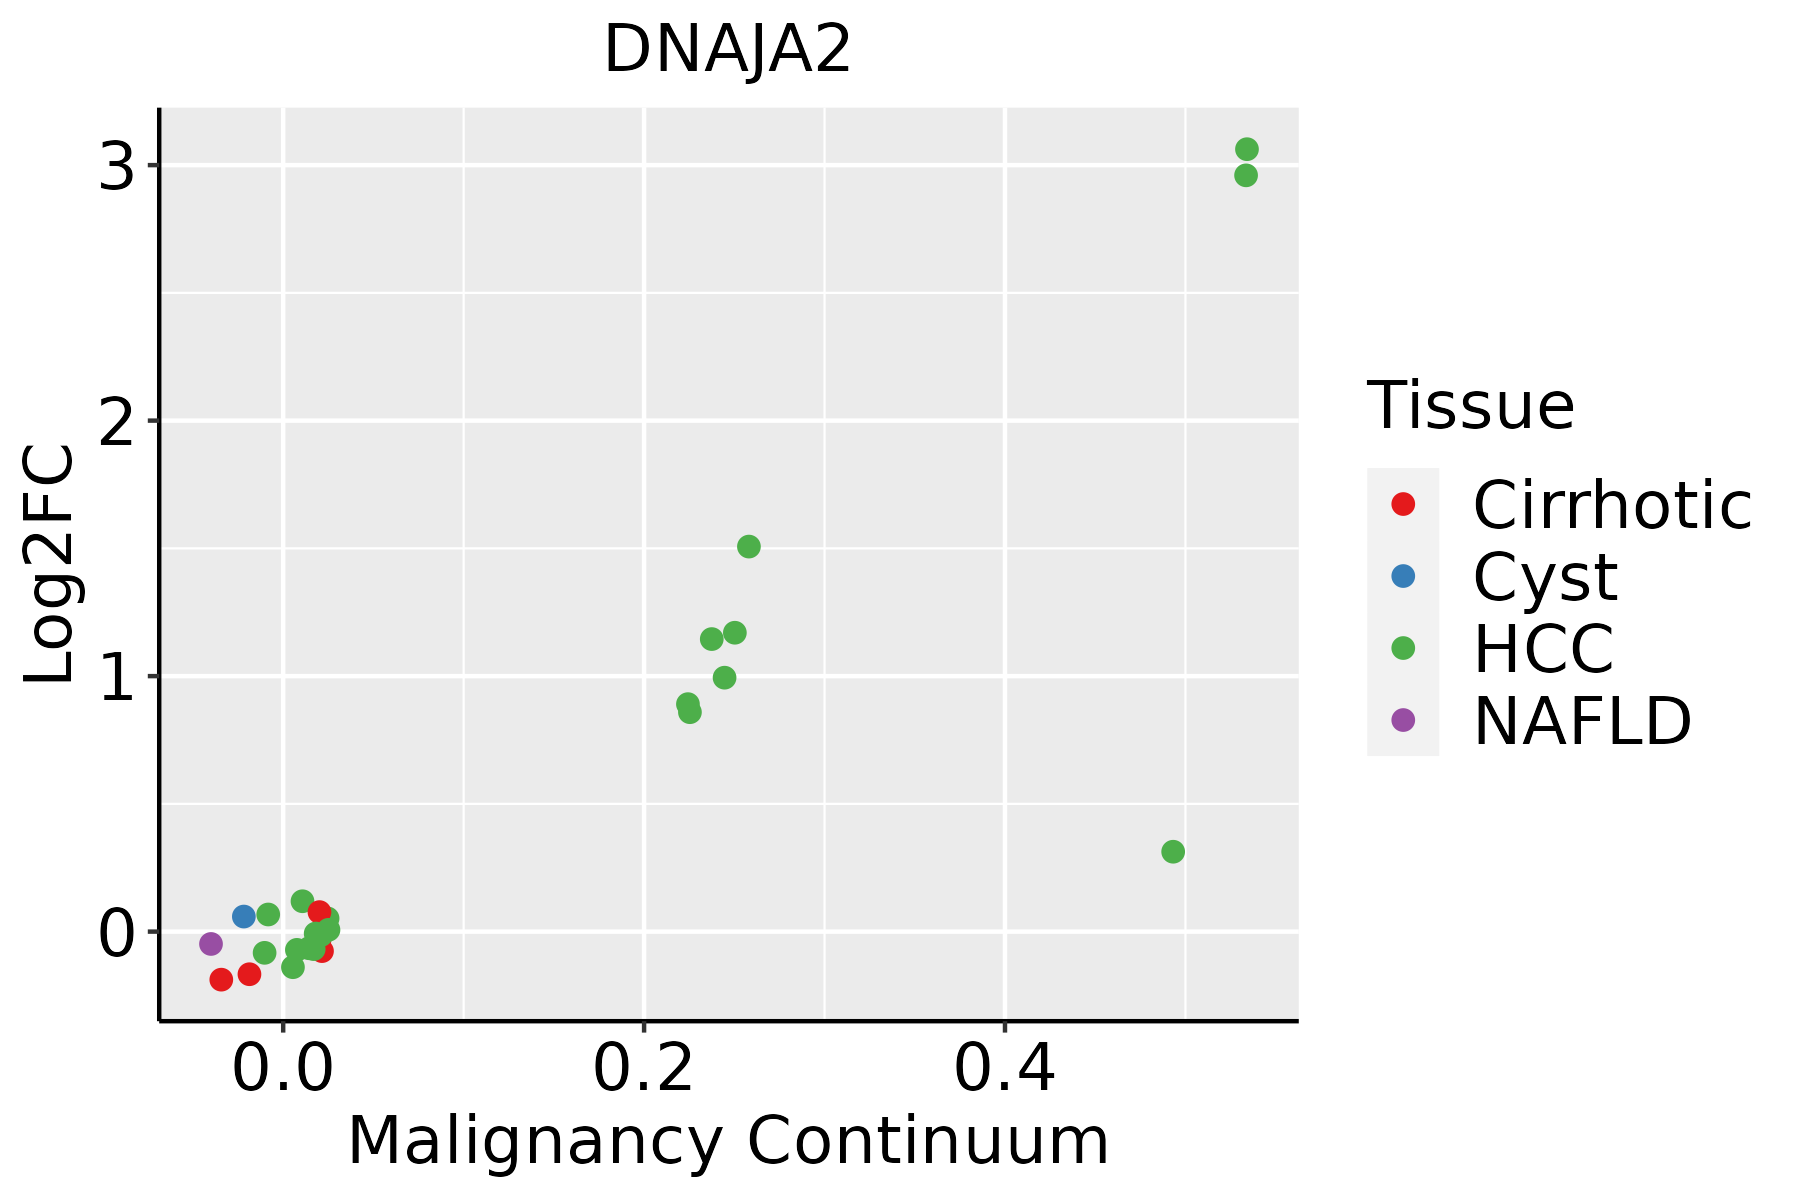 | HCC: Hepatocellular carcinoma |
| NAFLD: Non-alcoholic fatty liver disease | ||
| Oral Cavity | 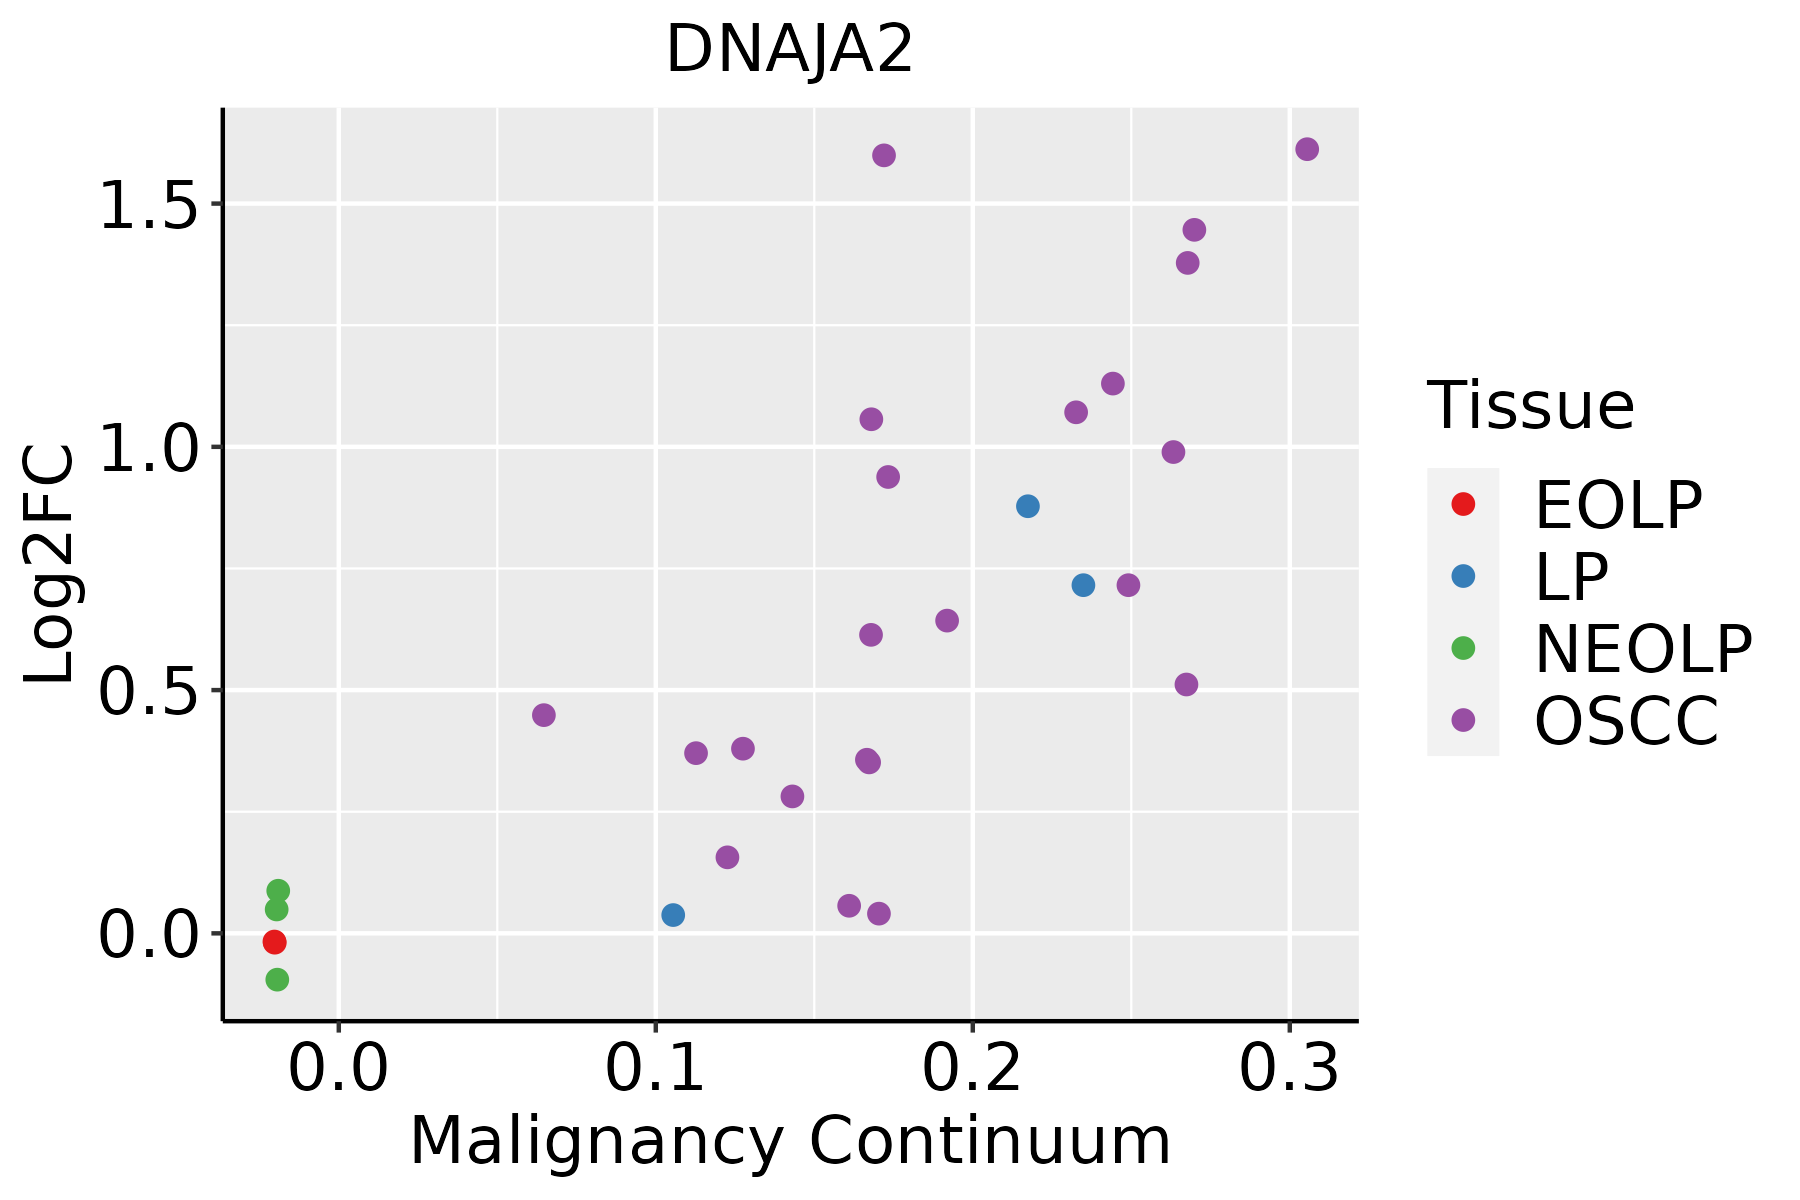 | EOLP: Erosive Oral lichen planus |
| LP: leukoplakia | ||
| NEOLP: Non-erosive oral lichen planus | ||
| OSCC: Oral squamous cell carcinoma | ||
| Prostate |  | BPH: Benign Prostatic Hyperplasia |
| Skin | 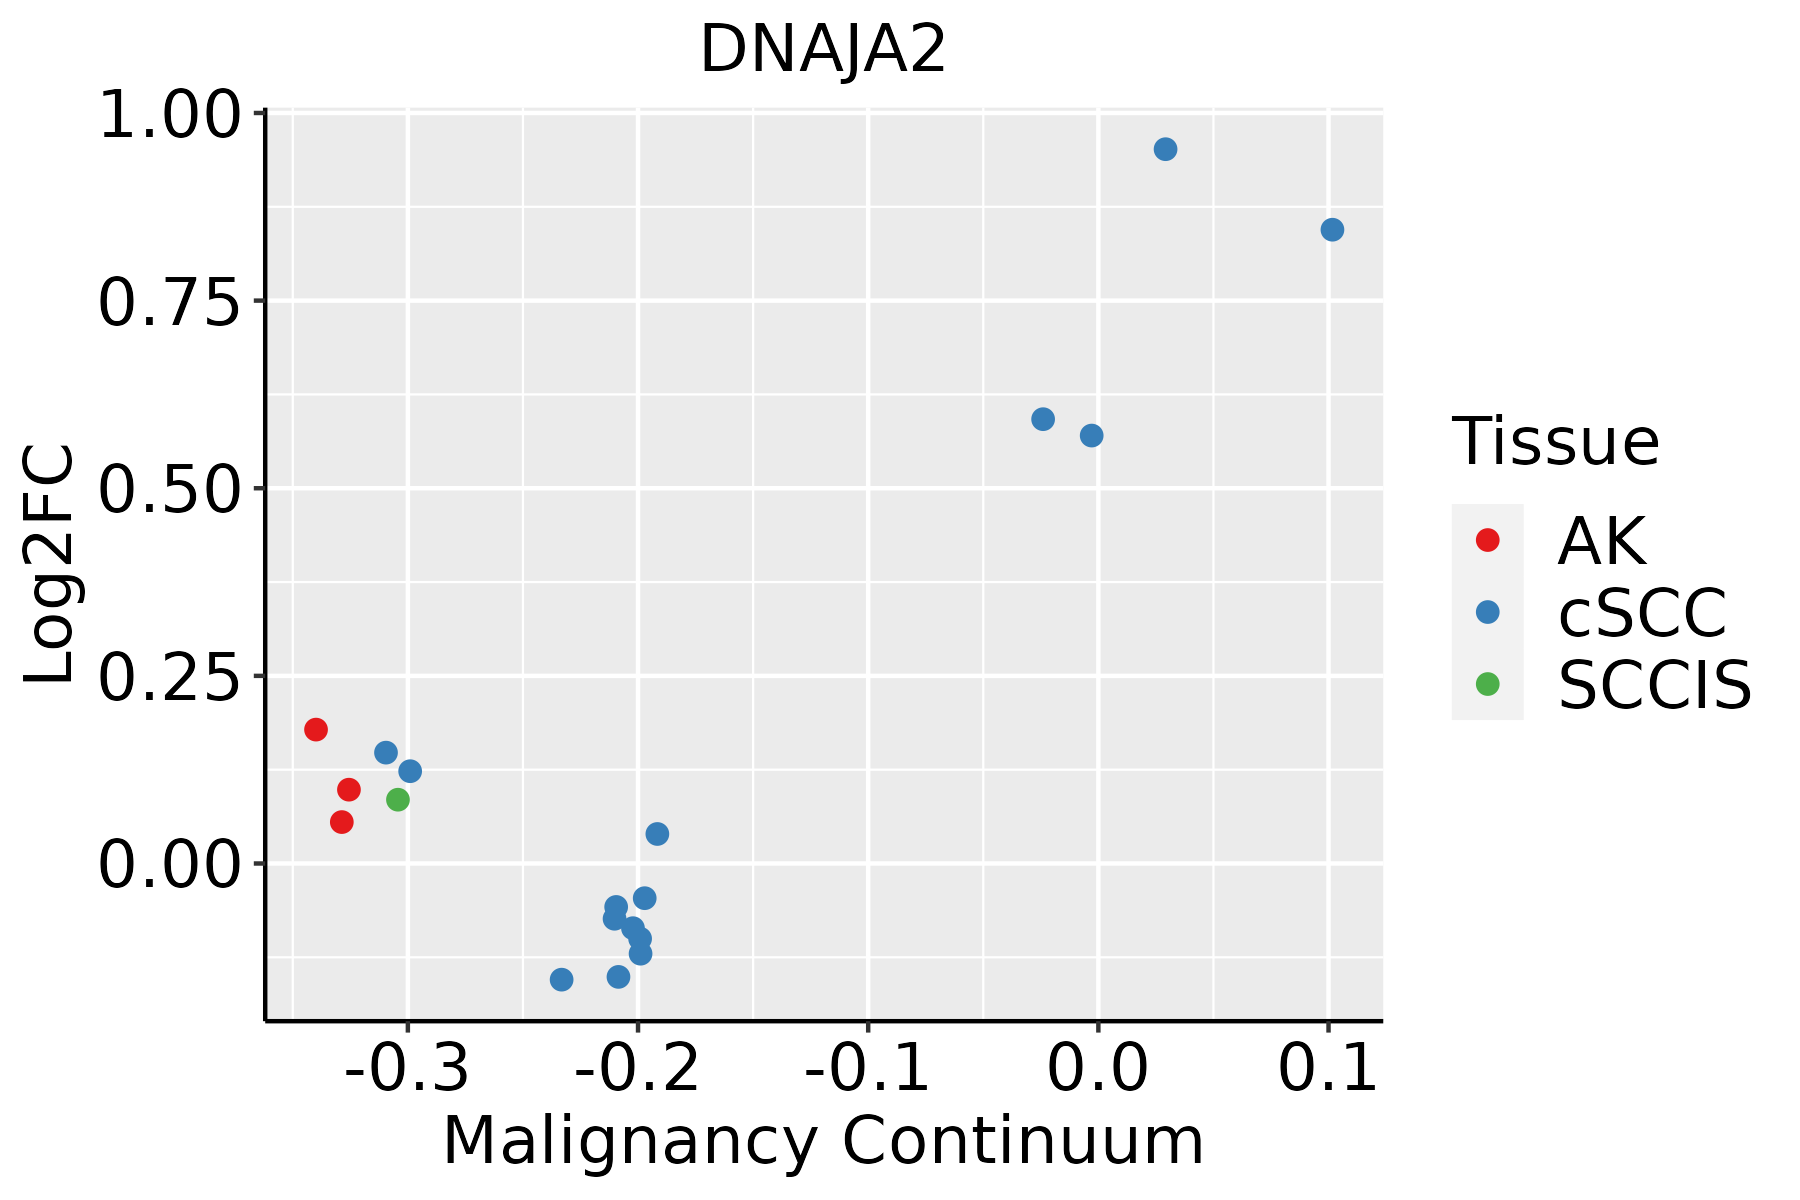 | AK: Actinic keratosis |
| cSCC: Cutaneous squamous cell carcinoma | ||
| SCCIS:squamous cell carcinoma in situ | ||
| Thyroid | 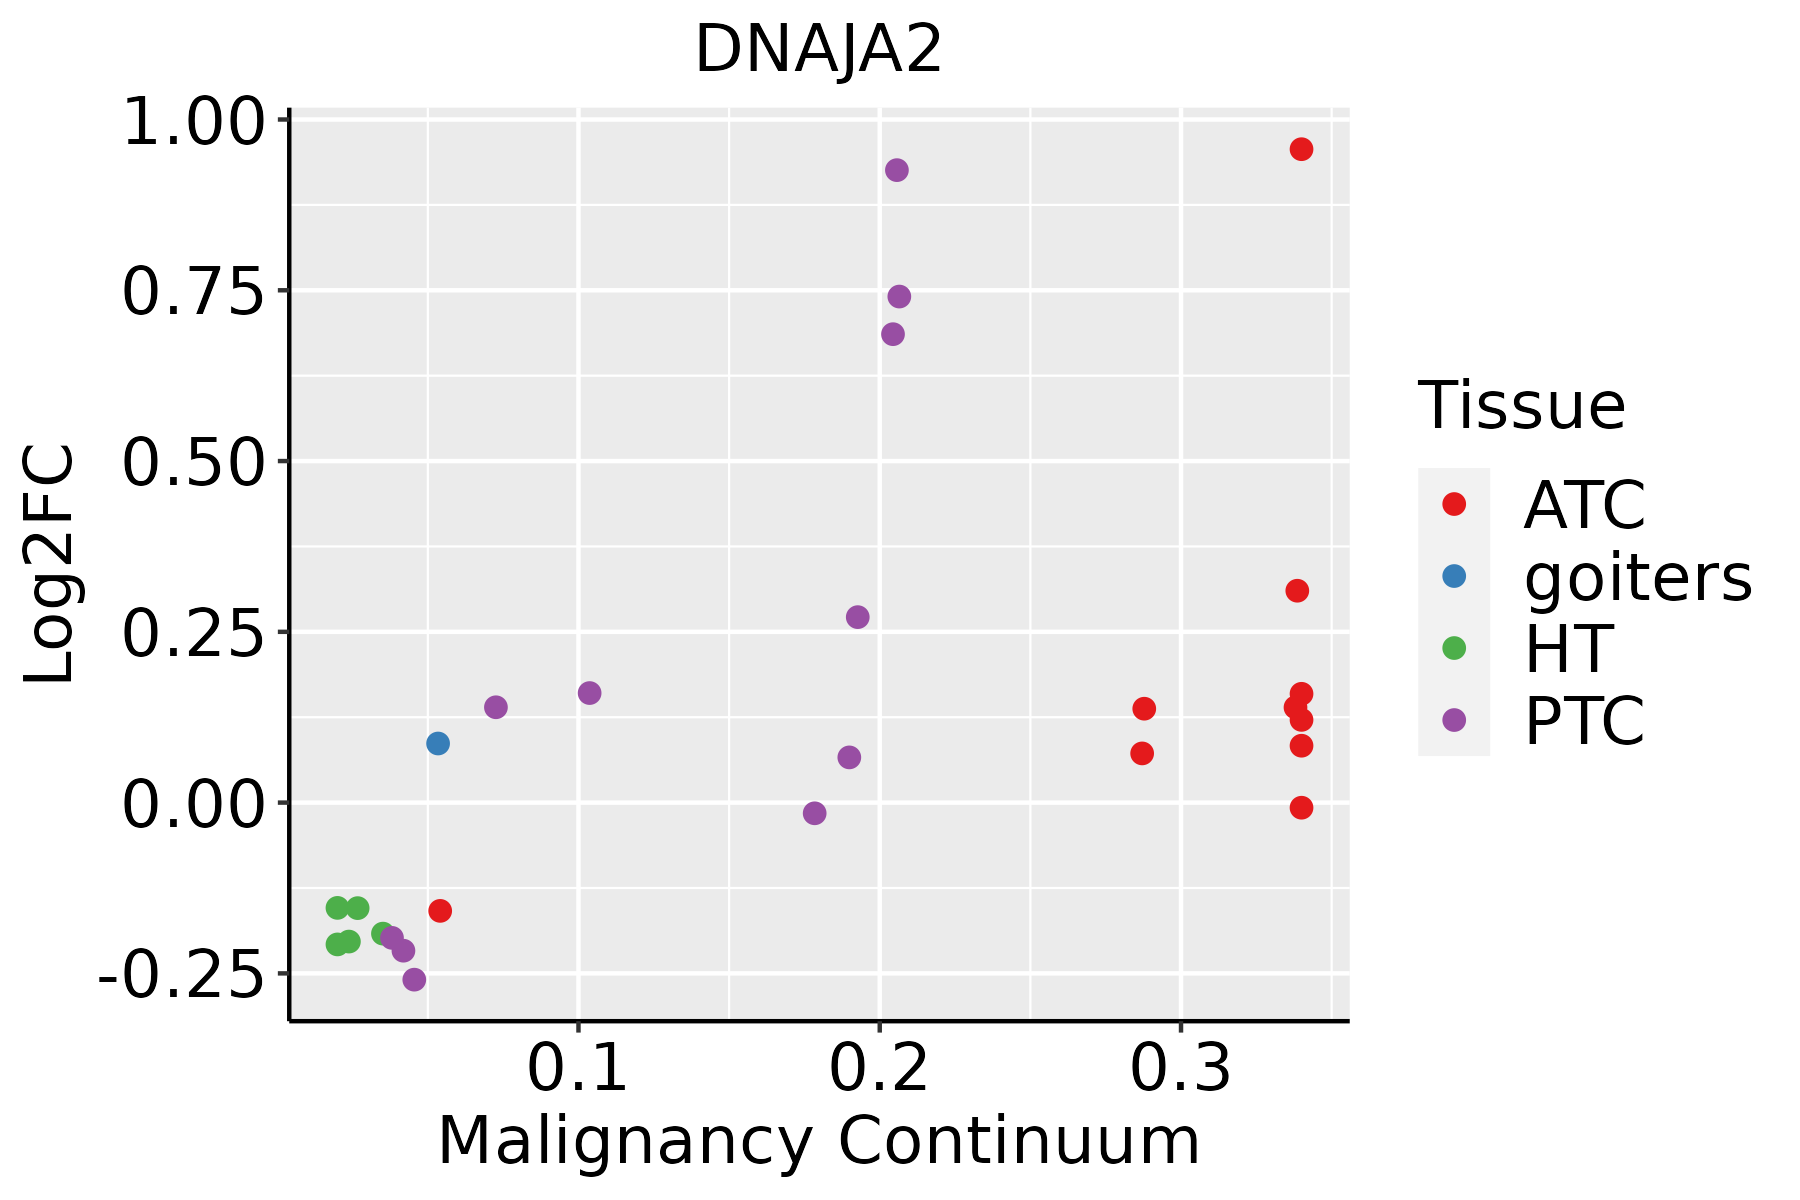 | ATC: Anaplastic thyroid cancer |
| HT: Hashimoto's thyroiditis | ||
| PTC: Papillary thyroid cancer |
| ∗log2FC in expression of this searched gene in stem-like cells from each diseased tissue sample relative to stem-like cells in normal samples in each tissue plotted against the malignancy continuum. Samples are colored based on if they are from different disease stage. |
Top |
Malignant transformation related pathway analysis |
| Find out the enriched GO biological processes and KEGG pathways involved in transition from healthy to precancer to cancer |
| Tissue | Disease Stage | Enriched GO biological Processes |
| Colorectum | AD |  |
| Colorectum | SER |  |
| Colorectum | MSS |  |
| Colorectum | MSI-H |  |
| Colorectum | FAP |  |
| ∗Top 15 enriched GO BP terms are showed in the bar plot of each disease state in each tissue. Each row represents a significant GO biological process which is colored according to the -log10(p.adjust). |
| Page: 1 2 3 4 5 6 7 8 9 |
| GO ID | Tissue | Disease Stage | Description | Gene Ratio | Bg Ratio | pvalue | p.adjust | Count |
| GO:000645720 | Esophagus | HGIN | protein folding | 75/2587 | 212/18723 | 1.61e-15 | 3.86e-13 | 75 |
| GO:000940819 | Esophagus | HGIN | response to heat | 34/2587 | 110/18723 | 2.94e-06 | 1.01e-04 | 34 |
| GO:004202620 | Esophagus | HGIN | protein refolding | 11/2587 | 23/18723 | 9.31e-05 | 2.02e-03 | 11 |
| GO:000926618 | Esophagus | HGIN | response to temperature stimulus | 42/2587 | 178/18723 | 2.91e-04 | 4.98e-03 | 42 |
| GO:0006457110 | Esophagus | ESCC | protein folding | 163/8552 | 212/18723 | 1.13e-20 | 1.74e-18 | 163 |
| GO:0009408110 | Esophagus | ESCC | response to heat | 77/8552 | 110/18723 | 2.01e-07 | 3.11e-06 | 77 |
| GO:0042026110 | Esophagus | ESCC | protein refolding | 20/8552 | 23/18723 | 4.97e-05 | 3.86e-04 | 20 |
| GO:000926619 | Esophagus | ESCC | response to temperature stimulus | 106/8552 | 178/18723 | 1.30e-04 | 8.84e-04 | 106 |
| GO:00064577 | Liver | Cirrhotic | protein folding | 114/4634 | 212/18723 | 9.23e-20 | 2.31e-17 | 114 |
| GO:00094087 | Liver | Cirrhotic | response to heat | 49/4634 | 110/18723 | 4.47e-06 | 7.42e-05 | 49 |
| GO:00420267 | Liver | Cirrhotic | protein refolding | 14/4634 | 23/18723 | 2.50e-04 | 2.26e-03 | 14 |
| GO:00092666 | Liver | Cirrhotic | response to temperature stimulus | 63/4634 | 178/18723 | 9.38e-04 | 6.66e-03 | 63 |
| GO:000645712 | Liver | HCC | protein folding | 160/7958 | 212/18723 | 1.07e-22 | 1.88e-20 | 160 |
| GO:000940811 | Liver | HCC | response to heat | 76/7958 | 110/18723 | 1.48e-08 | 3.58e-07 | 76 |
| GO:000926611 | Liver | HCC | response to temperature stimulus | 101/7958 | 178/18723 | 8.55e-05 | 7.48e-04 | 101 |
| GO:004202612 | Liver | HCC | protein refolding | 19/7958 | 23/18723 | 9.73e-05 | 8.40e-04 | 19 |
| GO:000645718 | Oral cavity | OSCC | protein folding | 154/7305 | 212/18723 | 1.89e-23 | 4.60e-21 | 154 |
| GO:000940817 | Oral cavity | OSCC | response to heat | 73/7305 | 110/18723 | 5.56e-09 | 1.21e-07 | 73 |
| GO:004202618 | Oral cavity | OSCC | protein refolding | 21/7305 | 23/18723 | 2.56e-07 | 4.00e-06 | 21 |
| GO:000926616 | Oral cavity | OSCC | response to temperature stimulus | 98/7305 | 178/18723 | 9.78e-06 | 1.03e-04 | 98 |
| Page: 1 2 |
| Pathway ID | Tissue | Disease Stage | Description | Gene Ratio | Bg Ratio | pvalue | p.adjust | qvalue | Count |
| hsa0414139 | Esophagus | HGIN | Protein processing in endoplasmic reticulum | 67/1383 | 174/8465 | 1.06e-12 | 2.16e-11 | 1.72e-11 | 67 |
| hsa04141114 | Esophagus | HGIN | Protein processing in endoplasmic reticulum | 67/1383 | 174/8465 | 1.06e-12 | 2.16e-11 | 1.72e-11 | 67 |
| hsa04141211 | Esophagus | ESCC | Protein processing in endoplasmic reticulum | 147/4205 | 174/8465 | 3.29e-22 | 1.10e-19 | 5.64e-20 | 147 |
| hsa04141310 | Esophagus | ESCC | Protein processing in endoplasmic reticulum | 147/4205 | 174/8465 | 3.29e-22 | 1.10e-19 | 5.64e-20 | 147 |
| hsa0414114 | Liver | Cirrhotic | Protein processing in endoplasmic reticulum | 114/2530 | 174/8465 | 1.16e-22 | 9.67e-21 | 5.96e-21 | 114 |
| hsa0414115 | Liver | Cirrhotic | Protein processing in endoplasmic reticulum | 114/2530 | 174/8465 | 1.16e-22 | 9.67e-21 | 5.96e-21 | 114 |
| hsa0414122 | Liver | HCC | Protein processing in endoplasmic reticulum | 146/4020 | 174/8465 | 7.34e-24 | 2.46e-21 | 1.37e-21 | 146 |
| hsa0414132 | Liver | HCC | Protein processing in endoplasmic reticulum | 146/4020 | 174/8465 | 7.34e-24 | 2.46e-21 | 1.37e-21 | 146 |
| hsa0414130 | Oral cavity | OSCC | Protein processing in endoplasmic reticulum | 143/3704 | 174/8465 | 6.82e-26 | 2.28e-23 | 1.16e-23 | 143 |
| hsa04141113 | Oral cavity | OSCC | Protein processing in endoplasmic reticulum | 143/3704 | 174/8465 | 6.82e-26 | 2.28e-23 | 1.16e-23 | 143 |
| hsa0414128 | Prostate | BPH | Protein processing in endoplasmic reticulum | 97/1718 | 174/8465 | 2.37e-25 | 1.30e-23 | 8.07e-24 | 97 |
| hsa04141112 | Prostate | BPH | Protein processing in endoplasmic reticulum | 97/1718 | 174/8465 | 2.37e-25 | 1.30e-23 | 8.07e-24 | 97 |
| hsa0414129 | Prostate | Tumor | Protein processing in endoplasmic reticulum | 99/1791 | 174/8465 | 2.58e-25 | 1.71e-23 | 1.06e-23 | 99 |
| hsa0414137 | Prostate | Tumor | Protein processing in endoplasmic reticulum | 99/1791 | 174/8465 | 2.58e-25 | 1.71e-23 | 1.06e-23 | 99 |
| Page: 1 |
Top |
Cell-cell communication analysis |
| Identification of potential cell-cell interactions between two cell types and their ligand-receptor pairs for different disease states |
| Ligand | Receptor | LRpair | Pathway | Tissue | Disease Stage |
| Page: 1 |
Top |
Single-cell gene regulatory network inference analysis |
| Find out the significant the regulons (TFs) and the target genes of each regulon across cell types for different disease states |
| TF | Cell Type | Tissue | Disease Stage | Target Gene | RSS | Regulon Activity |
| ∗The dot plots of a searched regulon are shown for all cell subpopulations in each disease state of each tissue based on the regulon specific score inferred using pySCENIC and by calculating the average expression. |
| Page: 1 |
Top |
Somatic mutation of malignant transformation related genes |
| Annotation of somatic variants for genes involved in malignant transformation |
| Hugo Symbol | Variant Class | Variant Classification | dbSNP RS | HGVSc | HGVSp | HGVSp Short | SWISSPROT | BIOTYPE | SIFT | PolyPhen | Tumor Sample Barcode | Tissue | Histology | Sex | Age | Stage | Therapy Types | Drugs | Outcome |
| DNAJA2 | SNV | Missense_Mutation | novel | c.961N>T | p.Arg321Cys | p.R321C | O60884 | protein_coding | deleterious(0) | possibly_damaging(0.906) | TCGA-AN-A0AK-01 | Breast | breast invasive carcinoma | Female | >=65 | I/II | Unknown | Unknown | SD |
| DNAJA2 | SNV | Missense_Mutation | c.1070N>G | p.Ser357Cys | p.S357C | O60884 | protein_coding | deleterious(0) | benign(0.293) | TCGA-D8-A142-01 | Breast | breast invasive carcinoma | Female | >=65 | I/II | Chemotherapy | cyclophosphamid | SD | |
| DNAJA2 | SNV | Missense_Mutation | c.979G>C | p.Gly327Arg | p.G327R | O60884 | protein_coding | deleterious(0) | probably_damaging(0.97) | TCGA-C5-A7CO-01 | Cervix | cervical & endocervical cancer | Female | >=65 | I/II | Chemotherapy | cisplatin | SD | |
| DNAJA2 | SNV | Missense_Mutation | rs768986577 | c.235N>A | p.Gly79Ser | p.G79S | O60884 | protein_coding | tolerated(0.43) | benign(0.015) | TCGA-EA-A3HS-01 | Cervix | cervical & endocervical cancer | Female | <65 | I/II | Unknown | Unknown | SD |
| DNAJA2 | SNV | Missense_Mutation | c.430A>G | p.Ser144Gly | p.S144G | O60884 | protein_coding | tolerated(0.28) | benign(0.001) | TCGA-AY-6196-01 | Colorectum | colon adenocarcinoma | Male | <65 | III/IV | Unknown | Unknown | SD | |
| DNAJA2 | SNV | Missense_Mutation | c.689N>T | p.Arg230Ile | p.R230I | O60884 | protein_coding | deleterious(0) | possibly_damaging(0.453) | TCGA-AG-A002-01 | Colorectum | rectum adenocarcinoma | Male | <65 | I/II | Unknown | Unknown | SD | |
| DNAJA2 | SNV | Missense_Mutation | novel | c.748N>A | p.Leu250Ile | p.L250I | O60884 | protein_coding | tolerated(1) | benign(0.03) | TCGA-F5-6814-01 | Colorectum | rectum adenocarcinoma | Male | <65 | I/II | Unknown | Unknown | SD |
| DNAJA2 | SNV | Missense_Mutation | novel | c.833N>A | p.Ala278Asp | p.A278D | O60884 | protein_coding | deleterious(0) | probably_damaging(0.99) | TCGA-A5-A0G2-01 | Endometrium | uterine corpus endometrioid carcinoma | Female | <65 | III/IV | Unknown | Unknown | SD |
| DNAJA2 | SNV | Missense_Mutation | novel | c.510N>A | p.Met170Ile | p.M170I | O60884 | protein_coding | tolerated(0.22) | benign(0.013) | TCGA-A5-A0G2-01 | Endometrium | uterine corpus endometrioid carcinoma | Female | <65 | III/IV | Unknown | Unknown | SD |
| DNAJA2 | SNV | Missense_Mutation | novel | c.309N>T | p.Gln103His | p.Q103H | O60884 | protein_coding | tolerated(0.24) | benign(0.003) | TCGA-A5-A0G2-01 | Endometrium | uterine corpus endometrioid carcinoma | Female | <65 | III/IV | Unknown | Unknown | SD |
| Page: 1 2 3 4 5 |
Top |
Related drugs of malignant transformation related genes |
| Identification of chemicals and drugs interact with genes involved in malignant transfromation |
| (DGIdb 4.0) |
| Entrez ID | Symbol | Category | Interaction Types | Drug Claim Name | Drug Name | PMIDs |
| Page: 1 |

Copyright 2023-Present -The University of Texas Health Science Center at Houston |