
|
|||||
|
 | |
| |
| |
| |
| |
| |
|
Gene: DNAJA1 |
Gene summary for DNAJA1 |
| Gene information | Species | Human | Gene symbol | DNAJA1 | Gene ID | 3301 |
| Gene name | DnaJ heat shock protein family (Hsp40) member A1 | |
| Gene Alias | DJ-2 | |
| Cytomap | 9p21.1 | |
| Gene Type | protein-coding | GO ID | GO:0000003 | UniProtAcc | B7Z5C0 |
Top |
Malignant transformation analysis |
| Identification of the aberrant gene expression in precancerous and cancerous lesions by comparing the gene expression of stem-like cells in diseased tissues with normal stem cells |
| Entrez ID | Symbol | Replicates | Species | Organ | Tissue | Adj P-value | Log2FC | Malignancy |
| 3301 | DNAJA1 | GSM4909277 | Human | Breast | Precancer | 1.05e-04 | 7.29e-01 | 0.0177 |
| 3301 | DNAJA1 | GSM4909285 | Human | Breast | IDC | 3.33e-06 | -1.37e-02 | 0.21 |
| 3301 | DNAJA1 | GSM4909286 | Human | Breast | IDC | 3.41e-23 | -6.49e-01 | 0.1081 |
| 3301 | DNAJA1 | GSM4909293 | Human | Breast | IDC | 1.45e-06 | 1.23e-01 | 0.1581 |
| 3301 | DNAJA1 | GSM4909296 | Human | Breast | IDC | 1.87e-10 | -5.15e-01 | 0.1524 |
| 3301 | DNAJA1 | GSM4909297 | Human | Breast | IDC | 3.01e-07 | -2.29e-01 | 0.1517 |
| 3301 | DNAJA1 | GSM4909298 | Human | Breast | IDC | 2.01e-15 | -4.38e-01 | 0.1551 |
| 3301 | DNAJA1 | GSM4909302 | Human | Breast | IDC | 1.26e-09 | -5.09e-01 | 0.1545 |
| 3301 | DNAJA1 | GSM4909304 | Human | Breast | IDC | 3.08e-03 | -2.40e-01 | 0.1636 |
| 3301 | DNAJA1 | GSM4909306 | Human | Breast | IDC | 1.67e-05 | -3.82e-01 | 0.1564 |
| 3301 | DNAJA1 | GSM4909307 | Human | Breast | IDC | 6.71e-13 | -5.89e-01 | 0.1569 |
| 3301 | DNAJA1 | GSM4909308 | Human | Breast | IDC | 2.10e-06 | -3.07e-01 | 0.158 |
| 3301 | DNAJA1 | GSM4909309 | Human | Breast | IDC | 3.54e-05 | -4.19e-01 | 0.0483 |
| 3301 | DNAJA1 | GSM4909311 | Human | Breast | IDC | 2.21e-40 | -8.25e-01 | 0.1534 |
| 3301 | DNAJA1 | GSM4909312 | Human | Breast | IDC | 8.90e-20 | -6.19e-01 | 0.1552 |
| 3301 | DNAJA1 | GSM4909313 | Human | Breast | IDC | 3.06e-17 | -6.58e-01 | 0.0391 |
| 3301 | DNAJA1 | GSM4909315 | Human | Breast | IDC | 2.34e-09 | -5.10e-01 | 0.21 |
| 3301 | DNAJA1 | GSM4909316 | Human | Breast | IDC | 4.33e-04 | -5.85e-01 | 0.21 |
| 3301 | DNAJA1 | GSM4909317 | Human | Breast | IDC | 6.70e-08 | 4.27e-01 | 0.1355 |
| 3301 | DNAJA1 | GSM4909319 | Human | Breast | IDC | 6.86e-38 | -6.22e-01 | 0.1563 |
| Page: 1 2 3 4 5 6 7 8 9 10 11 12 13 14 15 |
| Tissue | Expression Dynamics | Abbreviation |
| Breast |  | IDC: Invasive ductal carcinoma |
| DCIS: Ductal carcinoma in situ | ||
| Precancer(BRCA1-mut): Precancerous lesion from BRCA1 mutation carriers | ||
| Cervix | 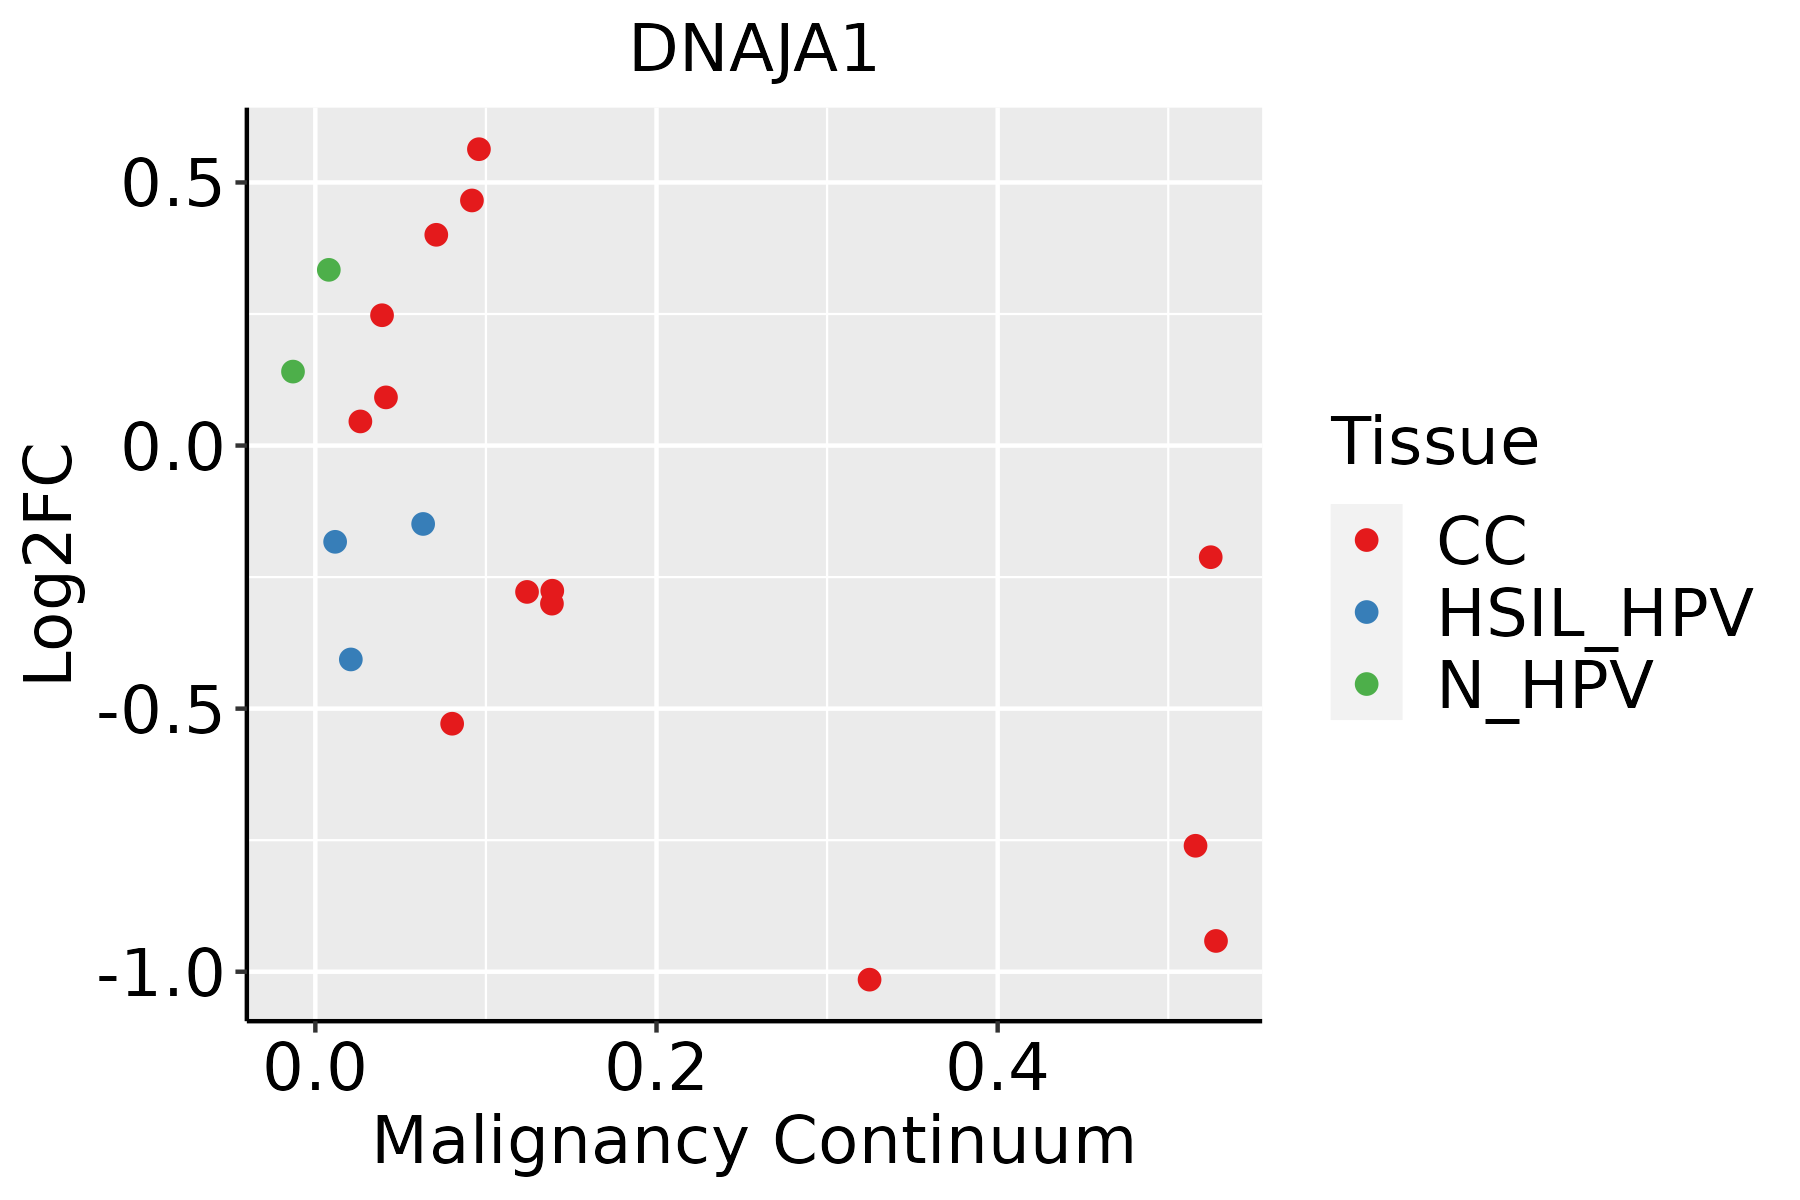 | CC: Cervix cancer |
| HSIL_HPV: HPV-infected high-grade squamous intraepithelial lesions | ||
| N_HPV: HPV-infected normal cervix | ||
| Colorectum (GSE201348) |  | FAP: Familial adenomatous polyposis |
| CRC: Colorectal cancer | ||
| Colorectum (HTA11) |  | AD: Adenomas |
| SER: Sessile serrated lesions | ||
| MSI-H: Microsatellite-high colorectal cancer | ||
| MSS: Microsatellite stable colorectal cancer | ||
| Endometrium | 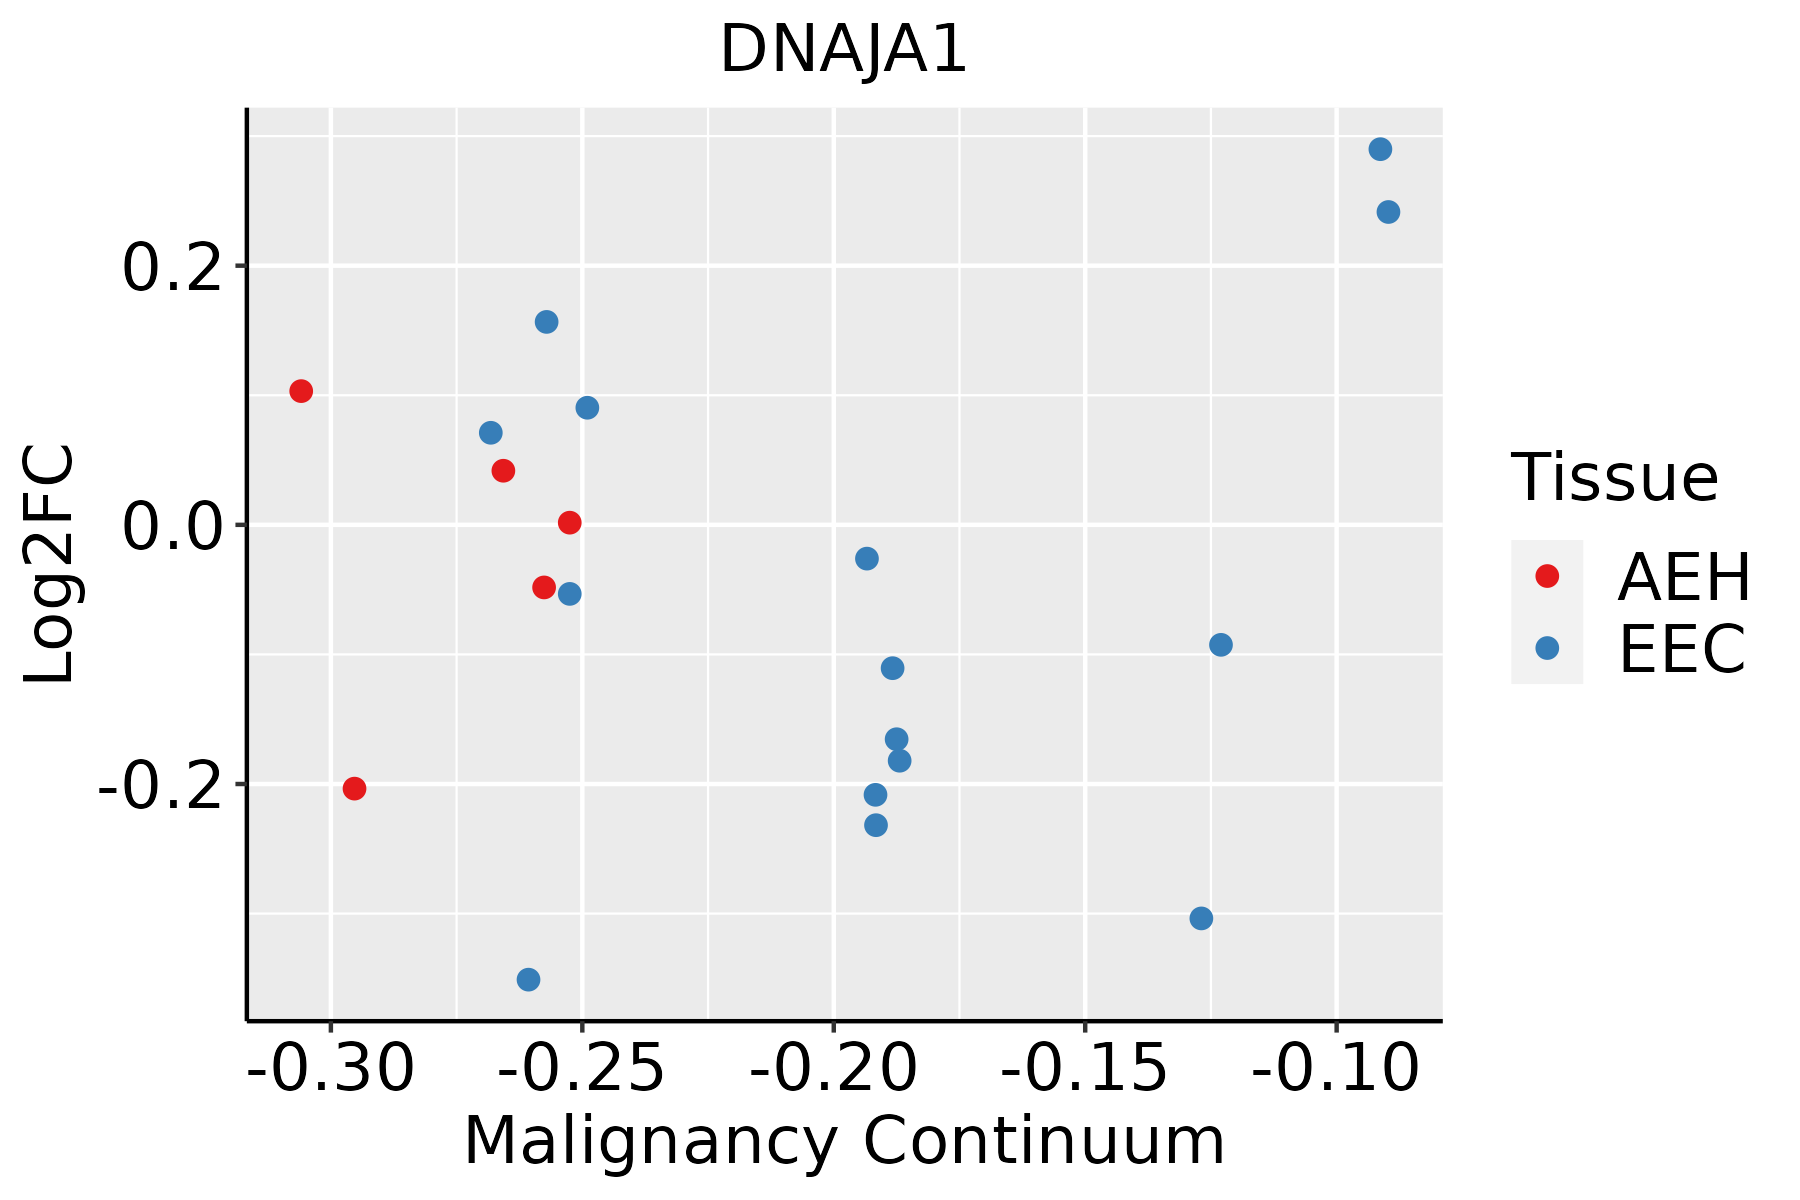 | AEH: Atypical endometrial hyperplasia |
| EEC: Endometrioid Cancer | ||
| Esophagus | 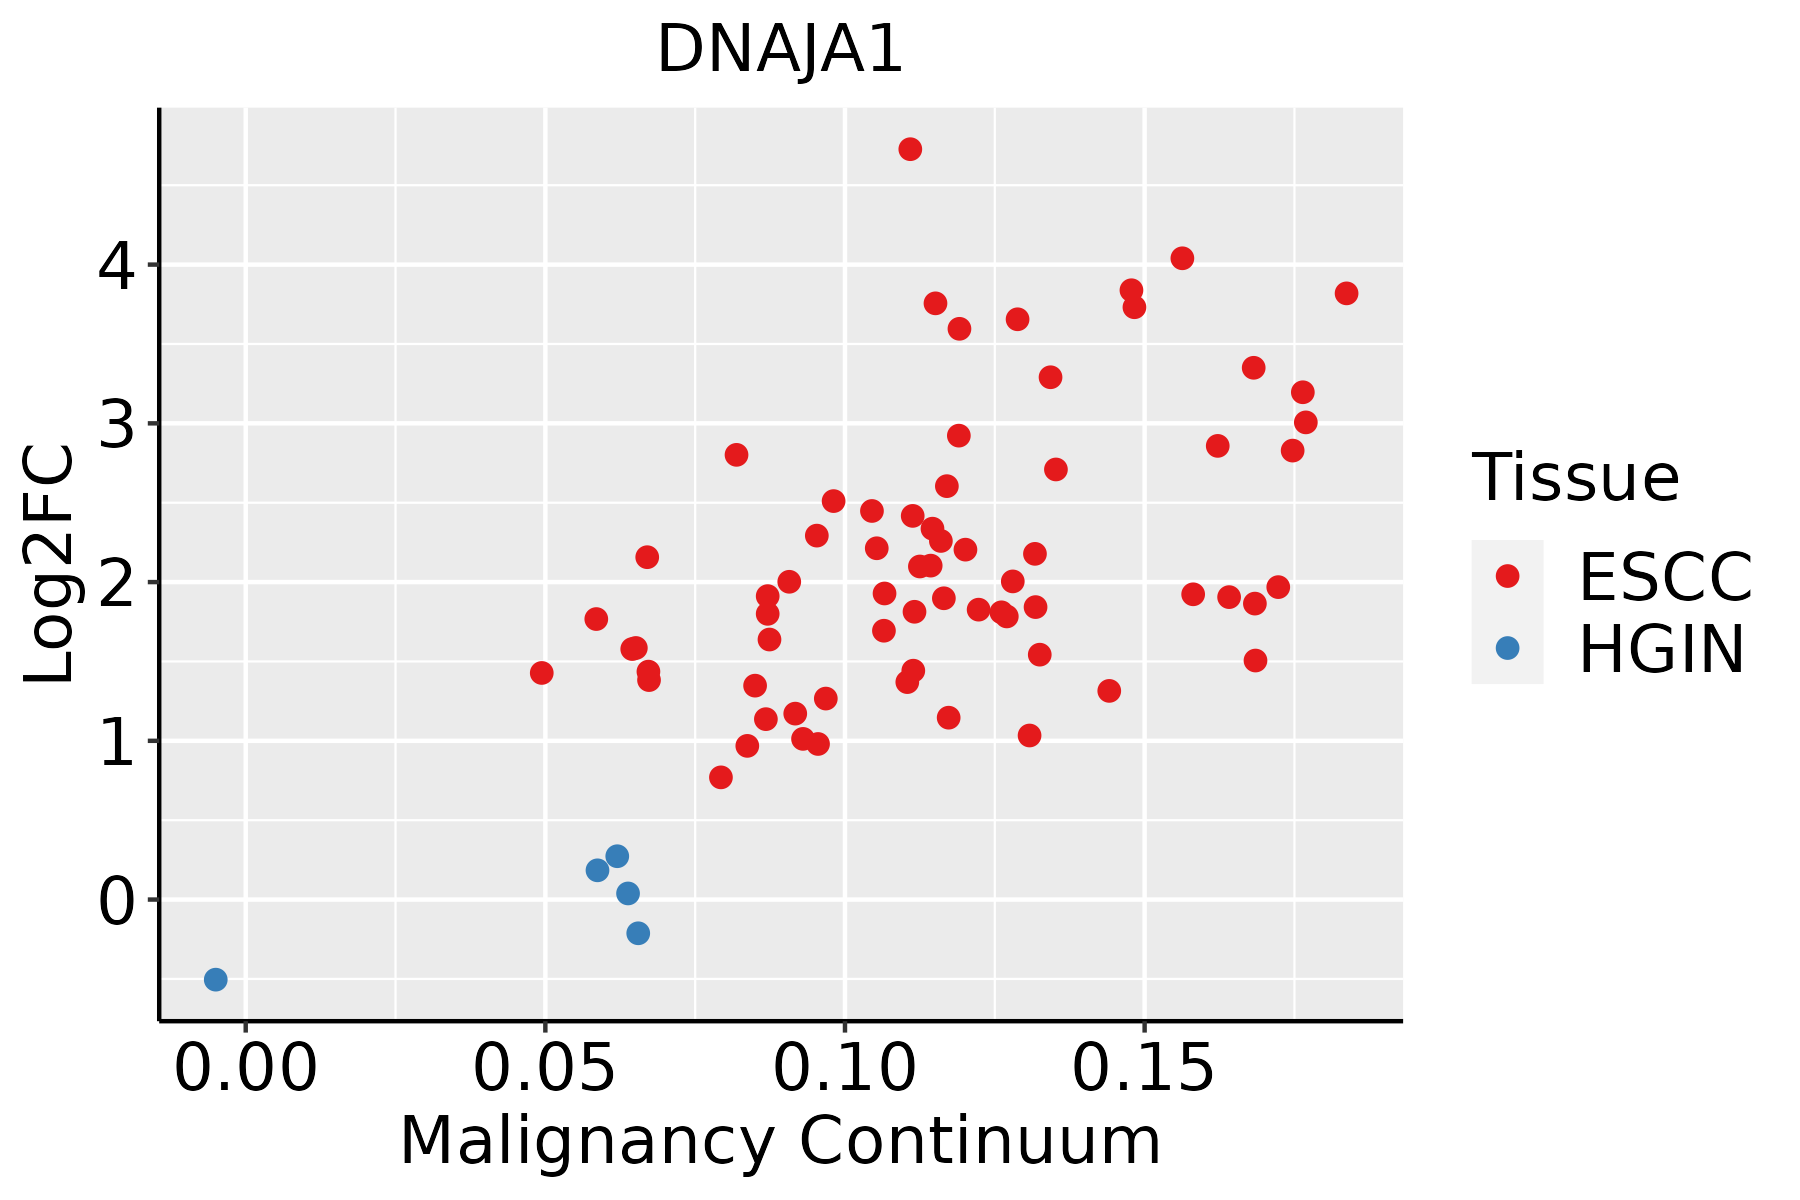 | ESCC: Esophageal squamous cell carcinoma |
| HGIN: High-grade intraepithelial neoplasias | ||
| LGIN: Low-grade intraepithelial neoplasias | ||
| GC | 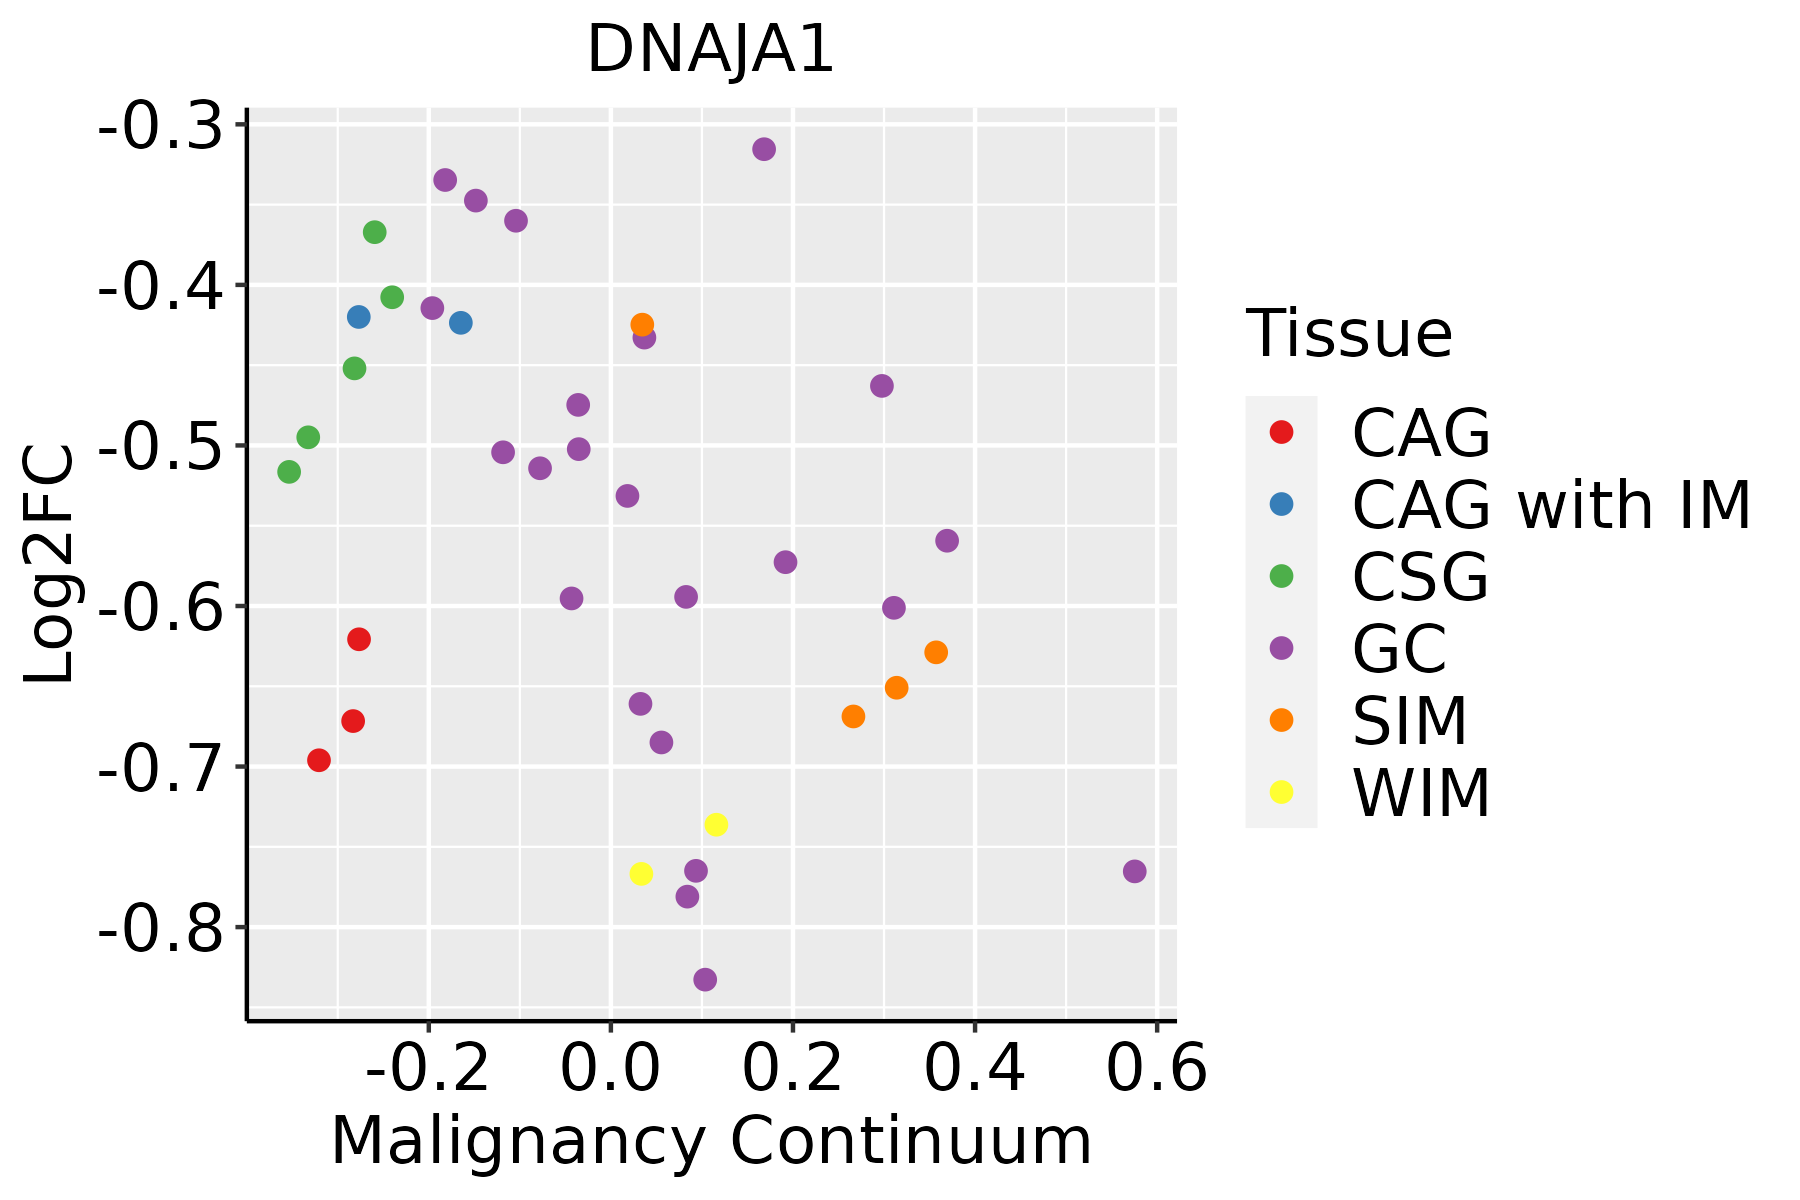 | CAG: Chronic atrophic gastritis |
| CAG with IM: Chronic atrophic gastritis with intestinal metaplasia | ||
| CSG: Chronic superficial gastritis | ||
| GC: Gastric cancer | ||
| SIM: Severe intestinal metaplasia | ||
| WIM: Wild intestinal metaplasia | ||
| Liver | 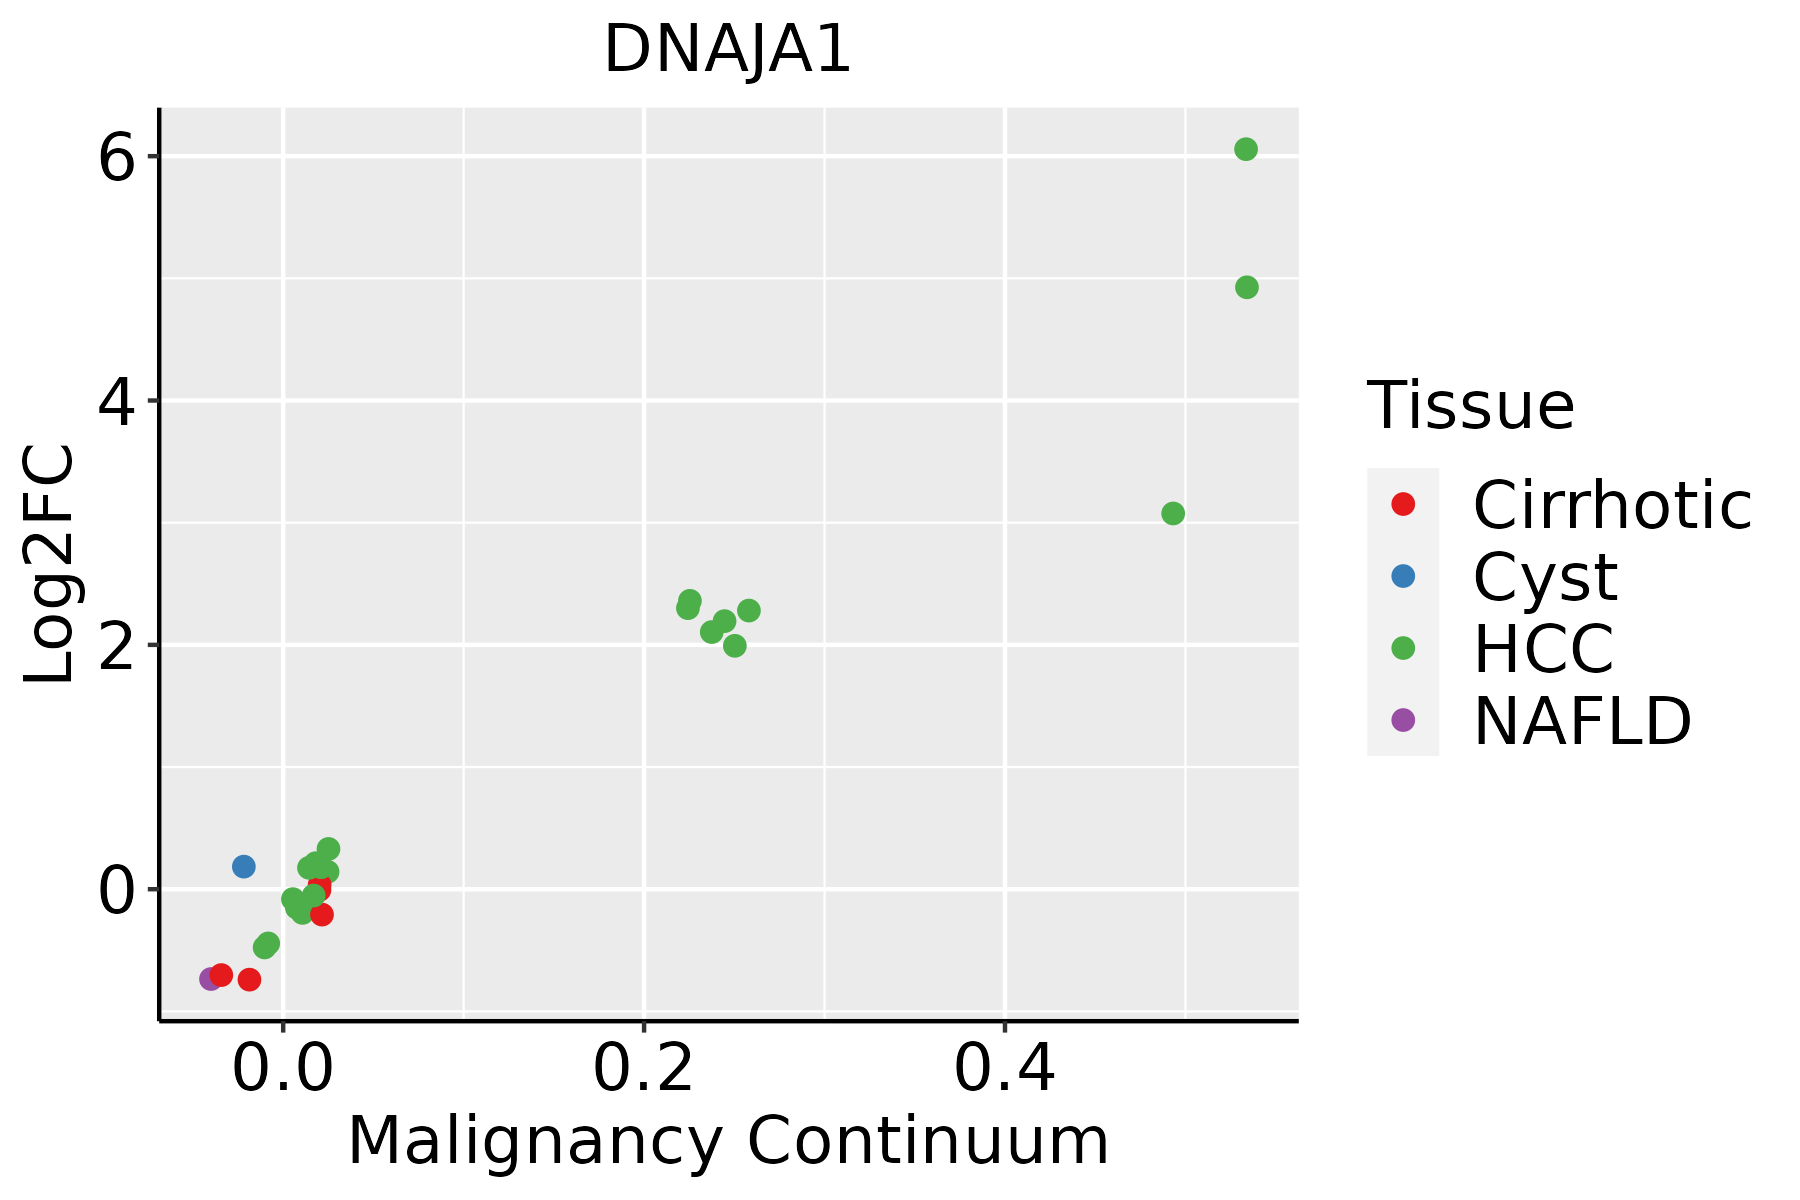 | HCC: Hepatocellular carcinoma |
| NAFLD: Non-alcoholic fatty liver disease | ||
| Lung |  | AAH: Atypical adenomatous hyperplasia |
| AIS: Adenocarcinoma in situ | ||
| IAC: Invasive lung adenocarcinoma | ||
| MIA: Minimally invasive adenocarcinoma | ||
| Oral Cavity | 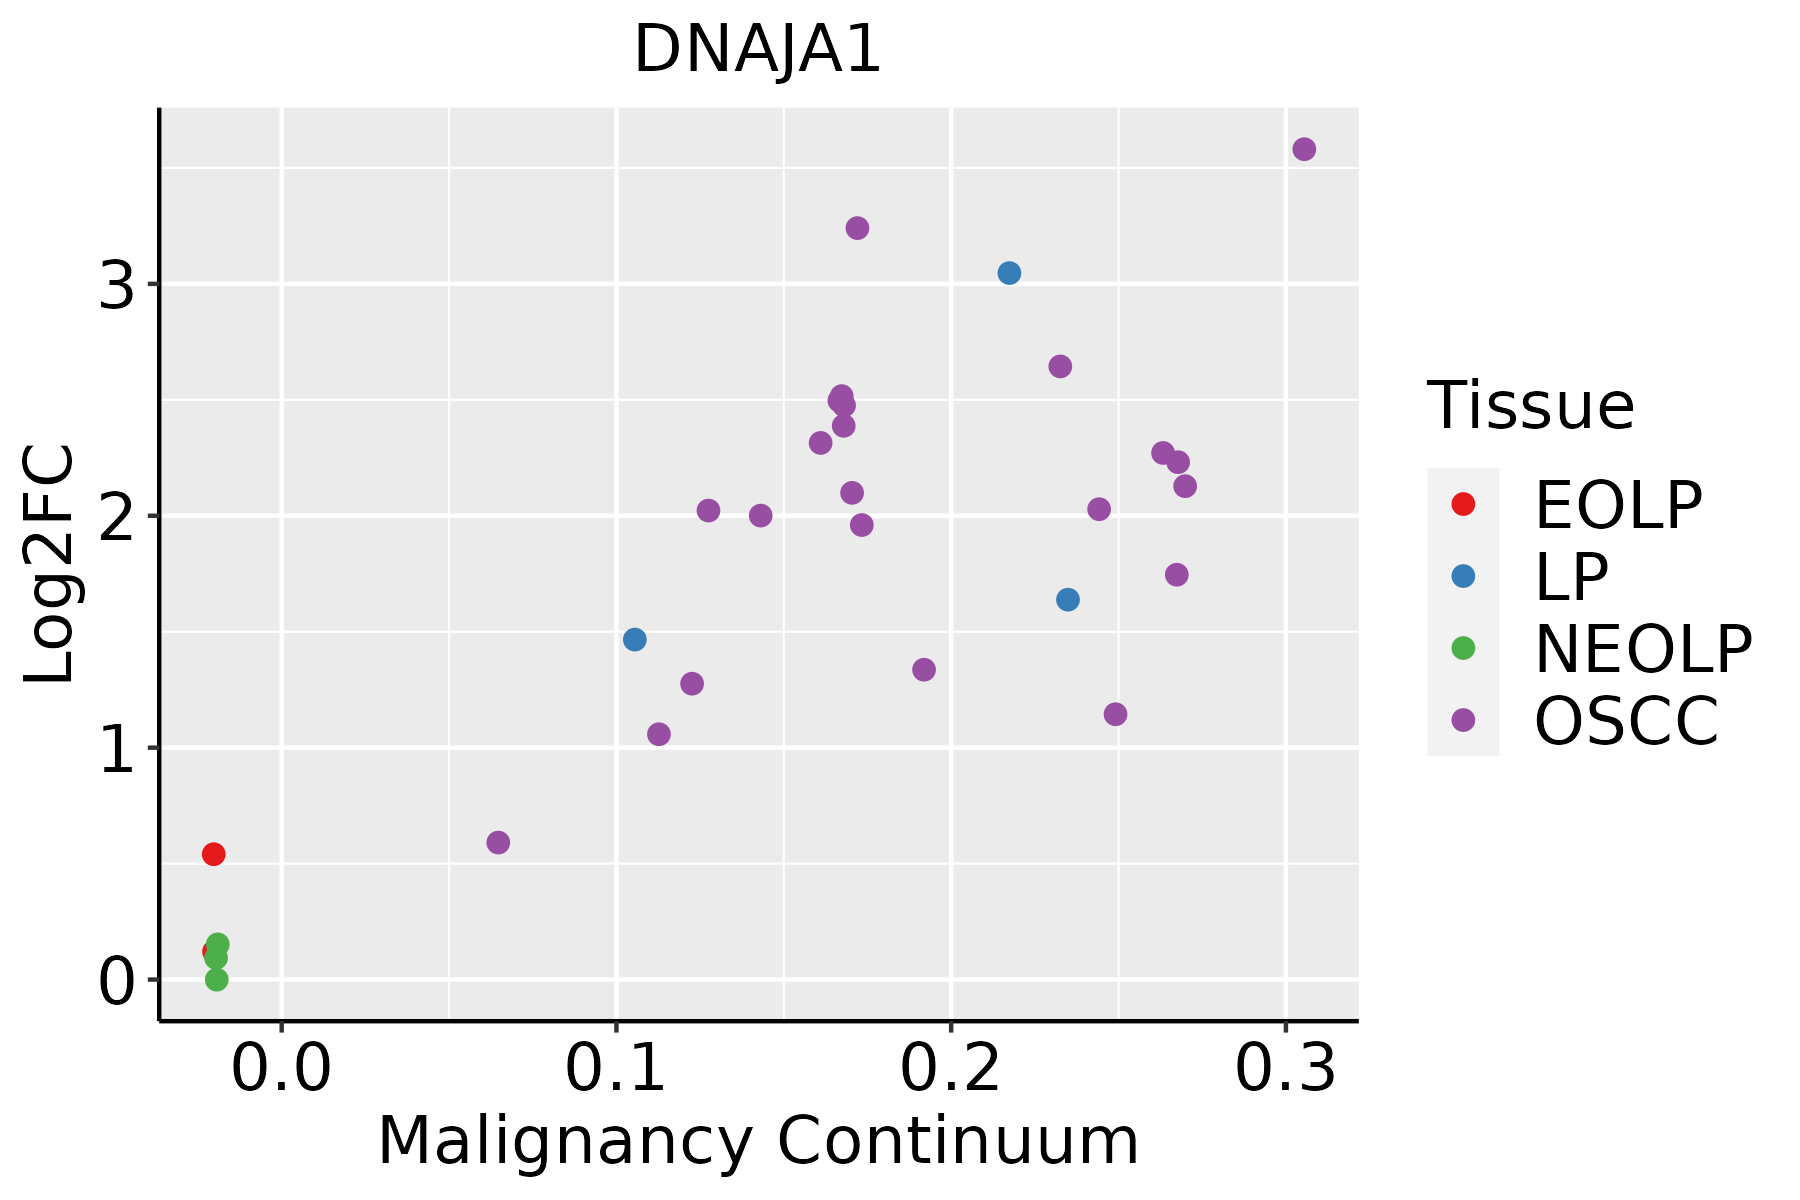 | EOLP: Erosive Oral lichen planus |
| LP: leukoplakia | ||
| NEOLP: Non-erosive oral lichen planus | ||
| OSCC: Oral squamous cell carcinoma | ||
| Prostate | 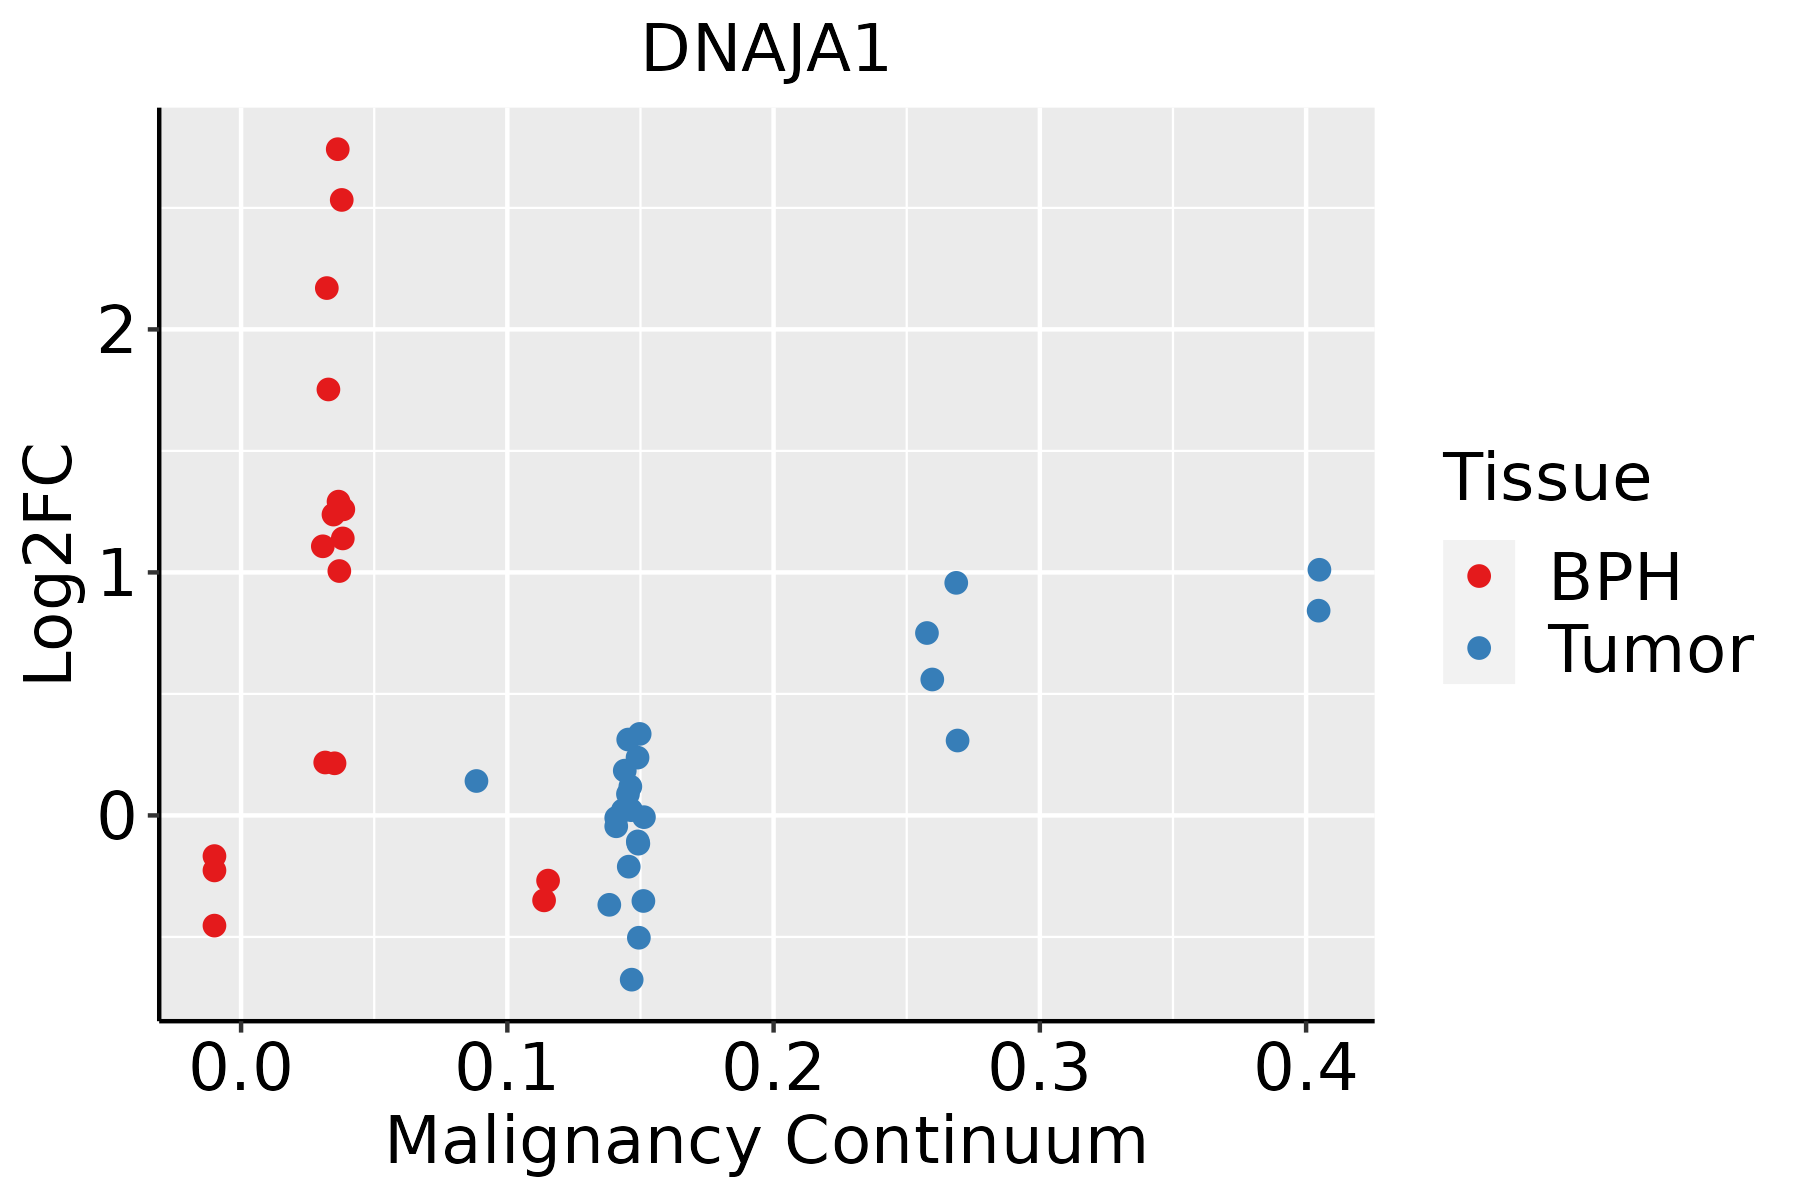 | BPH: Benign Prostatic Hyperplasia |
| Skin | 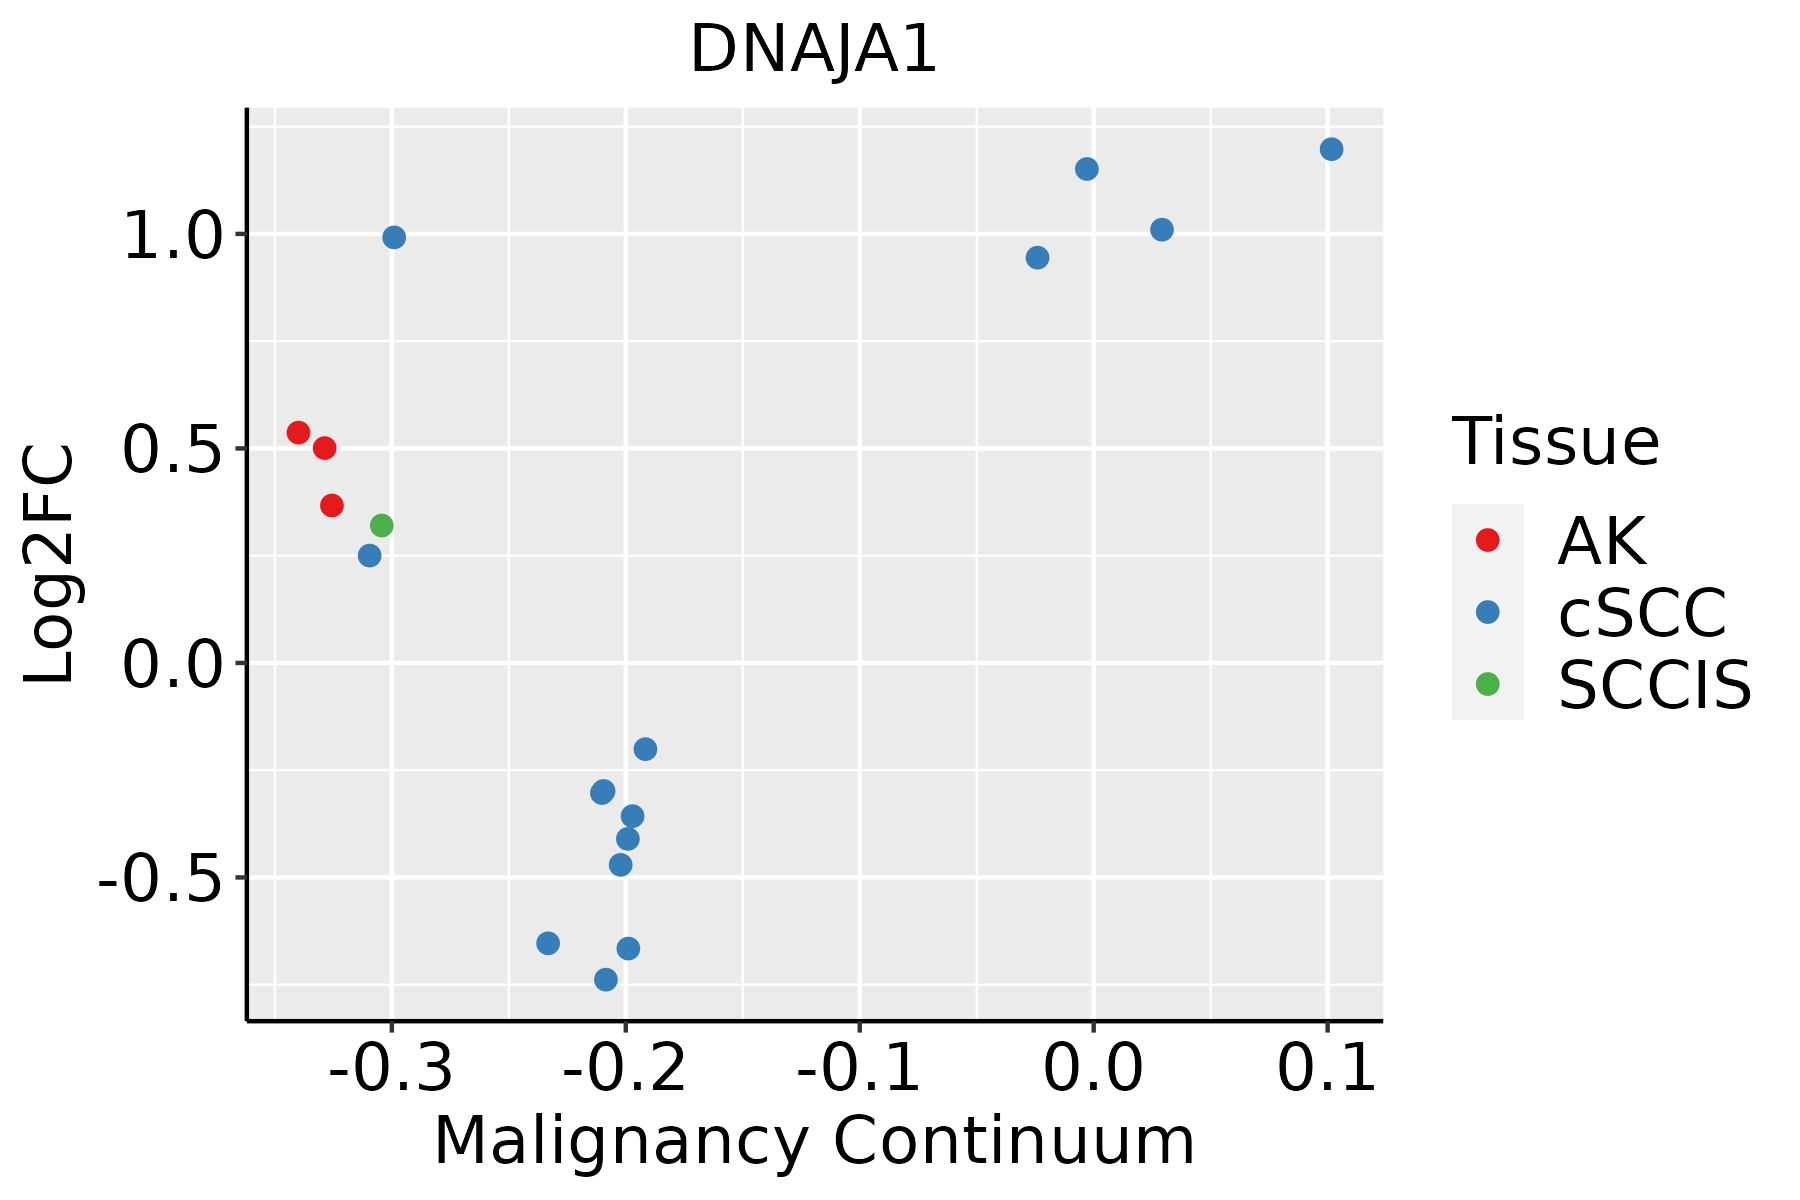 | AK: Actinic keratosis |
| cSCC: Cutaneous squamous cell carcinoma | ||
| SCCIS:squamous cell carcinoma in situ | ||
| Thyroid |  | ATC: Anaplastic thyroid cancer |
| HT: Hashimoto's thyroiditis | ||
| PTC: Papillary thyroid cancer |
| ∗log2FC in expression of this searched gene in stem-like cells from each diseased tissue sample relative to stem-like cells in normal samples in each tissue plotted against the malignancy continuum. Samples are colored based on if they are from different disease stage. |
Top |
Malignant transformation related pathway analysis |
| Find out the enriched GO biological processes and KEGG pathways involved in transition from healthy to precancer to cancer |
| Tissue | Disease Stage | Enriched GO biological Processes |
| Colorectum | AD |  |
| Colorectum | SER |  |
| Colorectum | MSS |  |
| Colorectum | MSI-H |  |
| Colorectum | FAP |  |
| ∗Top 15 enriched GO BP terms are showed in the bar plot of each disease state in each tissue. Each row represents a significant GO biological process which is colored according to the -log10(p.adjust). |
| Page: 1 2 3 4 5 6 7 8 9 |
| GO ID | Tissue | Disease Stage | Description | Gene Ratio | Bg Ratio | pvalue | p.adjust | Count |
| GO:00971939 | Breast | Precancer | intrinsic apoptotic signaling pathway | 59/1080 | 288/18723 | 8.07e-18 | 3.60e-15 | 59 |
| GO:20012339 | Breast | Precancer | regulation of apoptotic signaling pathway | 65/1080 | 356/18723 | 7.70e-17 | 3.17e-14 | 65 |
| GO:20012429 | Breast | Precancer | regulation of intrinsic apoptotic signaling pathway | 41/1080 | 164/18723 | 6.48e-16 | 2.31e-13 | 41 |
| GO:00064578 | Breast | Precancer | protein folding | 43/1080 | 212/18723 | 3.48e-13 | 7.45e-11 | 43 |
| GO:00485459 | Breast | Precancer | response to steroid hormone | 53/1080 | 339/18723 | 3.07e-11 | 3.66e-09 | 53 |
| GO:00621979 | Breast | Precancer | cellular response to chemical stress | 51/1080 | 337/18723 | 2.40e-10 | 2.34e-08 | 51 |
| GO:20012349 | Breast | Precancer | negative regulation of apoptotic signaling pathway | 39/1080 | 224/18723 | 5.35e-10 | 4.77e-08 | 39 |
| GO:00069869 | Breast | Precancer | response to unfolded protein | 28/1080 | 137/18723 | 3.81e-09 | 3.00e-07 | 28 |
| GO:20012439 | Breast | Precancer | negative regulation of intrinsic apoptotic signaling pathway | 23/1080 | 98/18723 | 5.82e-09 | 4.45e-07 | 23 |
| GO:19033209 | Breast | Precancer | regulation of protein modification by small protein conjugation or removal | 38/1080 | 242/18723 | 1.71e-08 | 1.17e-06 | 38 |
| GO:00359669 | Breast | Precancer | response to topologically incorrect protein | 29/1080 | 159/18723 | 3.00e-08 | 1.89e-06 | 29 |
| GO:19033219 | Breast | Precancer | negative regulation of protein modification by small protein conjugation or removal | 21/1080 | 95/18723 | 8.09e-08 | 4.61e-06 | 21 |
| GO:00313969 | Breast | Precancer | regulation of protein ubiquitination | 33/1080 | 210/18723 | 1.45e-07 | 7.82e-06 | 33 |
| GO:00313979 | Breast | Precancer | negative regulation of protein ubiquitination | 19/1080 | 83/18723 | 1.85e-07 | 9.54e-06 | 19 |
| GO:00092667 | Breast | Precancer | response to temperature stimulus | 27/1080 | 178/18723 | 3.85e-06 | 1.21e-04 | 27 |
| GO:00705858 | Breast | Precancer | protein localization to mitochondrion | 21/1080 | 125/18723 | 9.07e-06 | 2.42e-04 | 21 |
| GO:00726558 | Breast | Precancer | establishment of protein localization to mitochondrion | 20/1080 | 120/18723 | 1.66e-05 | 4.03e-04 | 20 |
| GO:00713838 | Breast | Precancer | cellular response to steroid hormone stimulus | 28/1080 | 204/18723 | 1.78e-05 | 4.26e-04 | 28 |
| GO:00094088 | Breast | Precancer | response to heat | 18/1080 | 110/18723 | 5.57e-05 | 1.15e-03 | 18 |
| GO:00305217 | Breast | Precancer | androgen receptor signaling pathway | 10/1080 | 44/18723 | 1.61e-04 | 2.69e-03 | 10 |
| Page: 1 2 3 4 5 6 7 8 9 10 11 12 13 14 15 16 17 18 19 20 21 22 23 24 25 26 27 28 29 30 31 32 33 34 35 36 37 38 39 40 41 42 43 44 45 46 47 48 49 50 51 52 53 54 55 56 57 58 59 60 61 62 63 64 65 66 67 68 69 70 |
| Pathway ID | Tissue | Disease Stage | Description | Gene Ratio | Bg Ratio | pvalue | p.adjust | qvalue | Count |
| hsa0414118 | Breast | Precancer | Protein processing in endoplasmic reticulum | 33/684 | 174/8465 | 2.78e-06 | 3.83e-05 | 2.94e-05 | 33 |
| hsa0414119 | Breast | Precancer | Protein processing in endoplasmic reticulum | 33/684 | 174/8465 | 2.78e-06 | 3.83e-05 | 2.94e-05 | 33 |
| hsa0414124 | Breast | IDC | Protein processing in endoplasmic reticulum | 36/867 | 174/8465 | 2.73e-05 | 2.86e-04 | 2.14e-04 | 36 |
| hsa0414134 | Breast | IDC | Protein processing in endoplasmic reticulum | 36/867 | 174/8465 | 2.73e-05 | 2.86e-04 | 2.14e-04 | 36 |
| hsa0414143 | Breast | DCIS | Protein processing in endoplasmic reticulum | 36/846 | 174/8465 | 1.60e-05 | 1.91e-04 | 1.41e-04 | 36 |
| hsa0414153 | Breast | DCIS | Protein processing in endoplasmic reticulum | 36/846 | 174/8465 | 1.60e-05 | 1.91e-04 | 1.41e-04 | 36 |
| hsa0414120 | Cervix | CC | Protein processing in endoplasmic reticulum | 55/1267 | 174/8465 | 1.74e-08 | 2.68e-07 | 1.58e-07 | 55 |
| hsa04141110 | Cervix | CC | Protein processing in endoplasmic reticulum | 55/1267 | 174/8465 | 1.74e-08 | 2.68e-07 | 1.58e-07 | 55 |
| hsa0414125 | Cervix | HSIL_HPV | Protein processing in endoplasmic reticulum | 21/459 | 174/8465 | 4.54e-04 | 3.80e-03 | 3.07e-03 | 21 |
| hsa0414135 | Cervix | HSIL_HPV | Protein processing in endoplasmic reticulum | 21/459 | 174/8465 | 4.54e-04 | 3.80e-03 | 3.07e-03 | 21 |
| hsa04141 | Colorectum | AD | Protein processing in endoplasmic reticulum | 80/2092 | 174/8465 | 5.96e-10 | 1.25e-08 | 7.96e-09 | 80 |
| hsa041411 | Colorectum | AD | Protein processing in endoplasmic reticulum | 80/2092 | 174/8465 | 5.96e-10 | 1.25e-08 | 7.96e-09 | 80 |
| hsa041412 | Colorectum | SER | Protein processing in endoplasmic reticulum | 60/1580 | 174/8465 | 4.20e-07 | 7.33e-06 | 5.32e-06 | 60 |
| hsa041413 | Colorectum | SER | Protein processing in endoplasmic reticulum | 60/1580 | 174/8465 | 4.20e-07 | 7.33e-06 | 5.32e-06 | 60 |
| hsa041414 | Colorectum | MSS | Protein processing in endoplasmic reticulum | 75/1875 | 174/8465 | 3.78e-10 | 8.44e-09 | 5.17e-09 | 75 |
| hsa041415 | Colorectum | MSS | Protein processing in endoplasmic reticulum | 75/1875 | 174/8465 | 3.78e-10 | 8.44e-09 | 5.17e-09 | 75 |
| hsa041416 | Colorectum | MSI-H | Protein processing in endoplasmic reticulum | 46/797 | 174/8465 | 4.53e-11 | 9.78e-10 | 8.19e-10 | 46 |
| hsa041417 | Colorectum | MSI-H | Protein processing in endoplasmic reticulum | 46/797 | 174/8465 | 4.53e-11 | 9.78e-10 | 8.19e-10 | 46 |
| hsa0414127 | Endometrium | EEC | Protein processing in endoplasmic reticulum | 64/1237 | 174/8465 | 2.17e-13 | 5.09e-12 | 3.80e-12 | 64 |
| hsa0414136 | Endometrium | EEC | Protein processing in endoplasmic reticulum | 64/1237 | 174/8465 | 2.17e-13 | 5.09e-12 | 3.80e-12 | 64 |
| Page: 1 2 3 |
Top |
Cell-cell communication analysis |
| Identification of potential cell-cell interactions between two cell types and their ligand-receptor pairs for different disease states |
| Ligand | Receptor | LRpair | Pathway | Tissue | Disease Stage |
| Page: 1 |
Top |
Single-cell gene regulatory network inference analysis |
| Find out the significant the regulons (TFs) and the target genes of each regulon across cell types for different disease states |
| TF | Cell Type | Tissue | Disease Stage | Target Gene | RSS | Regulon Activity |
| ∗The dot plots of a searched regulon are shown for all cell subpopulations in each disease state of each tissue based on the regulon specific score inferred using pySCENIC and by calculating the average expression. |
| Page: 1 |
Top |
Somatic mutation of malignant transformation related genes |
| Annotation of somatic variants for genes involved in malignant transformation |
| Hugo Symbol | Variant Class | Variant Classification | dbSNP RS | HGVSc | HGVSp | HGVSp Short | SWISSPROT | BIOTYPE | SIFT | PolyPhen | Tumor Sample Barcode | Tissue | Histology | Sex | Age | Stage | Therapy Types | Drugs | Outcome |
| DNAJA1 | SNV | Missense_Mutation | c.967N>A | p.Glu323Lys | p.E323K | P31689 | protein_coding | tolerated(0.93) | benign(0.001) | TCGA-AC-A23H-01 | Breast | breast invasive carcinoma | Female | >=65 | I/II | Unknown | Unknown | PD | |
| DNAJA1 | SNV | Missense_Mutation | c.749T>G | p.Val250Gly | p.V250G | P31689 | protein_coding | tolerated(0.08) | benign(0.127) | TCGA-AN-A0AK-01 | Breast | breast invasive carcinoma | Female | >=65 | I/II | Unknown | Unknown | SD | |
| DNAJA1 | insertion | Frame_Shift_Ins | novel | c.952_953insTCTTCTCCTC | p.Gly318ValfsTer11 | p.G318Vfs*11 | P31689 | protein_coding | TCGA-BH-A0E0-01 | Breast | breast invasive carcinoma | Female | <65 | III/IV | Chemotherapy | docetaxel | SD | ||
| DNAJA1 | deletion | Frame_Shift_Del | novel | c.380delN | p.Ala127ValfsTer6 | p.A127Vfs*6 | P31689 | protein_coding | TCGA-D8-A27V-01 | Breast | breast invasive carcinoma | Female | <65 | I/II | Hormone Therapy | tamoxiphen | SD | ||
| DNAJA1 | SNV | Missense_Mutation | rs141132012 | c.1120N>T | p.Arg374Cys | p.R374C | P31689 | protein_coding | deleterious(0.04) | benign(0.339) | TCGA-2W-A8YY-01 | Cervix | cervical & endocervical cancer | Female | <65 | I/II | Chemotherapy | cisplatin | CR |
| DNAJA1 | SNV | Missense_Mutation | c.1099N>A | p.Asp367Asn | p.D367N | P31689 | protein_coding | tolerated(0.25) | benign(0.027) | TCGA-IR-A3LL-01 | Cervix | cervical & endocervical cancer | Female | <65 | I/II | Chemotherapy | cisplatin | CR | |
| DNAJA1 | SNV | Missense_Mutation | c.619N>G | p.Ile207Val | p.I207V | P31689 | protein_coding | tolerated(0.41) | benign(0.078) | TCGA-AA-3710-01 | Colorectum | colon adenocarcinoma | Female | >=65 | I/II | Unknown | Unknown | SD | |
| DNAJA1 | SNV | Missense_Mutation | c.533T>C | p.Met178Thr | p.M178T | P31689 | protein_coding | tolerated(0.62) | benign(0.027) | TCGA-AA-A010-01 | Colorectum | colon adenocarcinoma | Female | <65 | I/II | Chemotherapy | folinic | CR | |
| DNAJA1 | SNV | Missense_Mutation | c.422N>A | p.Gly141Glu | p.G141E | P31689 | protein_coding | deleterious(0) | probably_damaging(0.994) | TCGA-AD-6895-01 | Colorectum | colon adenocarcinoma | Male | >=65 | III/IV | Unknown | Unknown | SD | |
| DNAJA1 | SNV | Missense_Mutation | rs141132012 | c.1120C>T | p.Arg374Cys | p.R374C | P31689 | protein_coding | deleterious(0.04) | benign(0.339) | TCGA-AZ-6598-01 | Colorectum | colon adenocarcinoma | Female | >=65 | I/II | Unknown | Unknown | SD |
| Page: 1 2 3 4 |
Top |
Related drugs of malignant transformation related genes |
| Identification of chemicals and drugs interact with genes involved in malignant transfromation |
| (DGIdb 4.0) |
| Entrez ID | Symbol | Category | Interaction Types | Drug Claim Name | Drug Name | PMIDs |
| Page: 1 |

Copyright 2023-Present -The University of Texas Health Science Center at Houston |